Table of contents
Table of contents
How to create a cross-functional flowchart: a step-by-step guide for teams
Summary
In this guide, you will learn:
- How to define functions/stakeholders for cross-functional flowchart lanes
- How to outline process start/end points for logical workflow mapping
- How to add/arrange steps, decisions, and connections in correct lanes
- How to use Miro's tools/templates for efficient flowchart building/customization
- How to collaborate by sharing, commenting, and updating flowcharts in real time
- Best practices for integrating and maintaining flowcharts with other process templates
Collaborative AI Workflows
Join thousands of teams using Miro to build the right thing, faster.
When working across different teams or departments, keeping everyone aligned can feel like a juggling act. A cross-functional flowchart helps clarify complex workflows, ensuring every team knows exactly when and where they fit into the process. Whether you’re in product development, software engineering, or managing a cross-functional project, creating a well-organized flowchart can streamline communication and prevent bottlenecks. In this guide, we’ll walk you through everything you need to know about building effective cross-functional flowcharts.
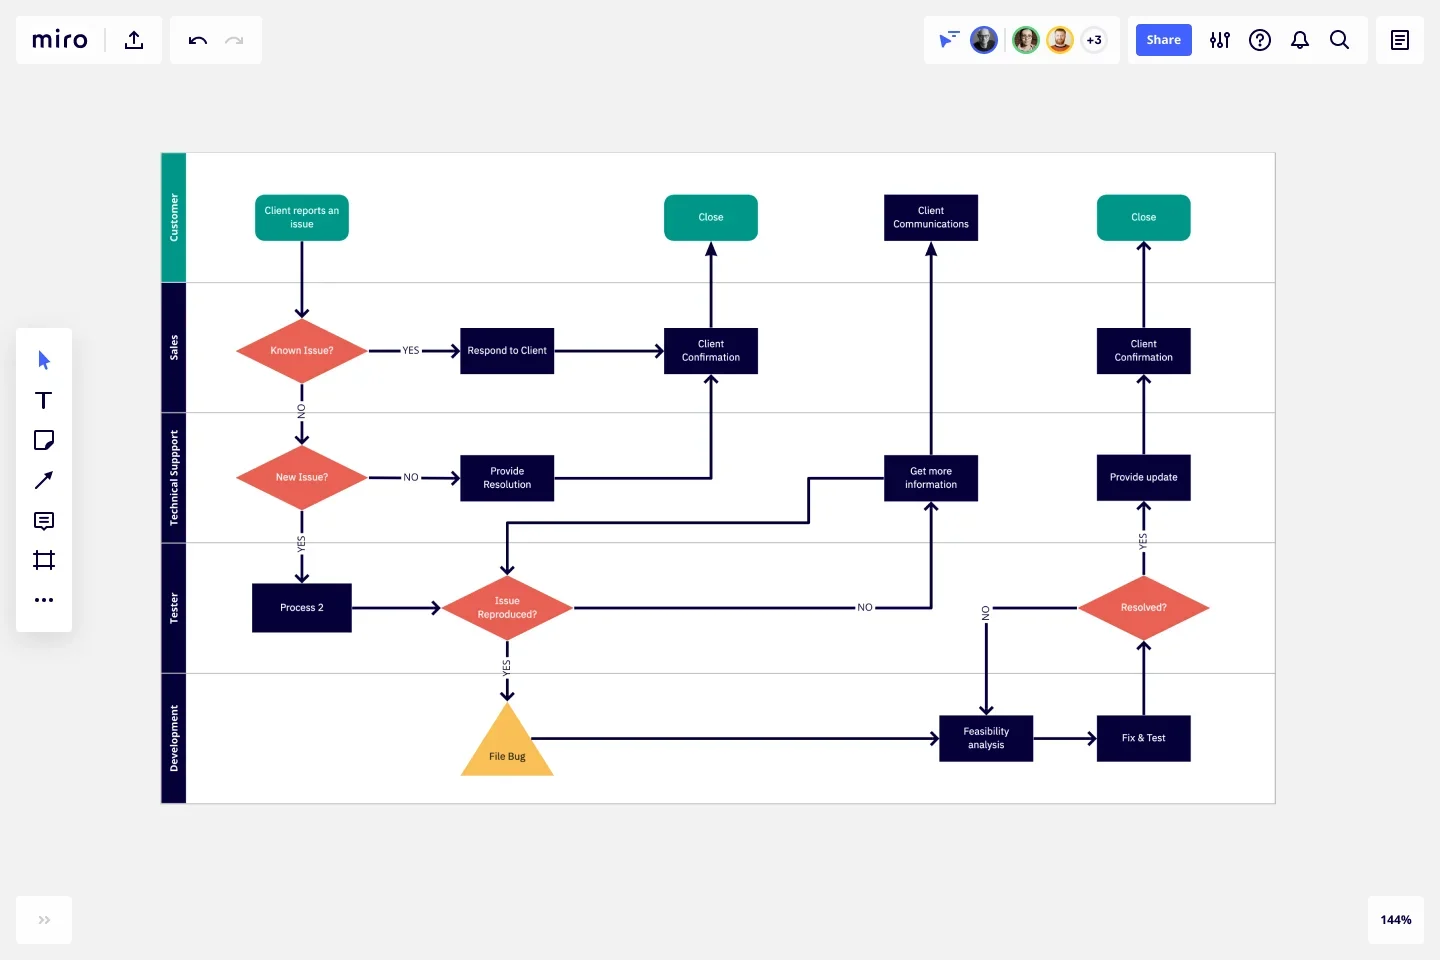
What is a cross-functional flowchart?
A cross-functional flowchart, or swimlane diagram, is a visual tool that shows how a process flows across different teams, roles, or departments. Each “lane” in the chart represents a function or department, mapping out the tasks or decisions they own throughout the process. This makes it easy to see where responsibilities shift from one team to another and spot inefficiencies that might be slowing down your workflow.
For product and development teams, these cross functional diagrams are indispensable. They offer a clear view of how a process flows end-to-end and help ensure everyone understands their role. Instead of wondering who’s responsible for what, cross-functional flowcharts lay everything out in a clean, organized manner.
How to choose the right cross-functional flowchart
Choosing the right type of flowchart depends on the complexity of your process and who will be using it. Here are three common types of cross-functional flowcharts to consider:
Swimlane flowchart: This is the most popular type of cross-functional diagram. It divides a process into lanes, with each lane assigned to a department, team, or role. Swimlane diagrams are ideal for processes that involve multiple handoffs between different teams and help make sure nothing falls through the cracks.
Deployment flowchart: Similar to swimlane flowcharts, deployment diagrams also show which team or individual is responsible for each step. However, these flowcharts focus more on the physical movement of tasks, showing how work “deploys” from one team or location to another. They’re useful for projects where physical resources, tools, or locations play a key role.
Consider your audience and the complexity of the workflow when choosing the right chart. Are you trying to capture a high-level view of your entire product lifecycle, or do you need to visualize a detailed, team-specific process? This decision will guide your flowchart structure and level of detail.
How to create a cross-functional flowchart step-by-step
Building a cross-functional flowchart doesn’t have to be overwhelming. Follow these simple steps to create a flowchart that brings clarity and alignment to your team.
1. Identify your key functions and lanes
Start by determining which departments or roles are involved in the process. Each lane in your flowchart will represent one of these functions. For instance, in a product launch process, you might have lanes for product development, marketing, legal, and customer support.
2. Outline your process
Think through the steps that need to be completed from start to finish. What initiates the process? What triggers the next step? It’s helpful to talk with stakeholders from each department to understand their role in the workflow. Ensure you capture any dependencies or handoffs between teams. You can also use one of our ready-made flowchart templates, tutorials, and community support.
3. Place your steps in the correct lanes
Once you’ve outlined the steps, position each task in the corresponding lane of the team responsible for it. This will make it clear who owns each part of the process and help prevent confusion.
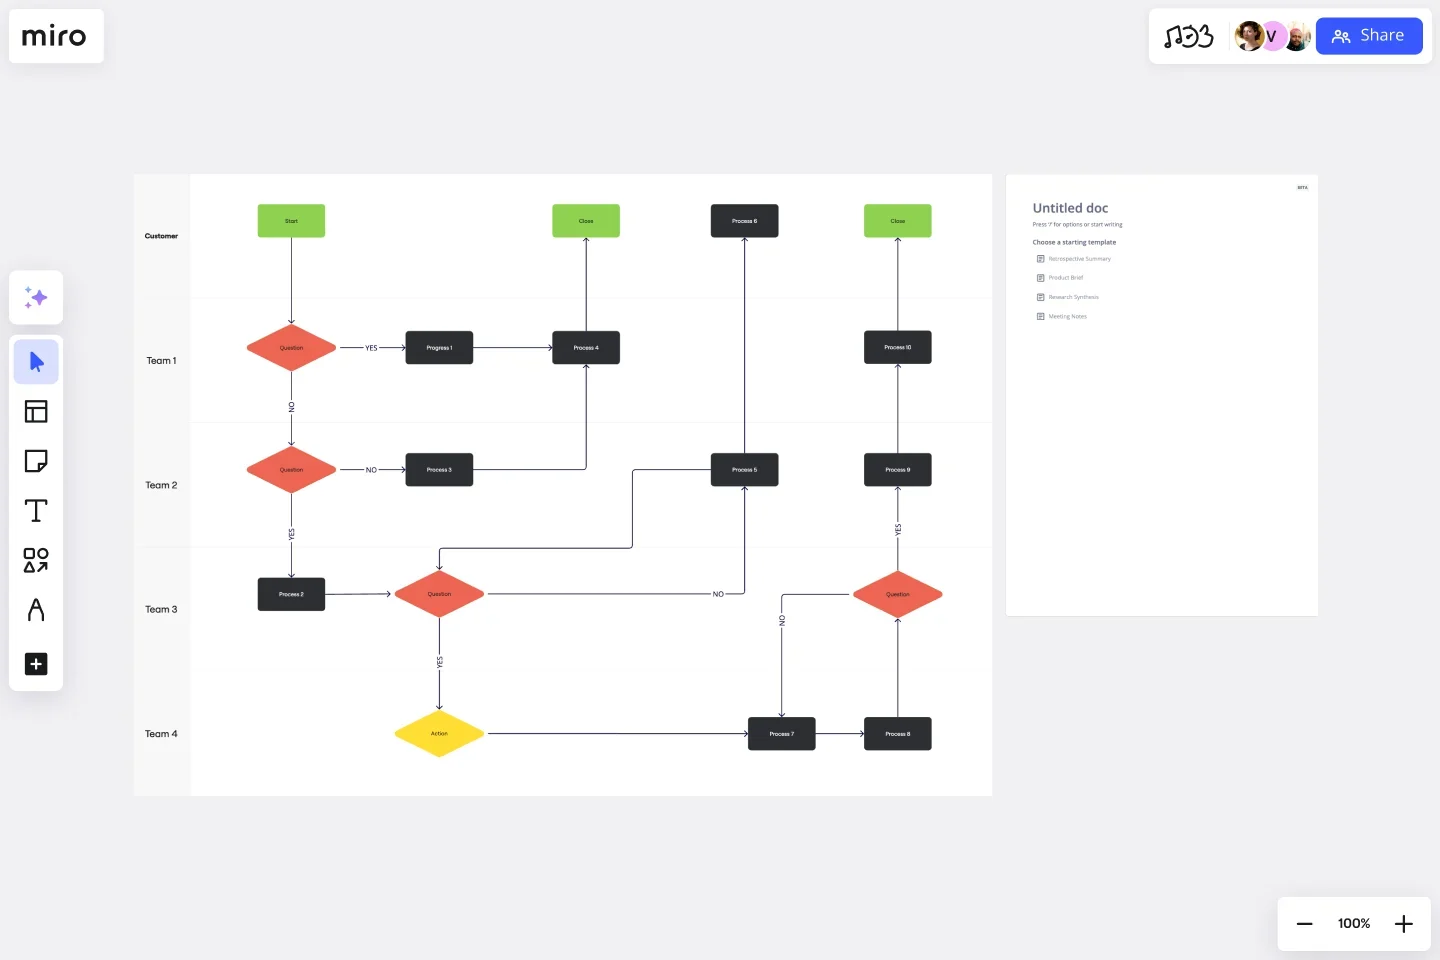
4. Use shapes and connectors for clarity
To make your flowchart easy to follow, use distinct shapes and connectors to represent tasks, decisions, and the flow of the process. For example, you can use rectangles for tasks, diamonds for decision points, and arrows to show the direction of the workflow. Consistent shapes make it easier for viewers to interpret the chart quickly.
5. Add labels and details
Don’t forget to label each step in your flowchart. Be specific—add details like timeframes, task owners, or any critical information needed to complete each step. Clear labels keep everyone on the same page and help prevent delays caused by miscommunication.
6. Review and refine with your team
Once the flowchart is built, share it with the stakeholders involved for feedback. Make sure the flow accurately reflects the process and adjust where needed. Having team members review the flowchart helps catch any missed steps or inaccuracies before you put it into action.
Tips and common mistakes to avoid when creating your cross-functional flowchart
Flowchart creation can seem straightforward, but there are a few key tips and mistakes to keep in mind.
Tip 1: Simplify where possible
It’s tempting to add every detail into your flowchart, but that can overwhelm your team and make it hard to follow. Stick to the most essential steps and keep your flowchart streamlined for easy understanding.
Mistake to avoid: Adding too much detail
Overloading your flowchart with every small task or decision can clutter the diagram. Instead of bringing clarity, it can confuse your audience. Focus on the key elements that drive the process forward, and leave out any unnecessary details.
Tip 2: Make handoffs crystal clear
One of the main advantages of a cross-functional flowchart is its ability to show handoffs between teams. Make sure it’s clear when and where these occur so everyone knows when the responsibility shifts.
Mistake to avoid: Unclear transitions between teams
If handoffs aren’t clearly marked, confusion will follow. Teams might not realize when a task is waiting for them, leading to delays or missed steps. Ensure you use clear symbols or labels to show when responsibilities move between lanes.
Tip 3: Involve all stakeholders
Since multiple teams are part of the process, make sure every team has input during the flowchart’s creation. This prevents misunderstandings and ensures the process is accurately represented.
Mistake to avoid: Skipping team reviews
Failing to get feedback from all involved teams can lead to errors or missed steps. It’s essential to get input from everyone so the flowchart reflects the actual workflow.
Get inspired by some of our cross-functional flowchart examples
Need some inspiration? Here are a few types of cross-functional flowcharts that you can adapt to suit your workflow:
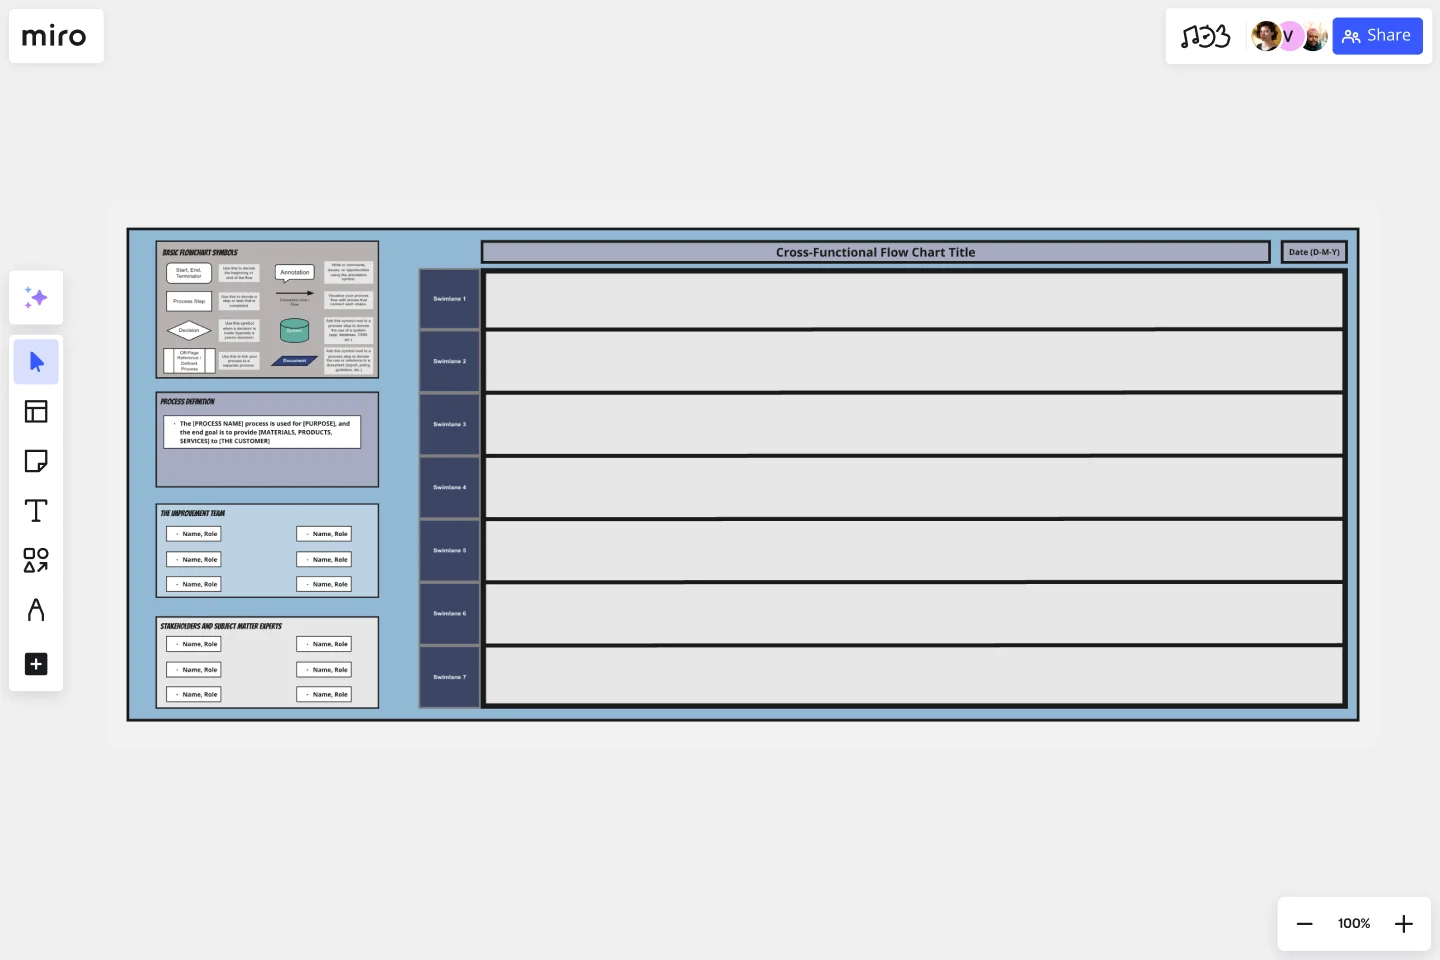
Cross-functional flowchart: This template is perfect for mapping processes that involve multiple teams. Each lane is clearly divided by department, making it easy to visualize handoffs and ensure accountability across the organization.
Cross-functional flowchart by Hiro Studio: This template combines clean design with a flexible layout, making it ideal for complex processes. It includes customizable lanes and detailed task breakdowns, so you can add as much or as little detail as you need.

Swimlane flowchart: A classic choice for teams that need a high-level view of how their process flows across functions. Swimlane flowcharts clearly define responsibilities and help teams identify where delays or bottlenecks are occurring.

Team (XFN) chart: Designed for cross-functional teams, this template helps align goals, track progress, and ensure everyone is in sync. It’s particularly useful for product and development teams working together on long-term projects.
Best practices for collaborative flowcharting
Mapping complex processes involving multiple stakeholders can be a challenge, especially when everyone needs to stay aligned. Here are some best practices for collaborative flowcharting:
Involve key stakeholders from the start: Bring all relevant team members into the process from the beginning. Whether it’s product, marketing, or engineering, each department should have input to ensure the flowchart reflects reality and prevents misunderstandings later.
Break down the process in stages: For especially complex workflows, it can help to break down the process into smaller stages. This allows you to focus on one segment of the process at a time and simplifies the review process.
Keep communication clear and consistent: Use clear labeling, symbols, and connectors in your flowchart to avoid confusion. Provide detailed explanations where needed, but avoid overcrowding the diagram with unnecessary details. It’s important that the flowchart remains easy to follow at all times.
Assign ownership to each step: Make sure every step in the process has a clear owner. This helps ensure accountability and prevents tasks from falling through the cracks.
Use regular check-ins to keep teams aligned: If the process evolves over time, schedule regular check-ins with key stakeholders to make updates and ensure the flowchart remains accurate. This prevents misalignment as teams shift priorities or responsibilities.
Take your diagramming to the next level with Miro
Ready to build your flowchart faster and with more flexibility than ever? Miro’s innovation workspace helps teams create detailed, collaborative flowcharts with ease. With over 2,500 expert diagramming shapes, ready-made templates, and AI-powered diagramming capabilities, Miro makes it simple to bring complex workflows to life. Whether you’re working in real-time or asynchronously, Miro’s platform keeps everyone aligned. Plus, with powerful collaboration features like live editing, commenting, and flexible permissions, your team can refine, review, and iterate on your flowchart quickly.
With Miro, you can streamline your processes, improve team collaboration, and get your flowcharts up and running in record time. Try out Miro’s flowcharting capabilities today and see how it can help your team work smarter, not harder.
By following these steps, using the right templates, and adopting best practices, you’ll be able to create cross functional diagrams that keep your team in sync and your processes running smoothly.
Author: Miro Team
Last update: October 10, 2025