Your guide to UML deployment diagrams
Summary
In this guide, you will learn:
- What a UML deployment diagram is and its role in modeling software deployment
- The core components: nodes, artifacts, communication paths, and execution environments
- How to methodically create a deployment diagram
- Notation and symbols for devices, execution environments, databases, and communication paths
- Differences between deployment diagrams and other UML diagrams
- Practical applications and examples of visualizing system architecture and deployment planning
Collaborative AI Workflows
Join thousands of teams using Miro to build the right thing, faster.
Deployment diagrams are a type of UML diagram that showcases the physical deployment of artifacts on nodes. To put it simply, they describe the hardware components where software components are installed. Components represent code: a single component can be a standalone program or a collection of scripts or source files.
In this guide, we’ll dive into what deployment diagrams are, including the core components that make up a UML deployment diagram. We’ll also look at how to create a deployment diagram and run through its use cases and benefits. Let's jump in.
What is a deployment diagram?
A deployment diagram is a type of Unified Modeling Language (UML) diagram that is used to represent the physical deployment of a system's components. It shows how software artifacts are allocated to hardware components, known as nodes, and illustrates the physical configurations of software and hardware that are critical for the execution, operation, and scaling of a system. These diagrams are used by software and system engineers to detail and understand the complex infrastructure and network setups where the system is to be deployed.
Key elements of a deployment diagram
Before we proceed to the nuts and bolts of creating a deployment diagram, it’s important to understand its key components. This subsection will outline the primary elements you will encounter and utilize when developing a deployment diagram.
Nodes
Nodes are often depicted as a cube and represent the physical elements of a system, like servers or devices.

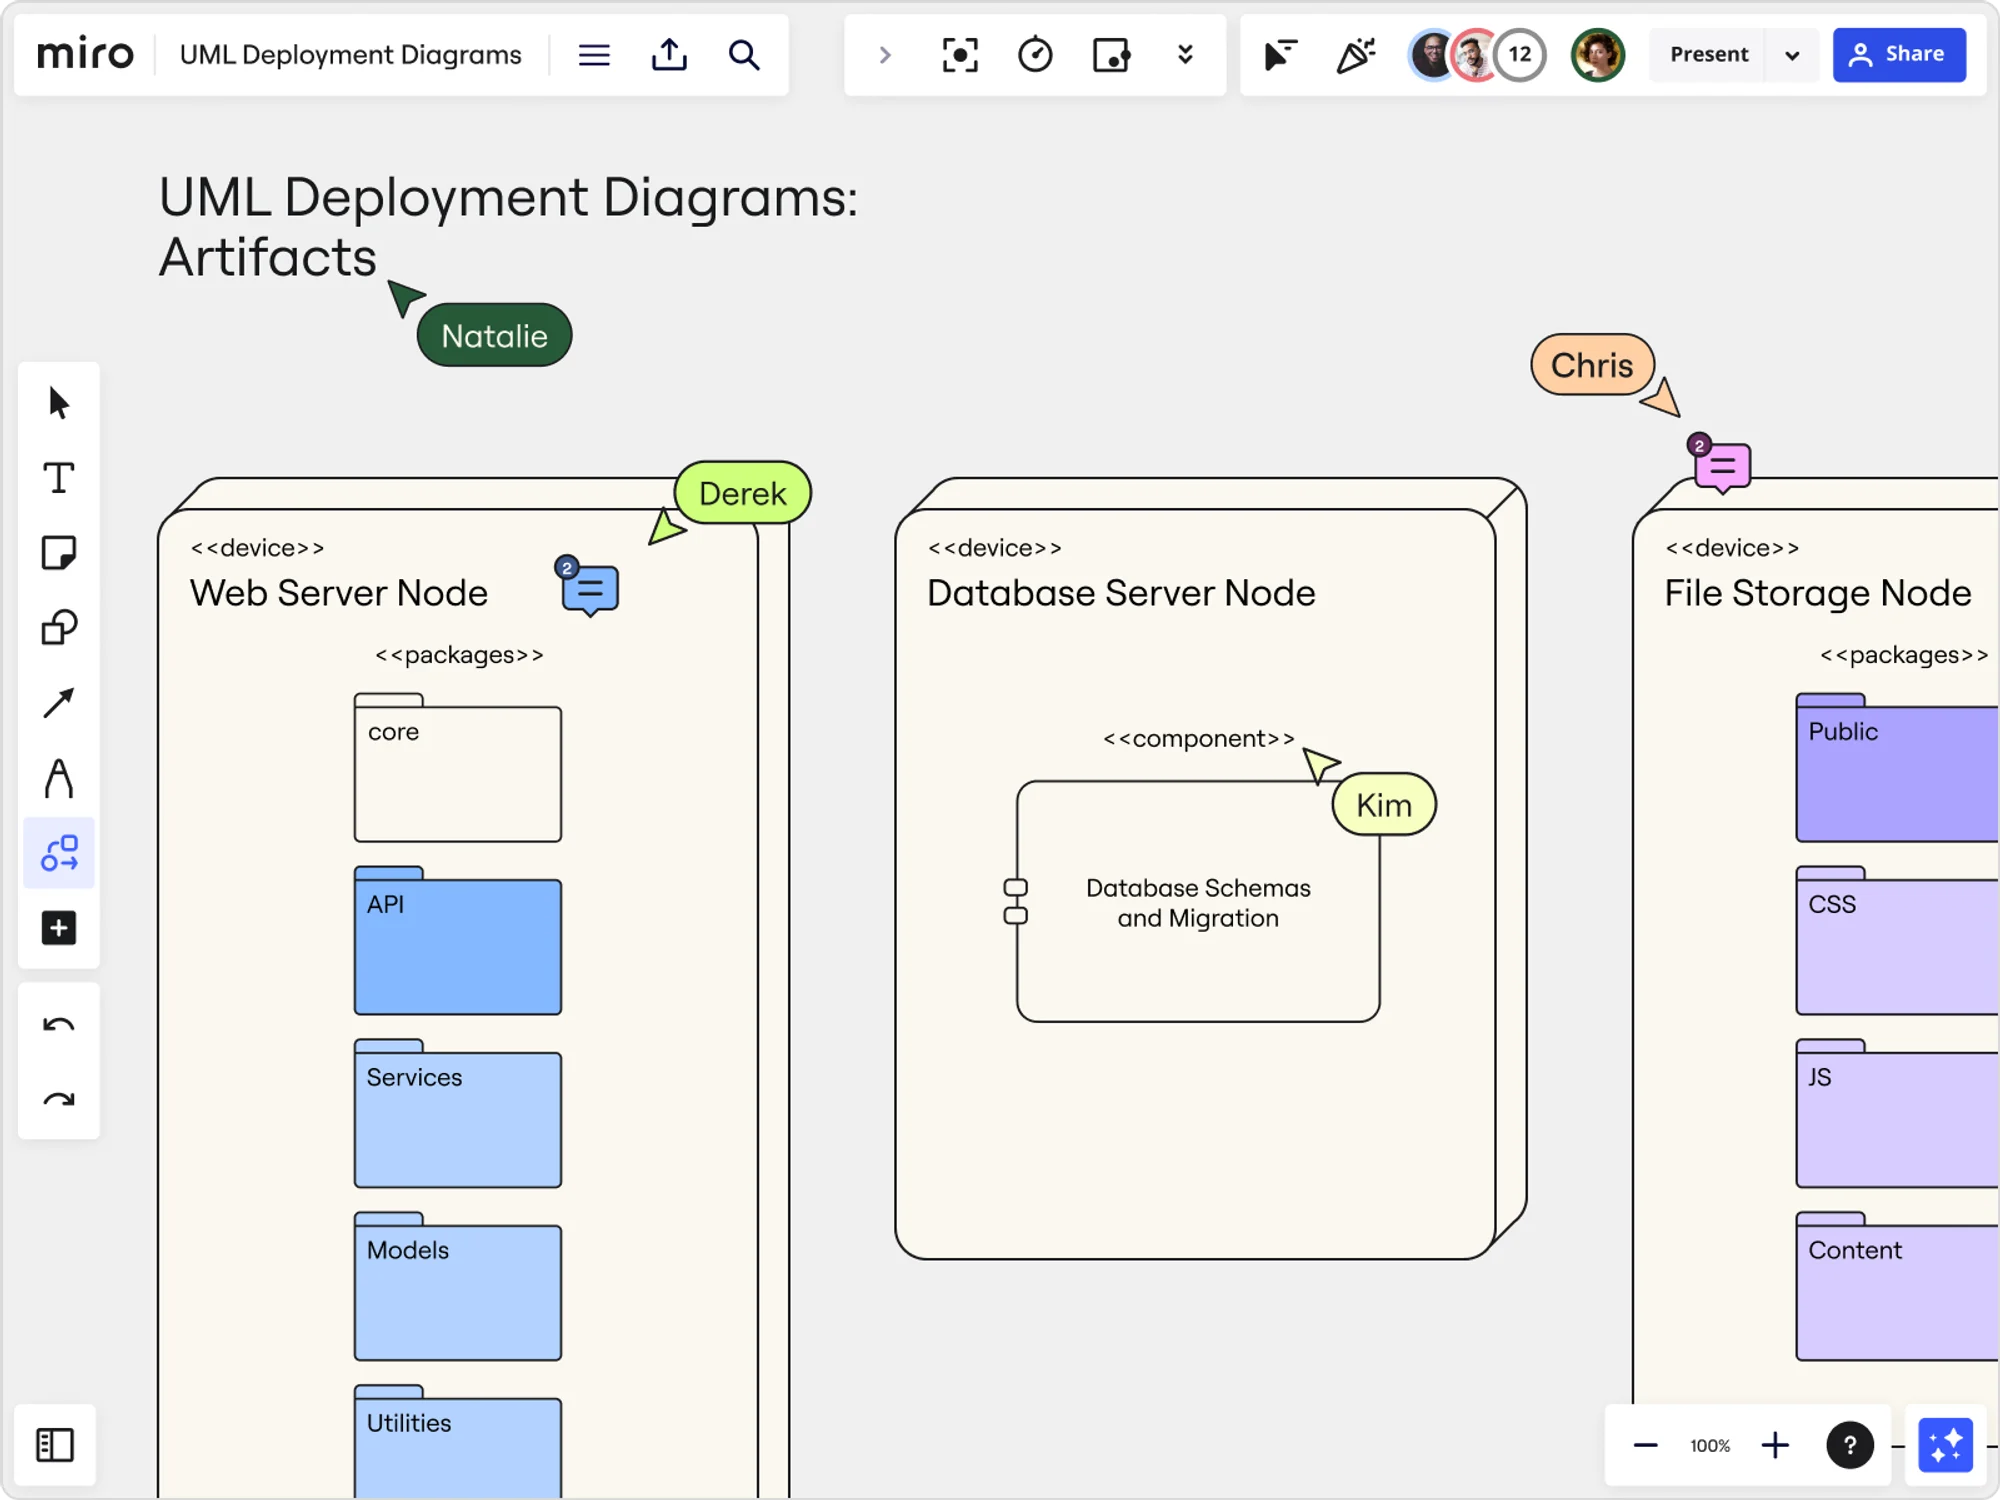
Artifacts
Artifacts are the tangible elements, such as software programs or files, that live on the nodes.
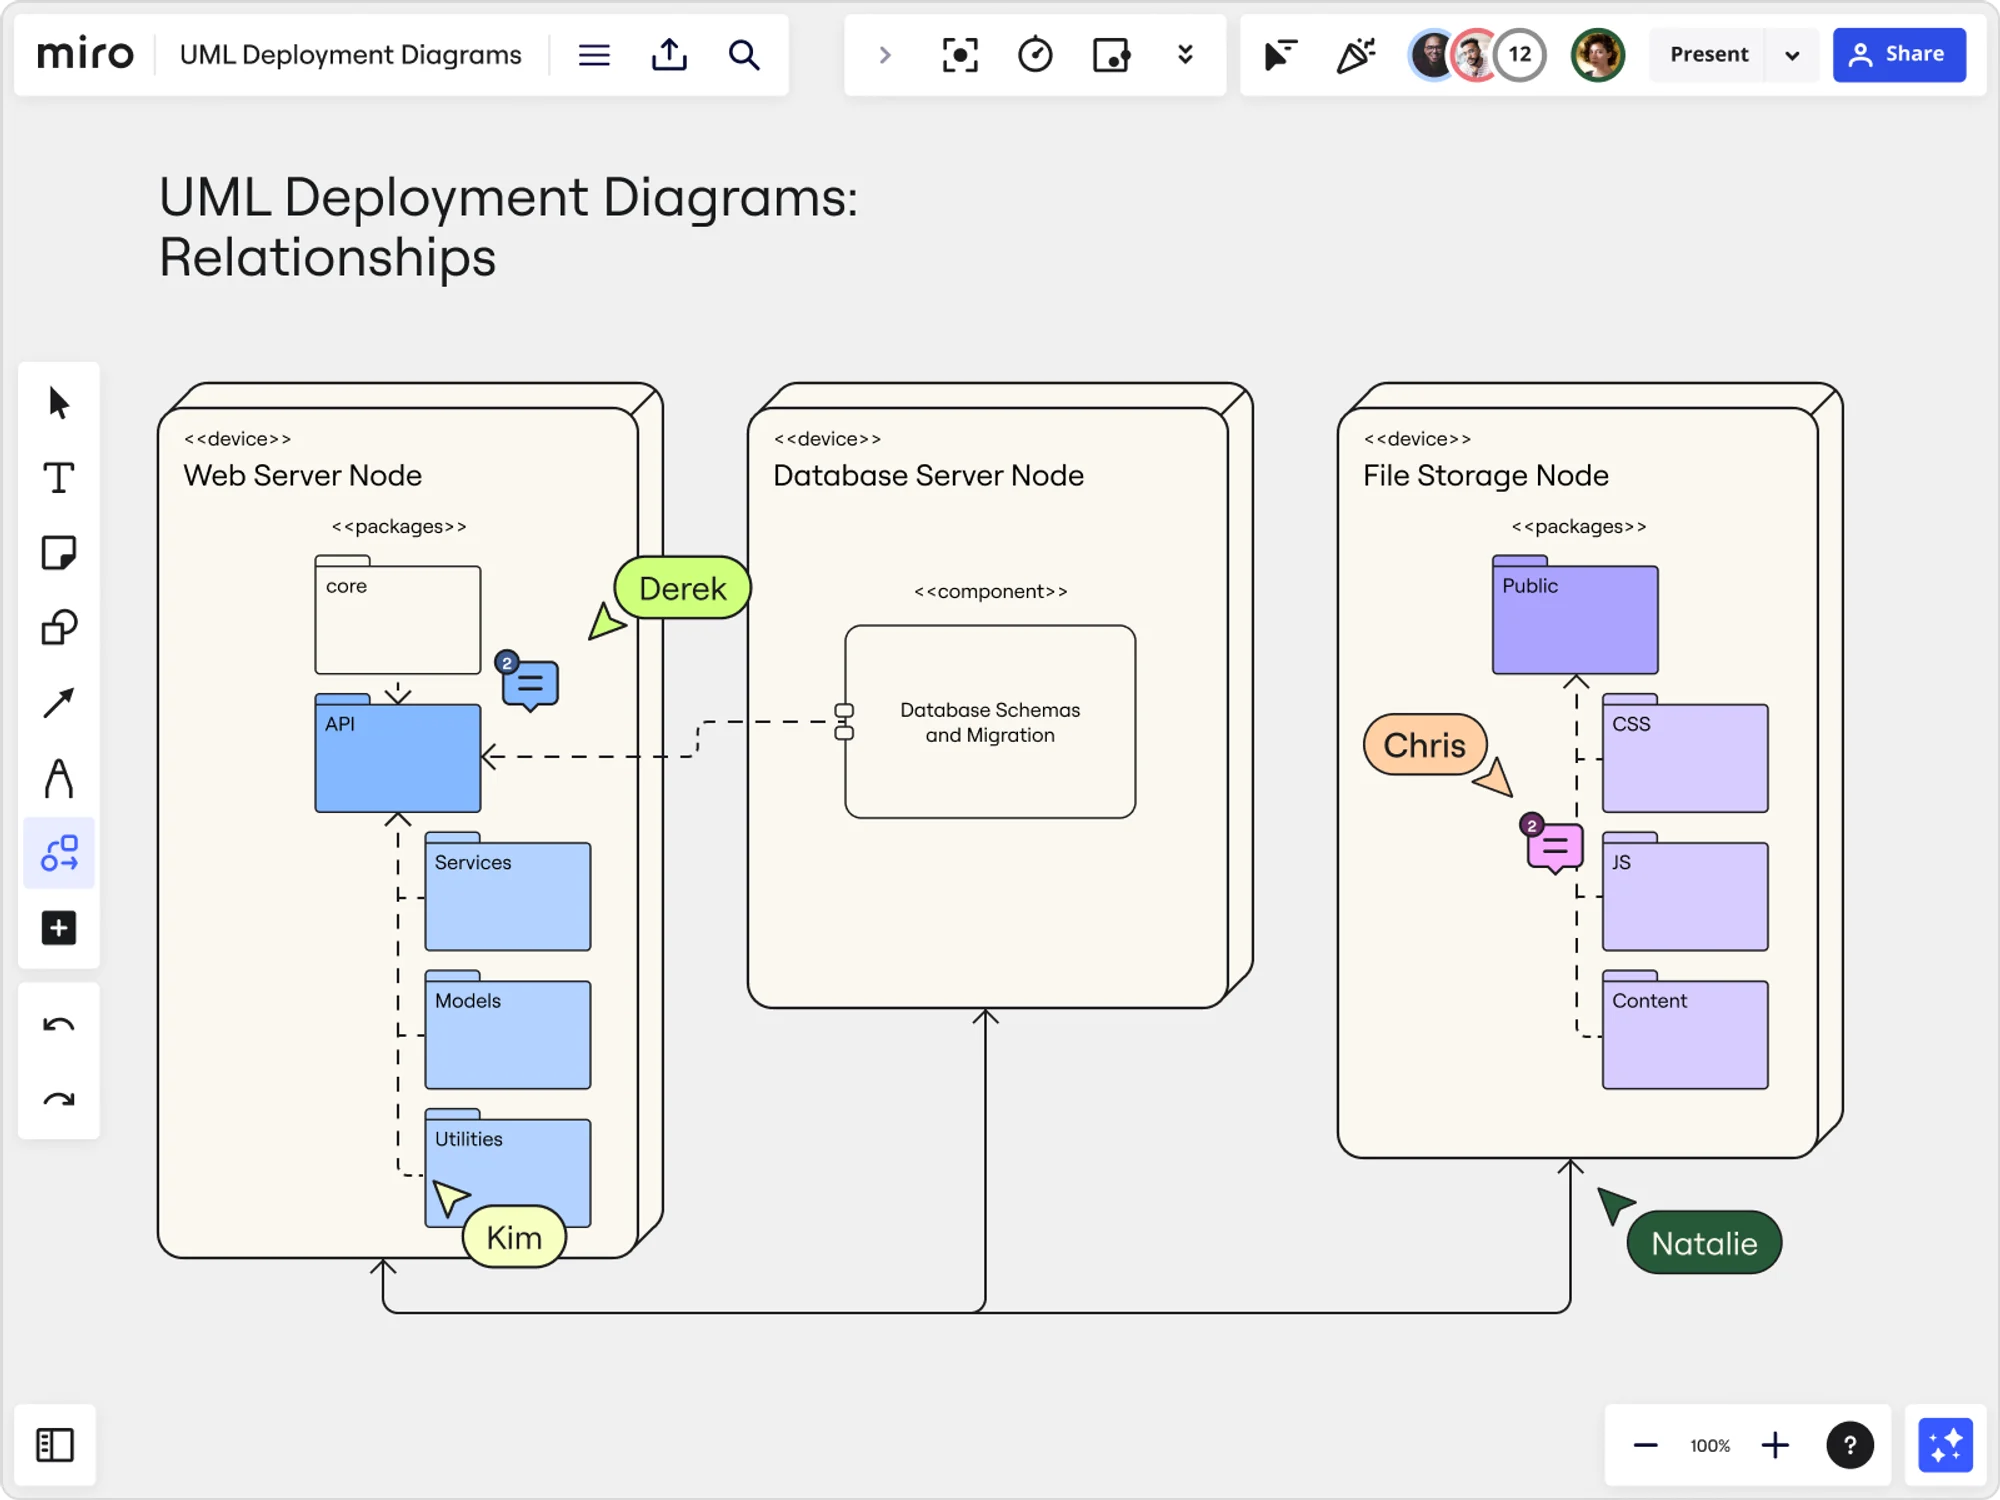
Relationships
Relationships illustrate how artifacts are connected and how they communicate across the system.
How to create a deployment diagram
Creating a UML deployment diagram is an iterative and methodical process that requires a detailed understanding of the system's hardware and software architecture. This section guides you through the nuanced steps to construct a comprehensive deployment diagram and outlines best practices to enhance clarity and usefulness.
To create a deployment diagram, you can use Miro’s UML diagram tool. Simply follow these detailed steps:
1. Identify the nodes
Begin by identifying all physical components that will host your system components, such as servers, devices, and nodes. Consider the physical location, network structure, and processing environment of each node.
2. Outline the software artifacts
Determine all software artifacts that will be deployed. These can include compiled code, databases, libraries, or any other executables. Clearly specify the version and configuration details for each artifact.
3. Establish relationships
Define the communication paths between the nodes. This will involve setting up association, dependency, or deployment relationships, which are depicted through specific connectors and directional arrows in the diagram.
4. Configure artifacts on nodes:
Allocate each software artifact to a node, showing where each piece of the system will be placed. This can include web servers hosting your applications, database servers managing your data, or any middleware necessary for the communication between software components.
5. Detail the environment
Besides the hardware and software, include the execution environment which could be a specific operating system, a cloud-based platform, or a containerized solution like Docker.
6. Annotate the diagram
Add notes or constraints to the diagram where necessary. This might include specific network configurations, firewall rules, or any other pertinent information that affects deployment.
Best practices for creating deployment diagrams
When crafting a deployment diagram, consider these best practices:
Keep it legible
Use a clear and consistent layout to ensure the diagram remains readable, even as it scales.
Update it regularly
Keep the diagram current with system changes to avoid misinformation.
Use tools effectively
Utilize UML tools that facilitate collaboration and version control.
Involve stakeholders
Make sure to involve network architects, developers, and system admins in the creation process to ensure accuracy.
Simplify when possible
Do not overcrowd the diagram with excessive detail that could be documented elsewhere, focus on the key elements that provide insight into the deployment.
Analyzing UML deployment diagrams
A deployment diagram is not just a static representation; it is a snapshot of your system's infrastructure at a moment in time. Understanding how to analyze this snapshot is crucial for making informed decisions about scaling, redundancy, and resource allocation.
Interpreting the diagram
To interpret a deployment diagram effectively, you should:
- Look for single points of failure that could affect system uptime.
- Identify potential bottlenecks in communication paths.
- Assess if the system is scalable as depicted.
- Ensure that each component is correctly associated with its environment and resources.
- Verify that the deployment configuration aligns with security and compliance requirements.
Use cases for deployment diagrams
Deployment diagrams are particularly valuable in scenarios such as:
- Cloud migration: Understanding how components will shift from on-premises servers to cloud services.
- Disaster recovery planning: Ensuring that there is a clear plan for system restoration in different geographical locations.
- System scaling: Planning for horizontal or vertical scaling by accurately understanding the current deployment state.
- New team onboarding: Providing new developers or engineers with a clear picture of the system's physical architecture.
By expanding the content to include a more in-depth look at creating and analyzing deployment diagrams, we offer a richer resource for readers seeking to understand and apply UML deployment diagrams in various scenarios.
Benefits of using deployment diagrams
Here, we’ll discuss the advantages of using deployment diagrams, from simplifying complex system architectures to improving communication among stakeholders. The benefits highlighted in this section underscore why deployment diagrams are indispensable in the realm of system design.
Simplification of complex systems
Deployment diagrams break down complex system architectures into manageable visuals.
Enhanced communication
These diagrams serve as a common language between developers, engineers, and stakeholders, ensuring everyone understands the system's physical architecture.
Documentation and standardization
Creating deployment diagrams helps in documenting the physical aspects of a system, which can be particularly useful for onboarding new team members and standardizing deployments.
Conclusion
Deployment diagrams are more than mere technical drawings; they are a bridge between the conceptual and the physical, a tool for clarity and precision in the complex world of software development. By utilizing UML deployment diagrams effectively, you ensure a comprehensive understanding of the physical layout of your system, leading to better design decisions, enhanced communication, and a smoother software deployment process.
Remember, as with any map, the value of a deployment diagram lies not just in its creation but in its usage. Regularly revisiting and revising your deployment diagrams is crucial to maintain an accurate and helpful overview of your system's architecture.
Author: Miro Team
Last update: October 10, 2025