HR Resource Planning Template
Introduction
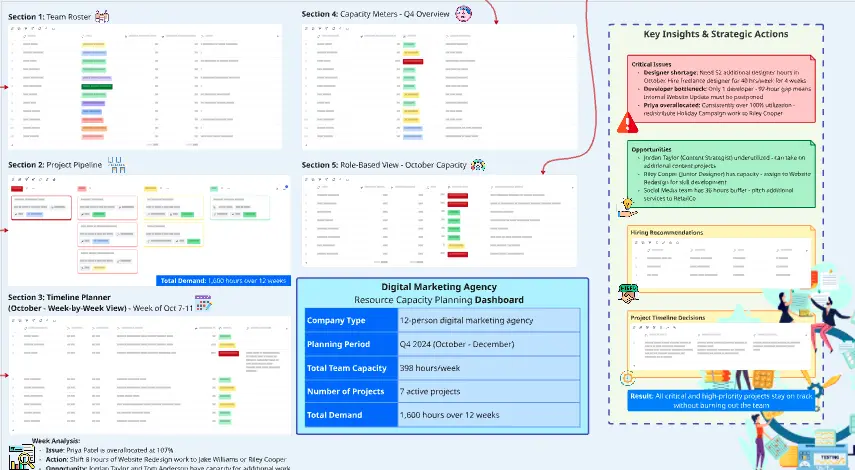
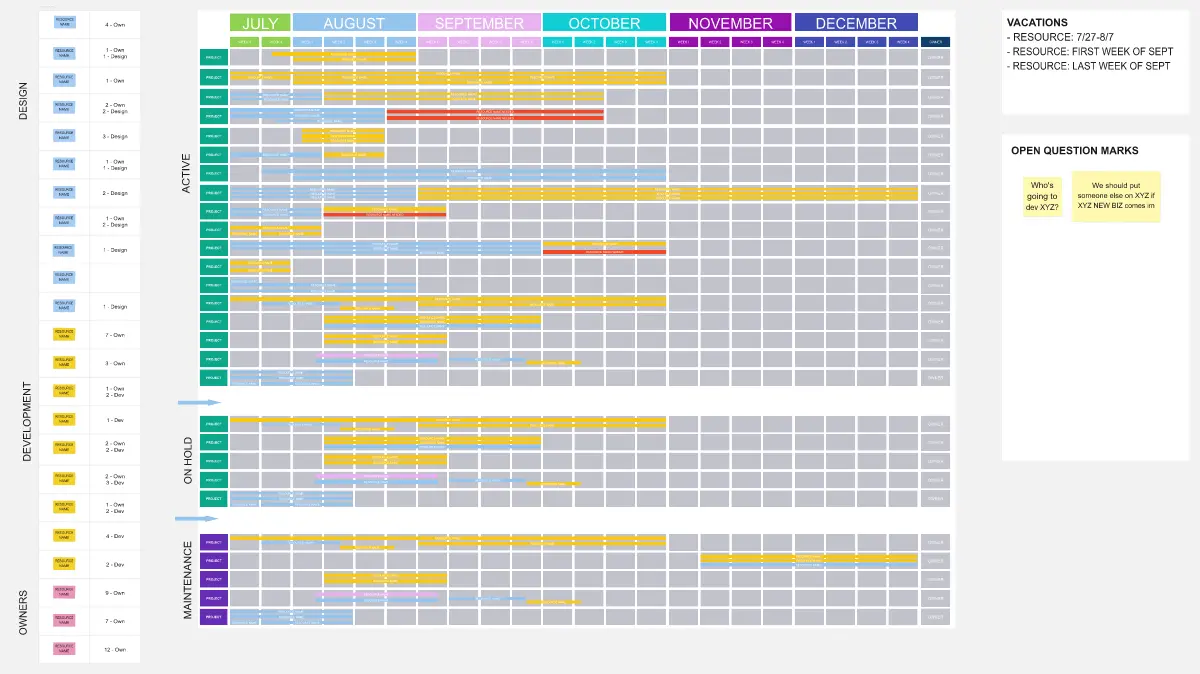
This HR Resource Planning Template is designed to centralize workforce planning activities and track resource allocation across HR initiatives. The template enables HR teams to manage multiple concurrent projects, monitor progress, and visualize team member workload distribution. By combining task management with resource tracking, this tool helps prevent overallocation, ensures balanced workloads, and provides visibility into capacity constraints across the HR department.
Filling Instructions
Task Information
Task: Enter the name of the HR initiative or project
Description: Provide a clear explanation of the work scope and objectives
Start Date: Set the project initiation date
End Date: Define the target completion date
Priority: Assign urgency level (High, Medium, Low) based on business impact
Status: Update progress indicator (Not Started, In Progress, Complete)
Resource Allocation
Enter estimated hours in each team member's column (Patrick, Jia, Hans, Sonia, Ali, Raza, Kelly, Reid, Shaun)
Leave cells blank for team members not involved in specific tasks
Review total hours per person to identify workload imbalances
Adjust allocations to optimize team capacity
Best Practices
Update status regularly to reflect current progress
Prioritize high-impact initiatives during resource planning
Review the distribution pattern to avoid overloading specific team members
Use the template as a living document for capacity planning discussions
3D Pie Chart Generation Prompt
To create a visual representation of resource distribution:
"Generate a 3D pie chart that displays total hours allocated to each team member. Calculate the sum of all hours for Patrick, Jia, Hans, Sonia, Ali, Raza, Kelly, Reid, and Shaun across all tasks in the resource planning table. Create one segment per team member, labeled with their name and total hours (format: 'Name: XX hours'). Apply distinct colors to each segment for clear differentiation. Add 3D depth effects with shadow and perspective to enhance visual dimensionality. Ensure labels are positioned for maximum readability without overlapping."
This visualization helps identify workload distribution patterns, highlight heavily allocated resources, and support data-driven rebalancing decisions.
Cheers!
Khawaja Rizwan