Looking for a simple way to compare ideas and uncover connections? This 5 Venn Diagram Overlay Layout helps you visualize how multiple topics, teams, concepts, or categories relate to one another in a clear and engaging format.
Whether you're brainstorming, mapping relationships, analyzing data, or facilitating a workshop, this template makes it easy to see where things overlap and what they have in common.
Great for
Comparing multiple concepts or ideas
Team and stakeholder mapping
Product and feature analysis
Business and strategy workshops
Research and education
Process and capability mapping
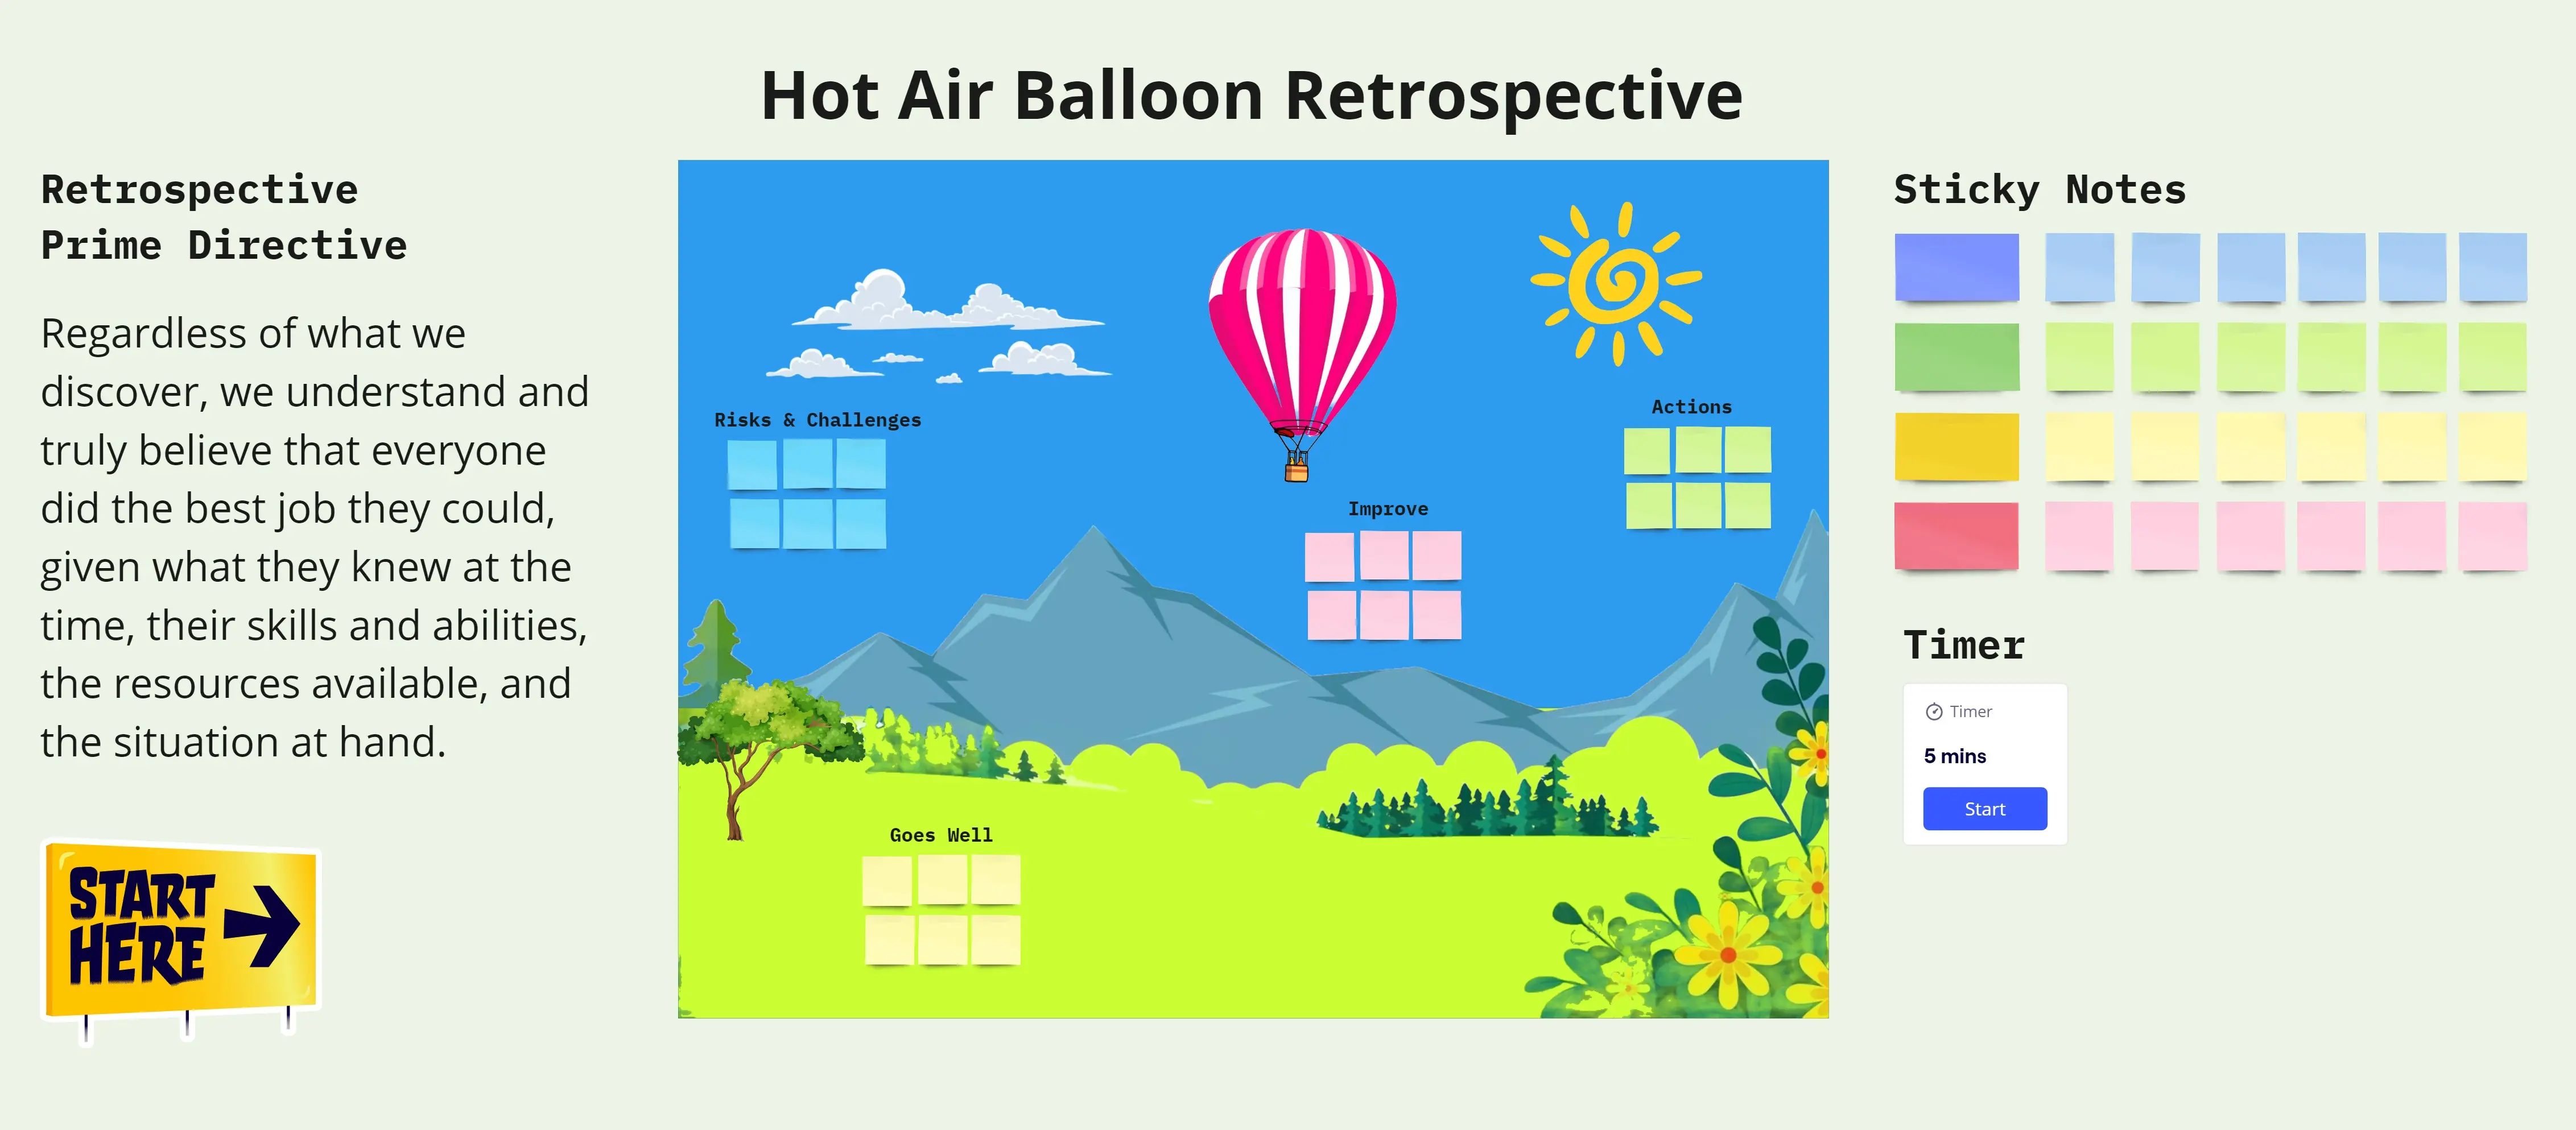
Brainstorming sessions
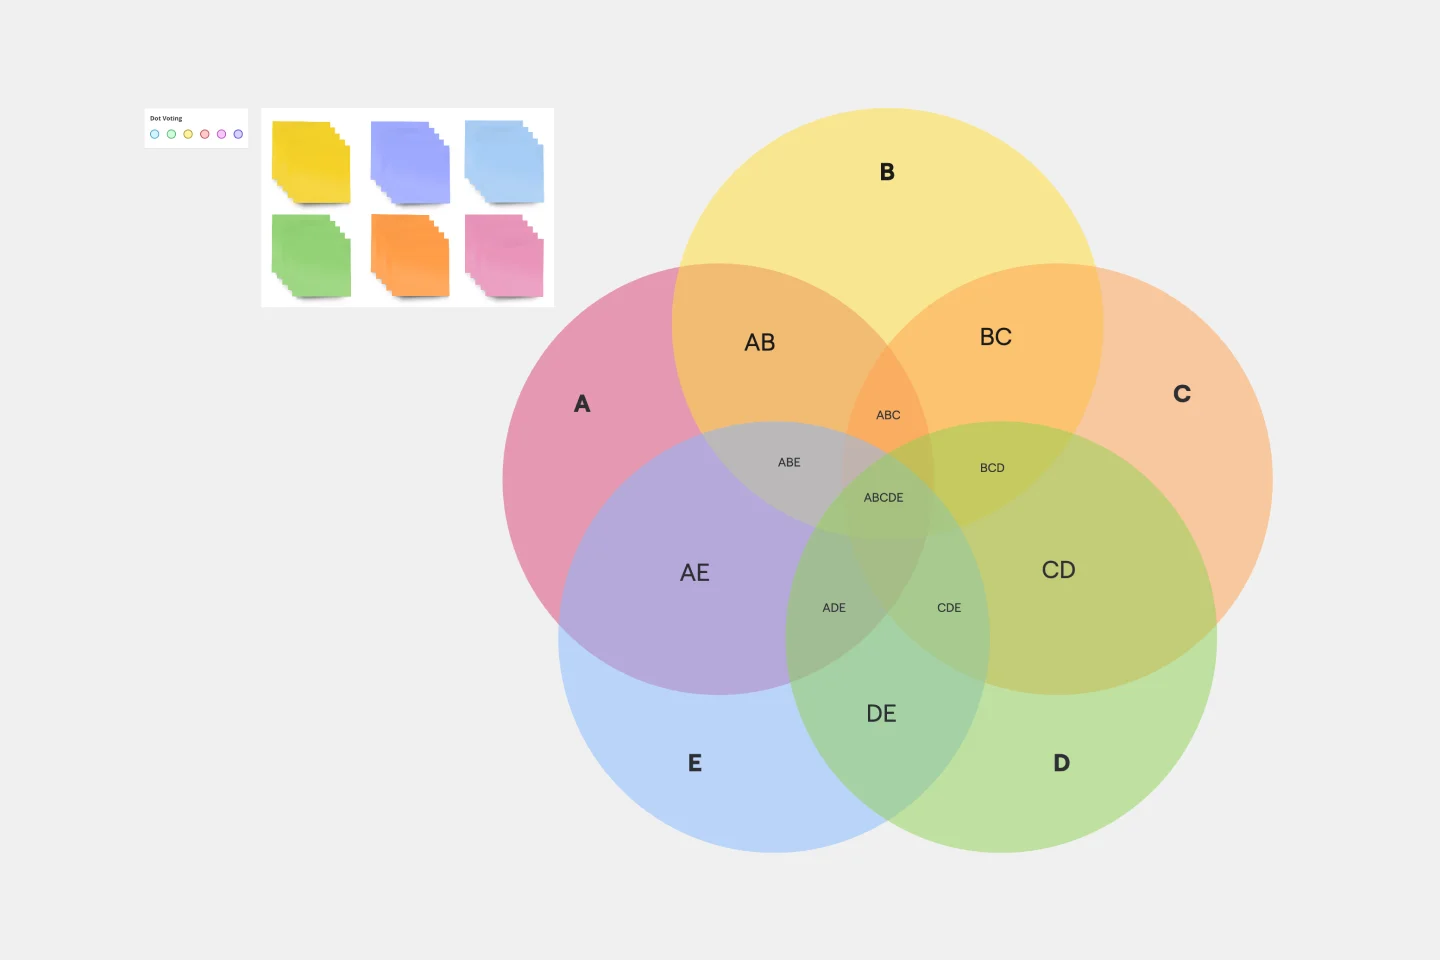
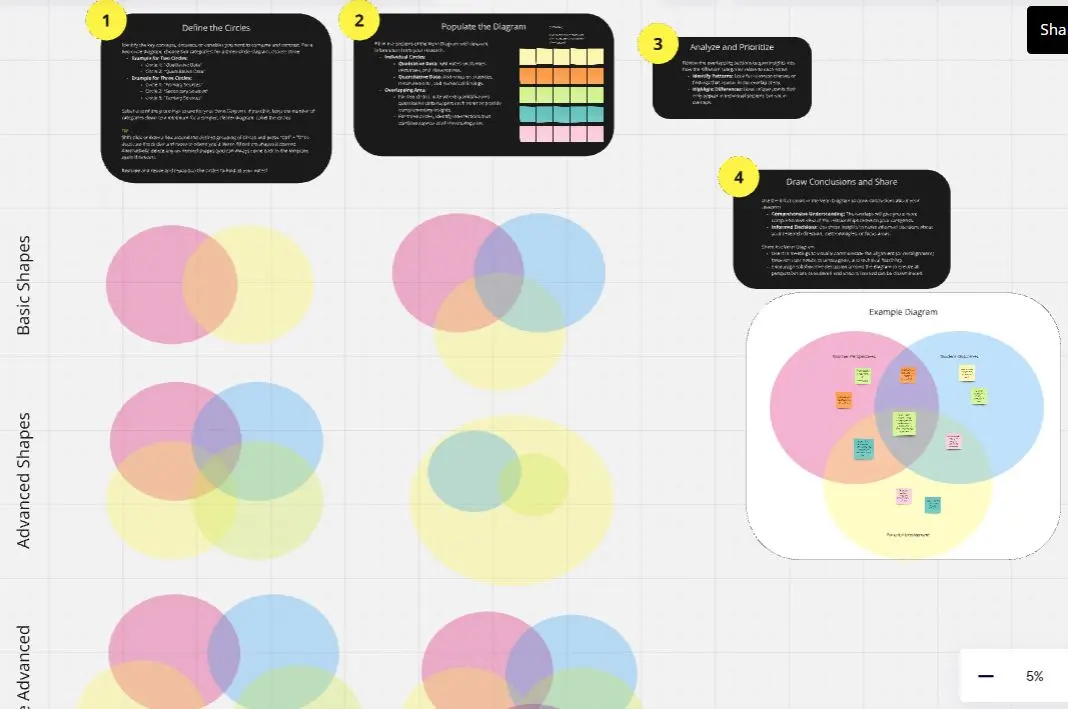
How it works
Add a title to each circle.
Fill the circles with key ideas, topics, teams, or data points.
Use the overlapping sections to show shared characteristics, dependencies, or connections.
Add supporting context in the description area on the left.
Customize the colors, labels, and content to fit your needs.