All templates

Timeline Diagram Infographic

Rizwan Khawaja

43 views
1 uses
0 likes

Report

Timeline Diagram Infographic

Overview

A multi-phase project timeline spanning 7-9 weeks with color-coded markers for each stage. Weekly columns track progress with checkmarks, while vertical task details flow from each milestone marker.

How to Fill

  • Replace week numbers with your time periods (weeks, months, sprints)

  • Update milestone markers with your project phases

  • Assign unique colors to different project stages for visual clarity

  • Add task names and descriptions to each marker

  • Include start/end dates in the data table

  • Attach detailed action items or deliverables below each milestone

Ideal Use Cases

Project management workflows, product development cycles, event planning, construction phases, software releases, marketing campaigns, employee onboarding, research milestones, training programs, sales pipelines, consulting engagements, design sprints, launch roadmaps, change management initiatives, or any sequential process requiring clear visualization of tasks, dependencies, and timeframes.

Cheers!

Khawaja Rizwan

Rizwan Khawaja

Solution Architect @ ICT Consultant

I hold master's degrees in computer science and project management along with trainings and certifications in various technologies. All this is coupled with 25+ years of industry experience.


Categories

Similar templates

15 likes
1.4K uses
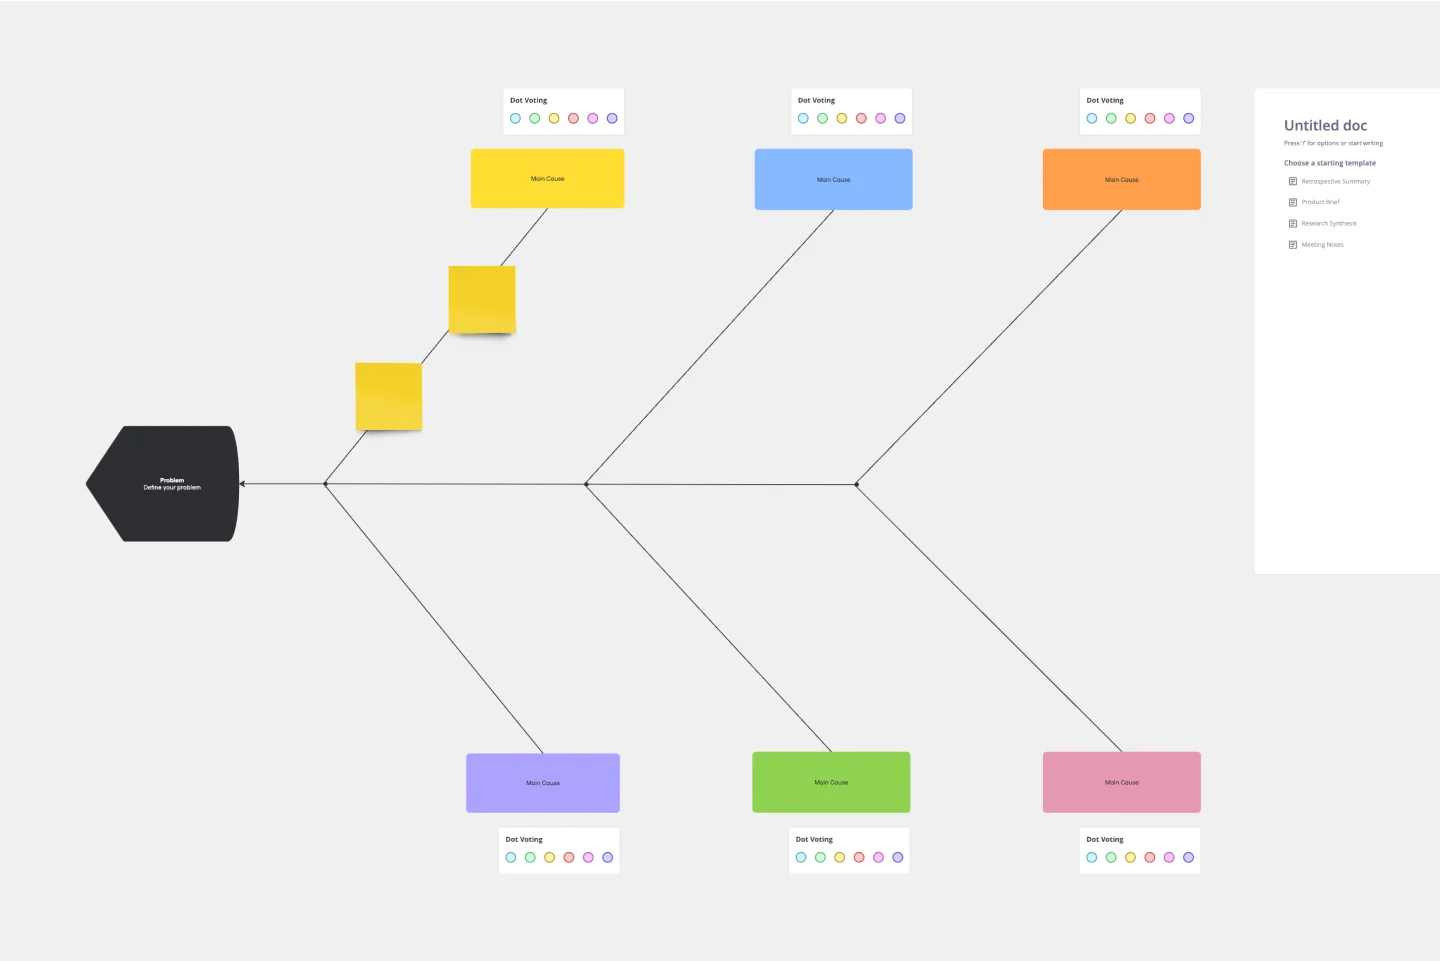
Fishbone Diagram Template
124 likes
673 uses
Timeline Workflow