T Chart for Comparison Template
Description
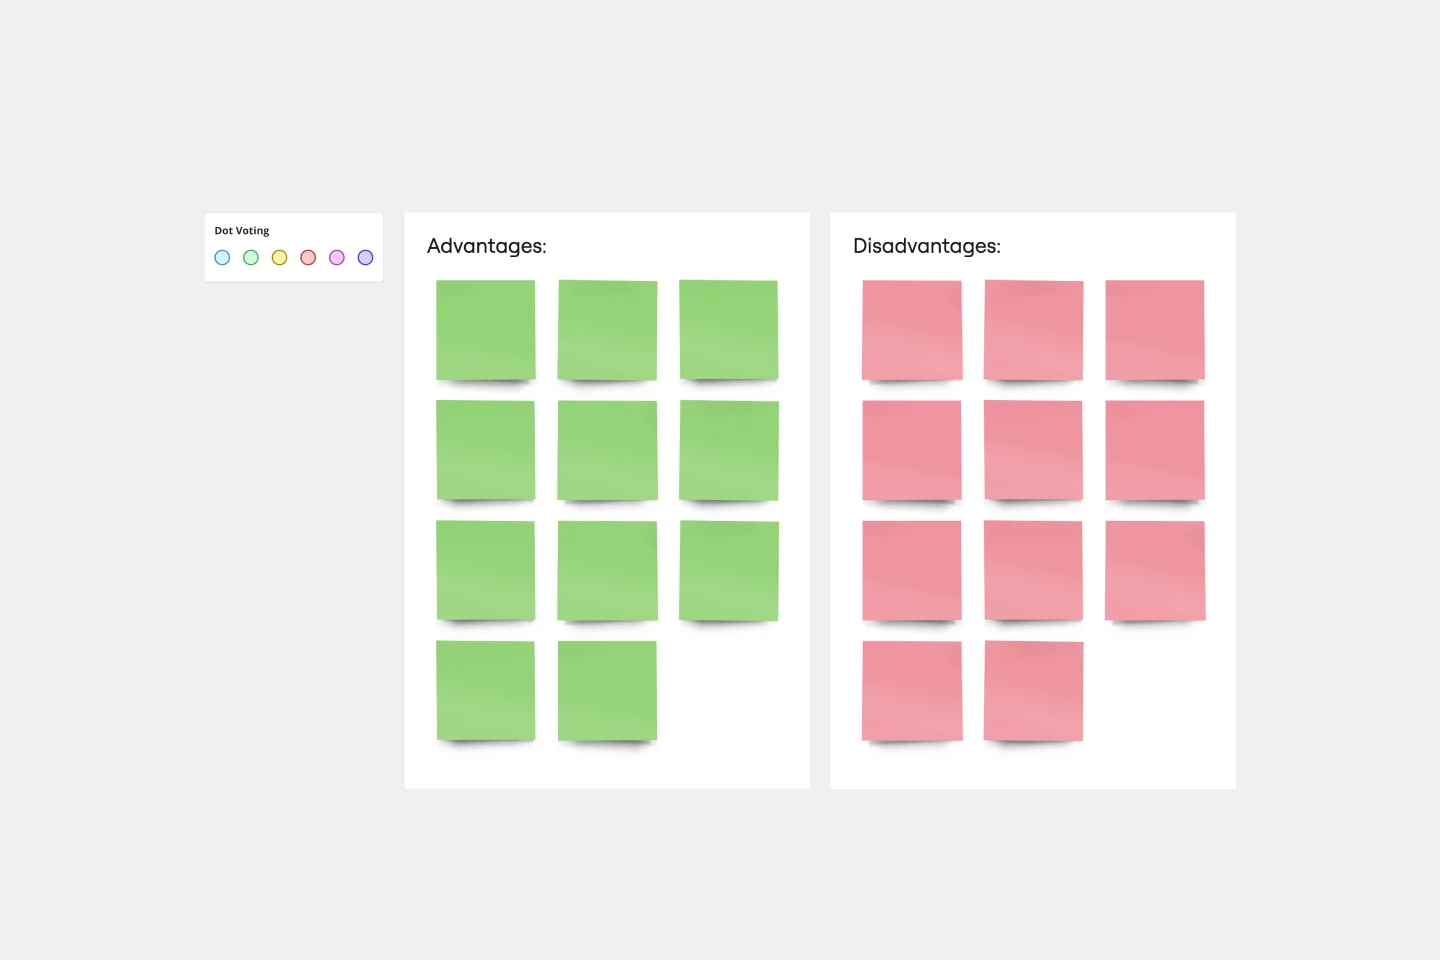
The T Chart for Comparison template is a visual decision-making tool that organizes information into two parallel columns separated by a vertical line, creating a distinctive "T" shape. This template enables side-by-side evaluation of contrasting elements such as advantages versus disadvantages, pros versus cons, or before versus after scenarios. The structured format uses numbered entries with color-coded markers to facilitate easy tracking and reference across both columns, making complex comparisons clear and accessible for individuals and teams.
Potential Uses
Decision-Making and Analysis
Evaluate competing solutions, vendors, or strategic options by weighing strengths against weaknesses. Support feasibility studies for new projects or initiatives by documenting benefits alongside potential risks.
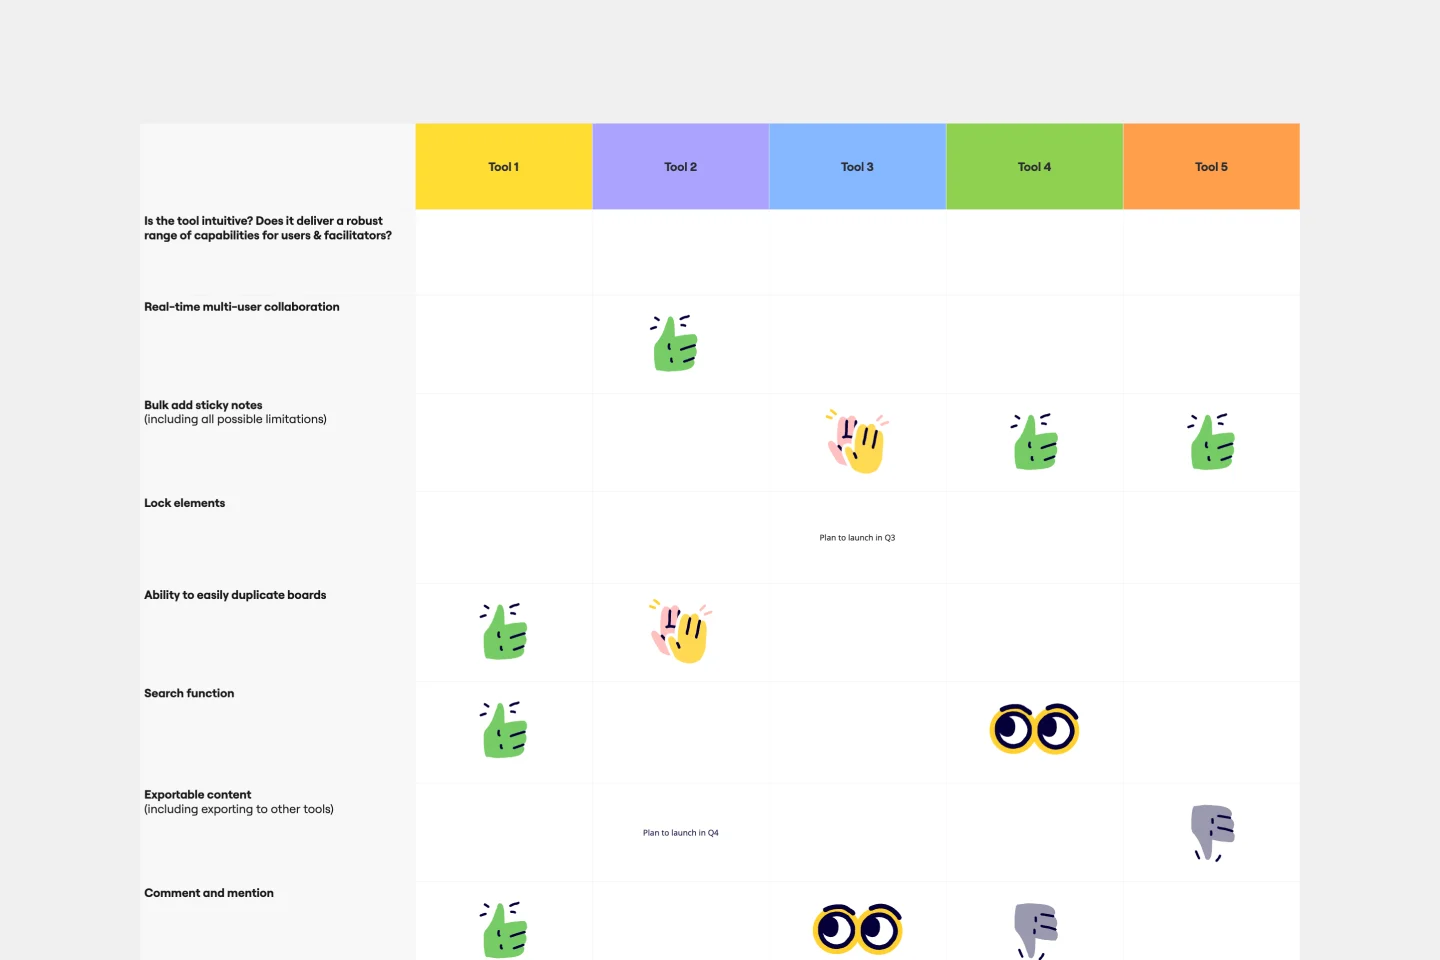
Product and Service Evaluation
Compare product features, service offerings, or technology platforms. Assess trade-offs when considering adoption of new tools or systems within an organization.
Team Collaboration
Facilitate structured discussions during workshops, brainstorming sessions, or planning meetings. Enable balanced viewpoints by ensuring both positive and negative aspects receive equal consideration.
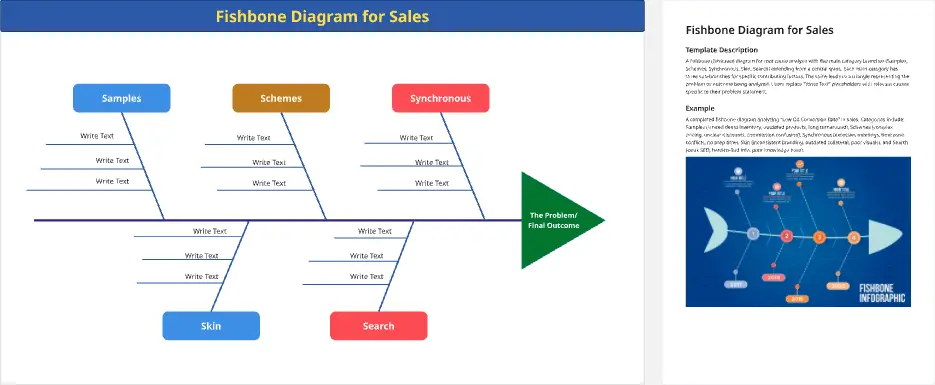
Strategic Planning
Conduct SWOT-style analyses by comparing internal capabilities against external challenges. Document opportunity costs and trade-offs for business decisions requiring stakeholder input.
Debate and Presentation
Structure arguments for formal debates or presentations where multiple perspectives need clear articulation. Create visual aids that help audiences understand both sides of complex issues.
Cheers!
Khawaja Rizwan