Results for
ERD diagram
411 templates
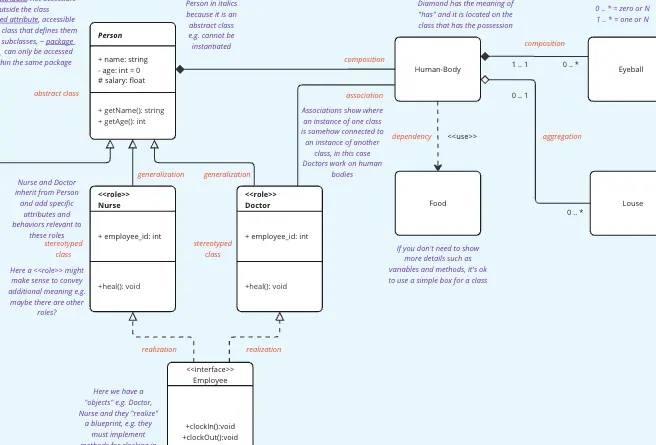
UML ERD Diagram
17 likes129 uses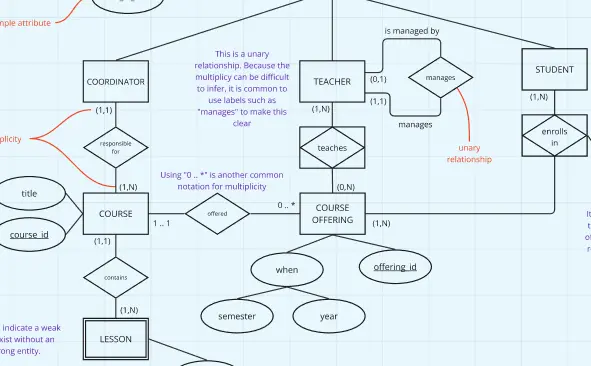
Diagramme ERD UML
6 likes12 uses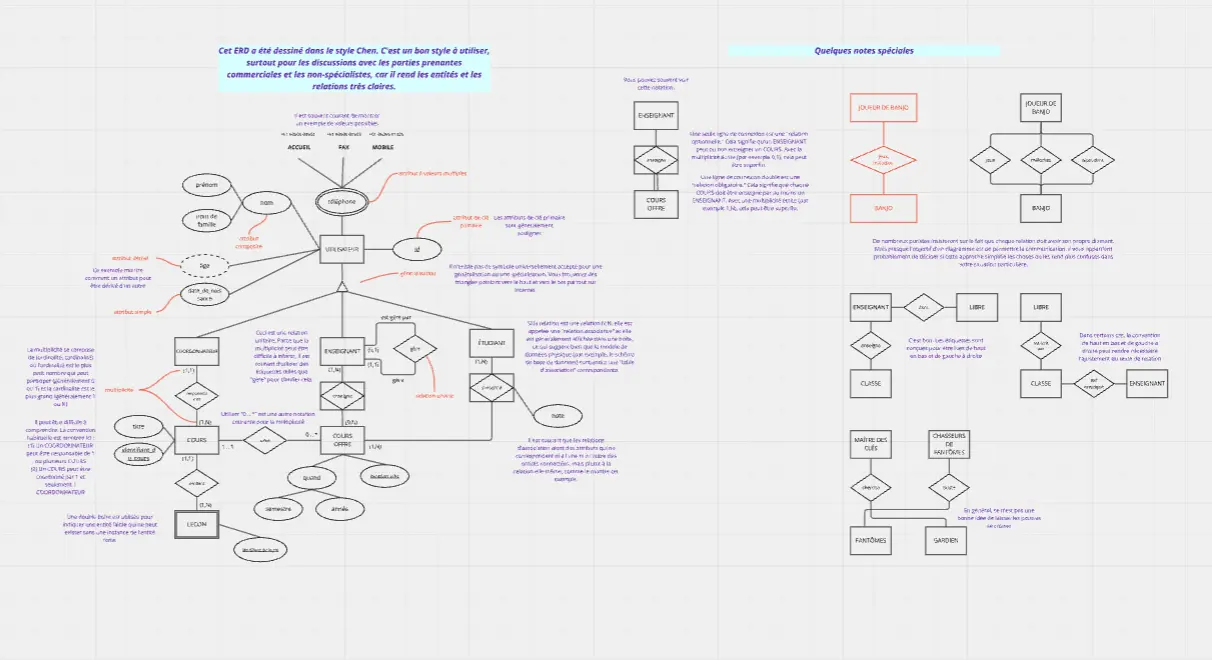
UML-ERD-Diagramm
3 likes18 uses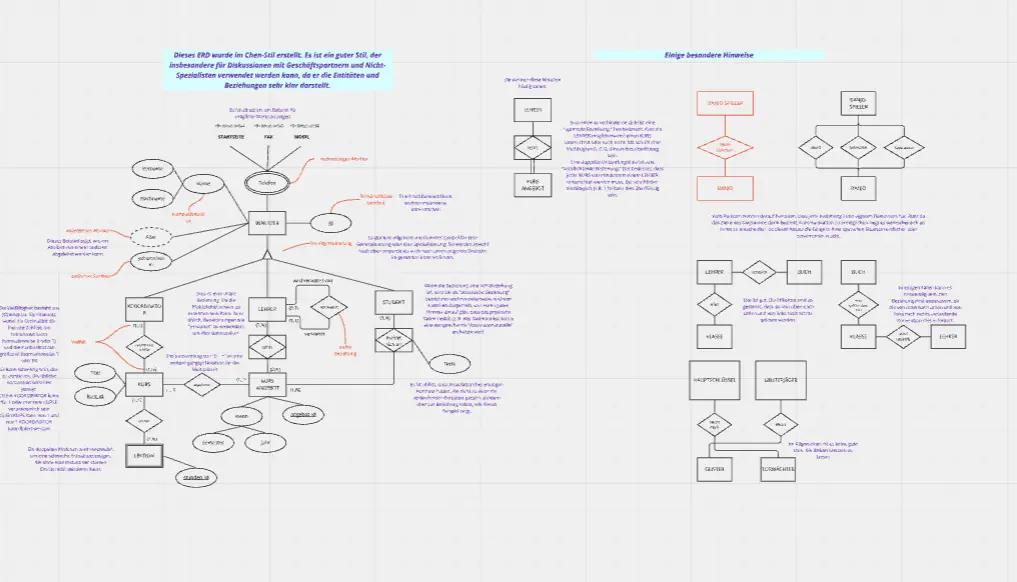
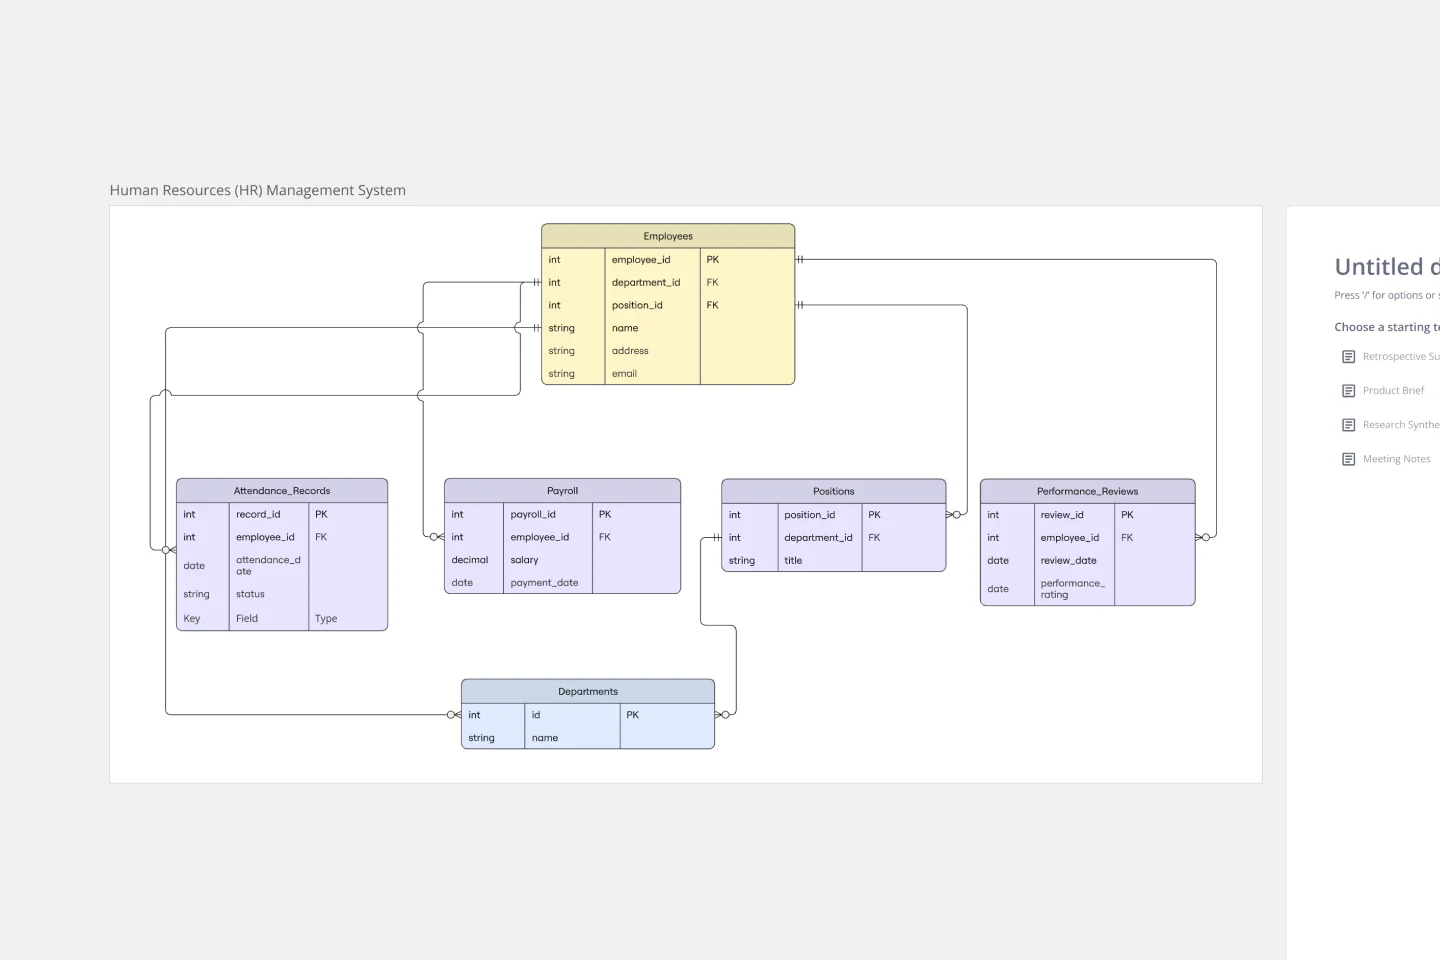
Entity Relationship Diagram Template
20 likes1.7K uses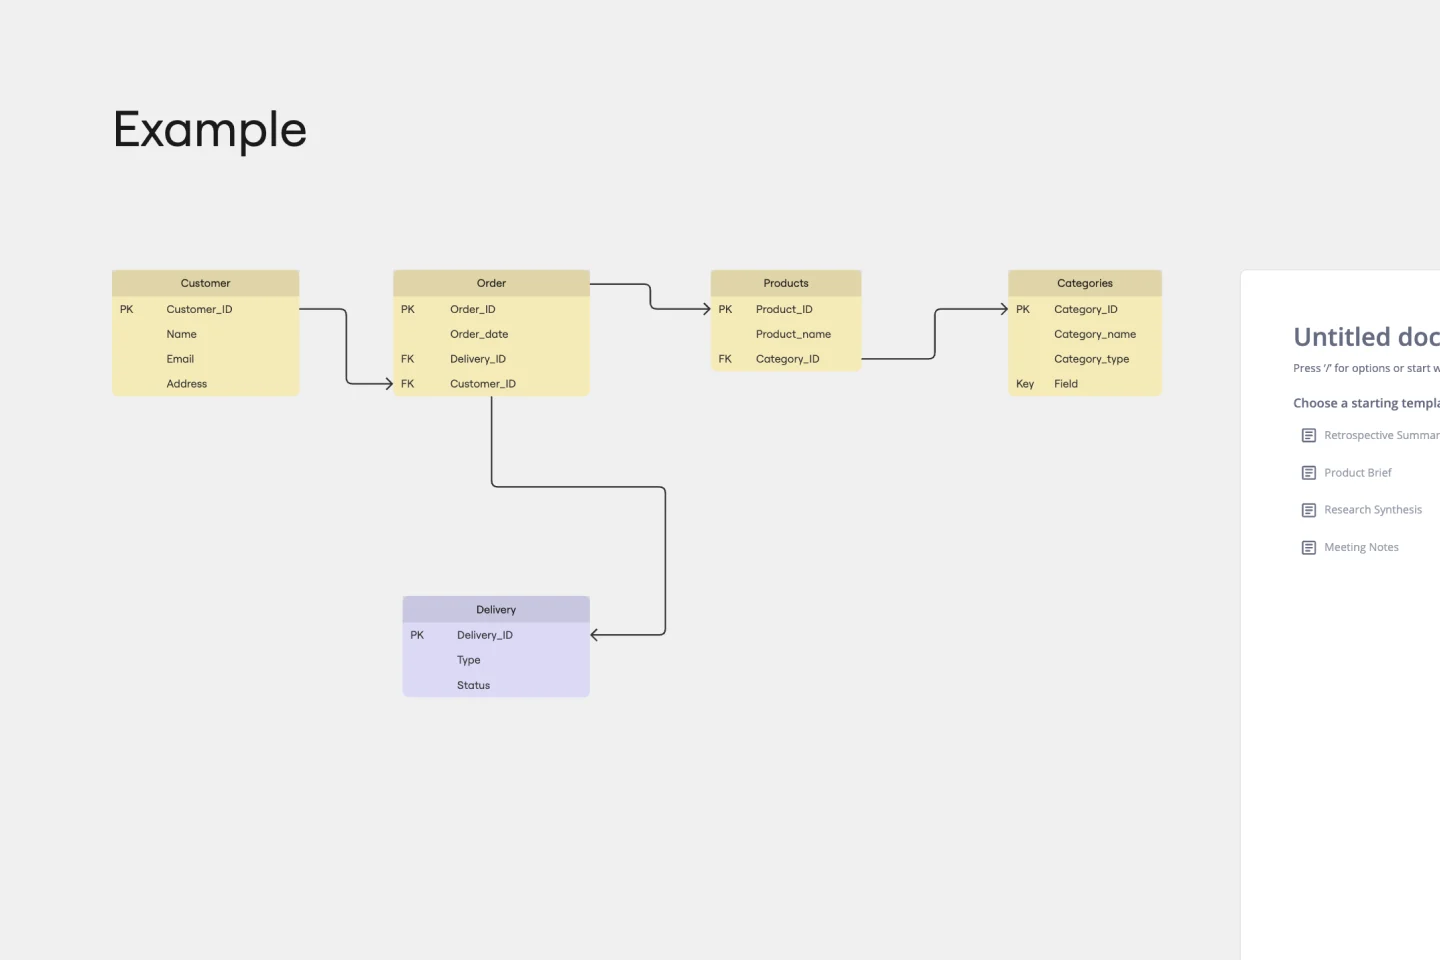
ERD Blogging System Template
0 likes39 uses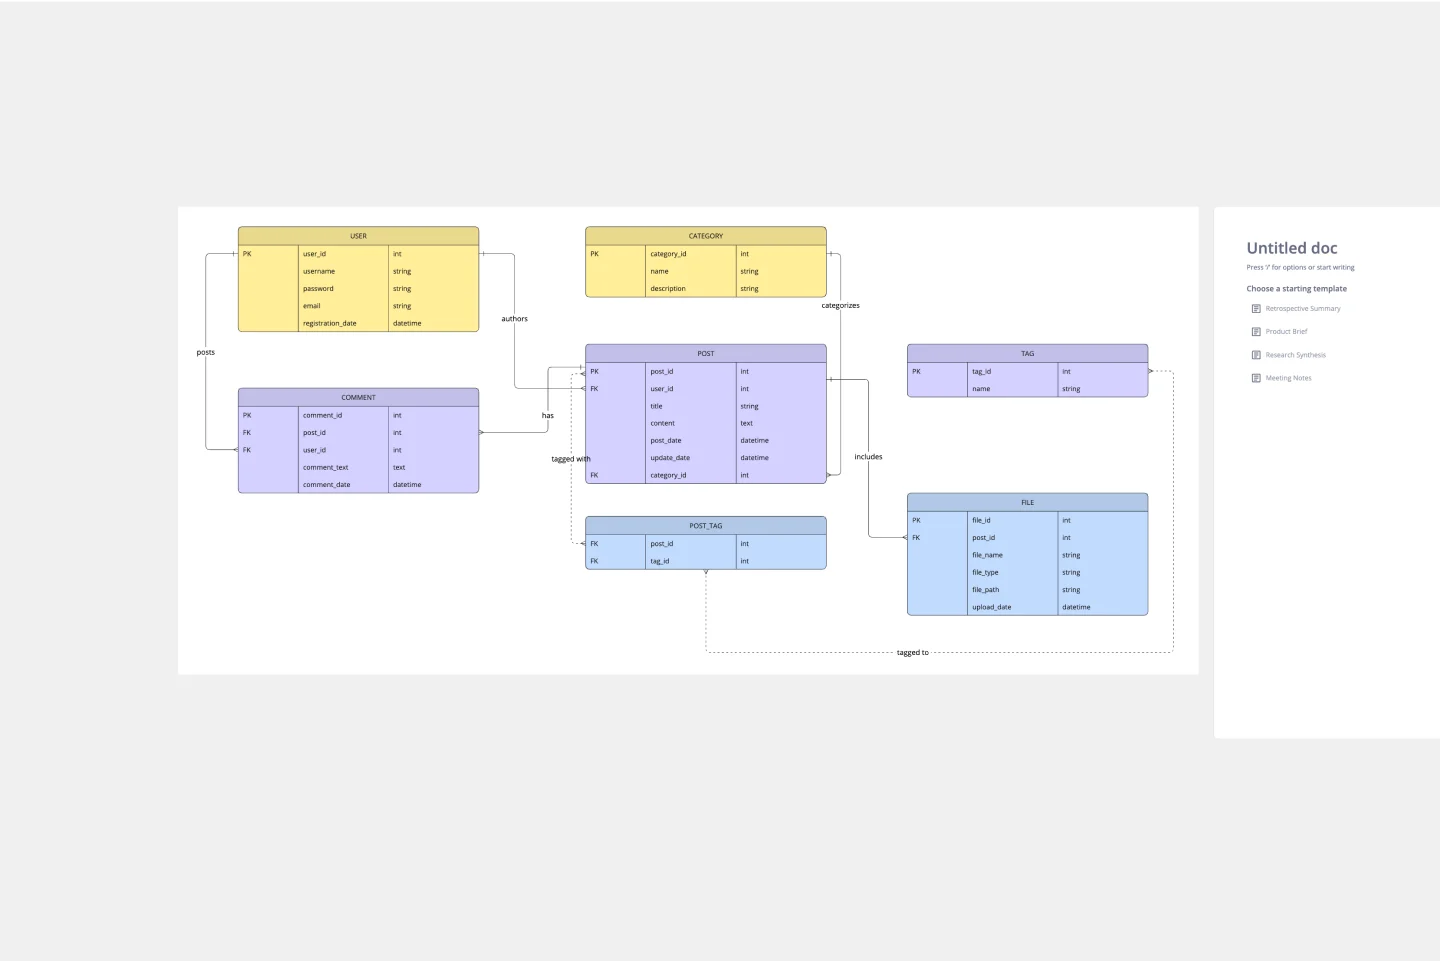
ER (Entity-Relationship) Diagram
23 likes320 uses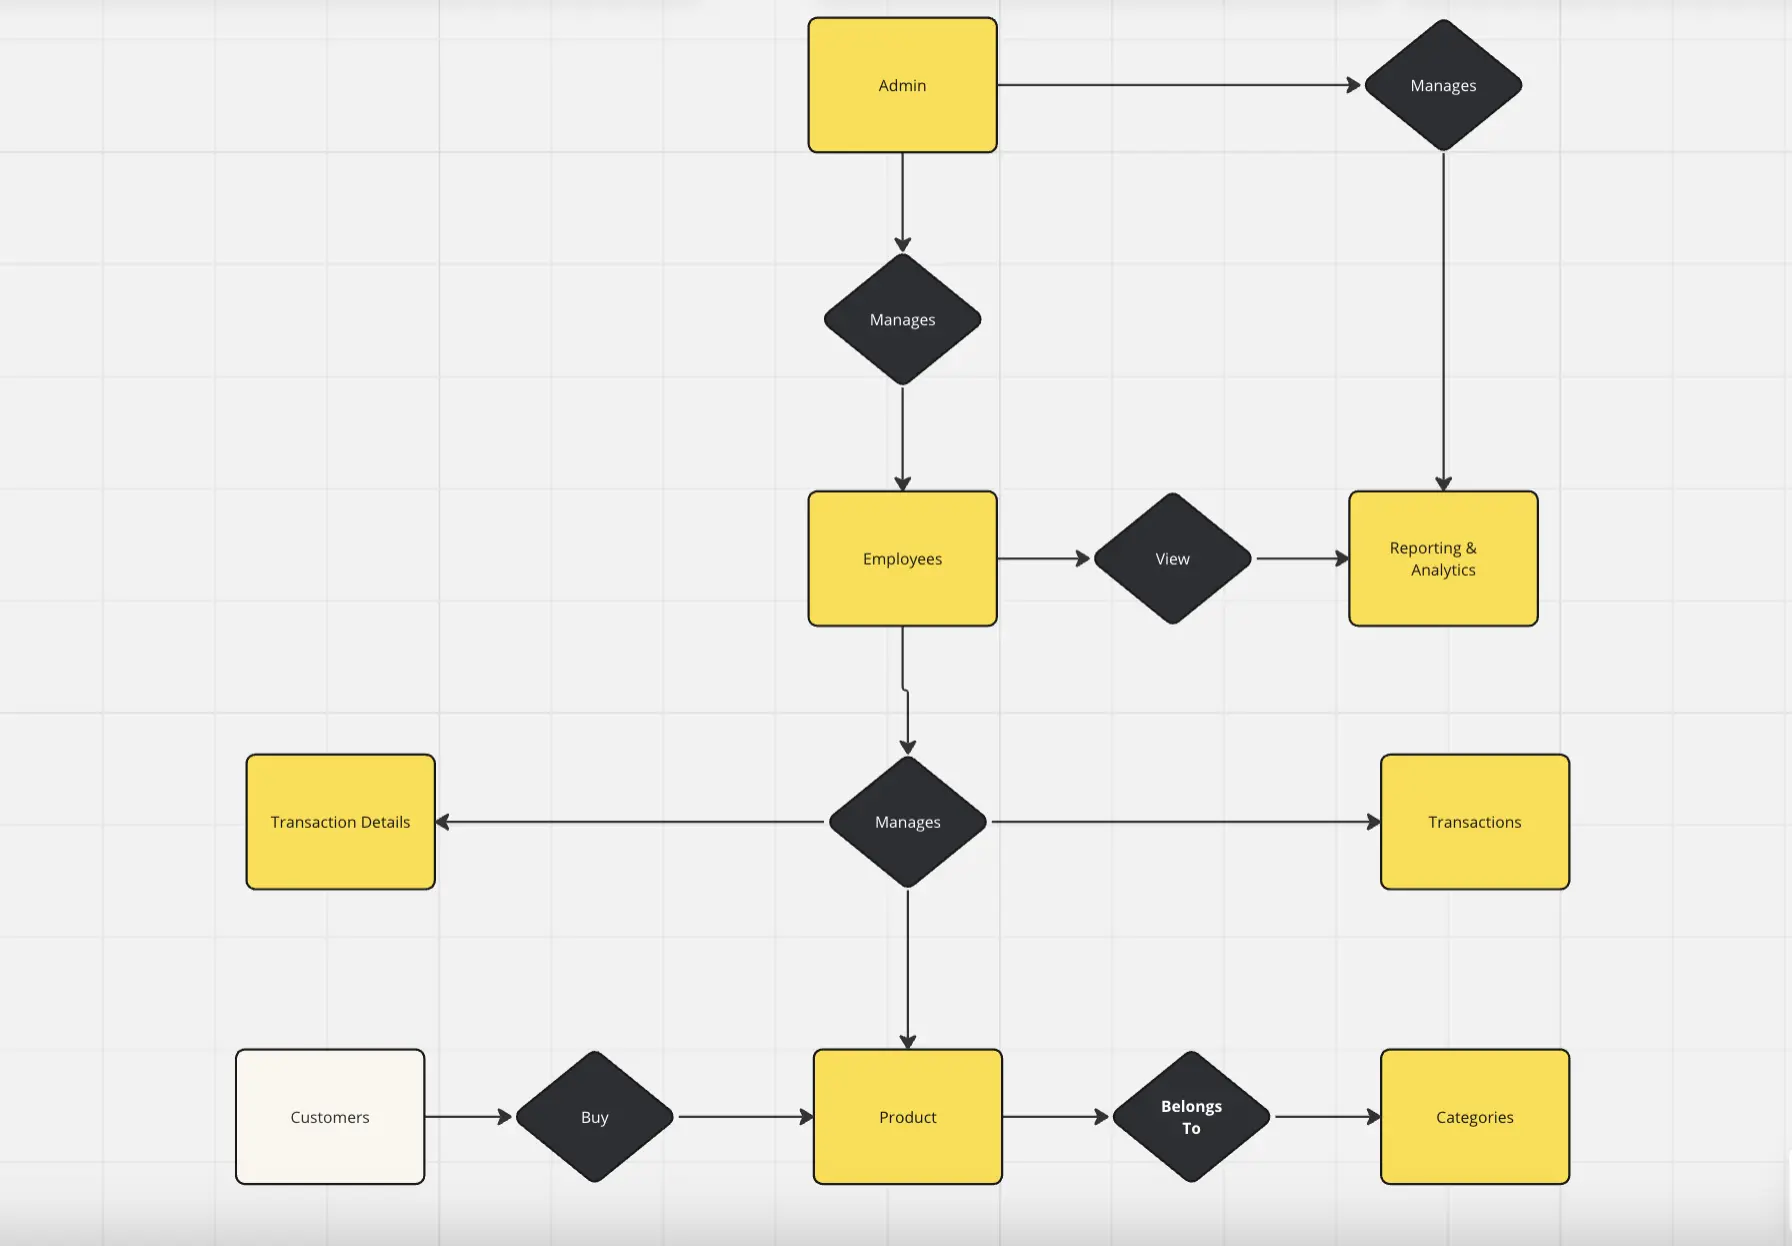
ERD Healthcare Management System Template
1 likes70 uses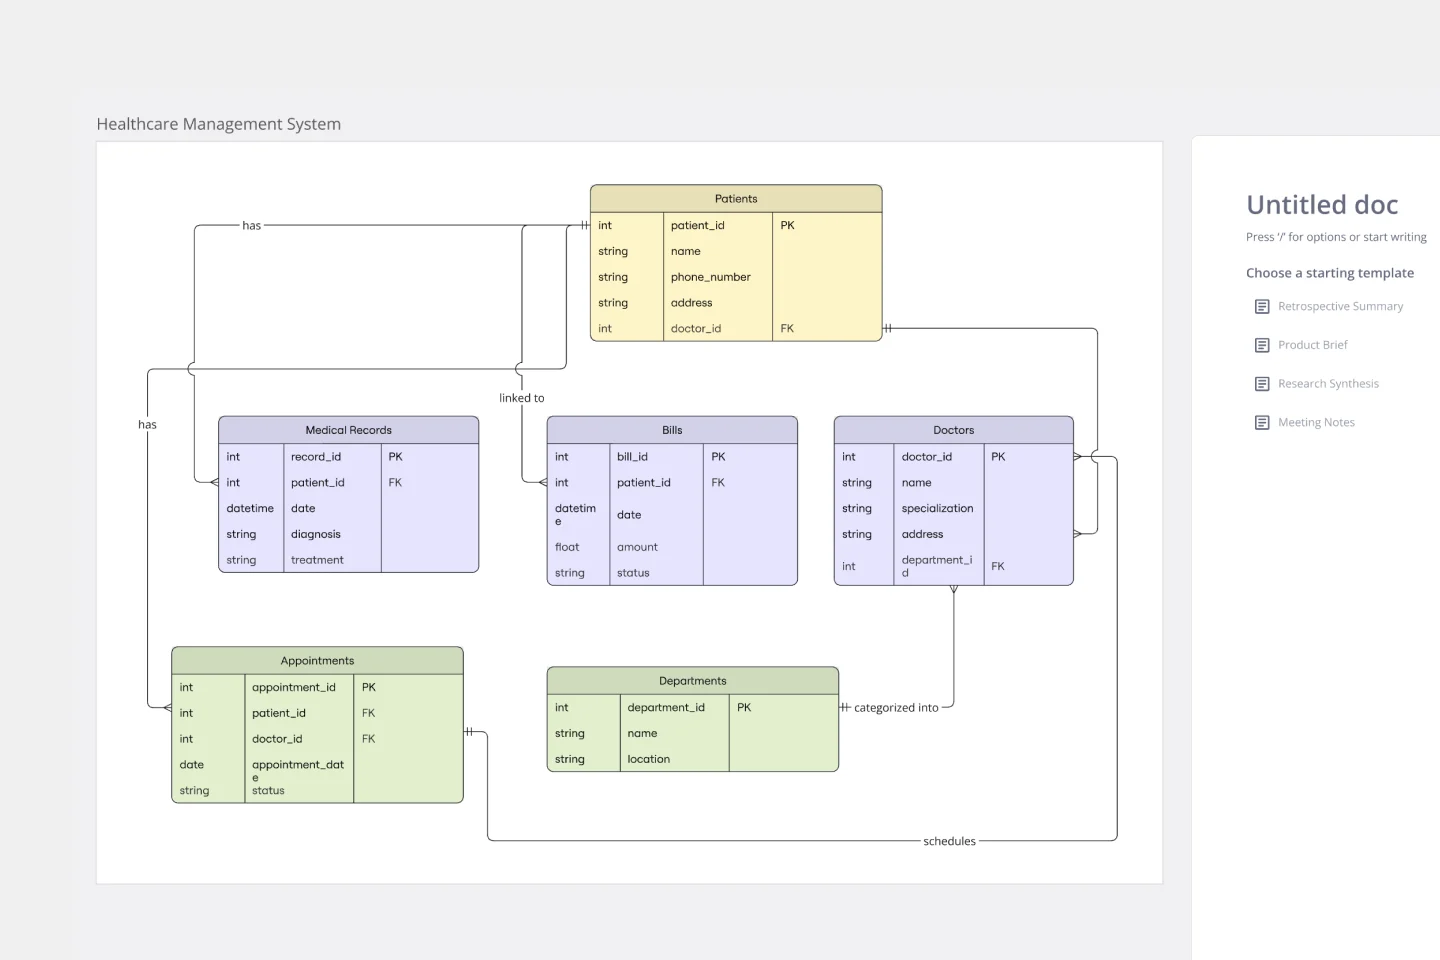
ERD Educational Learning Management System Template
1 likes34 uses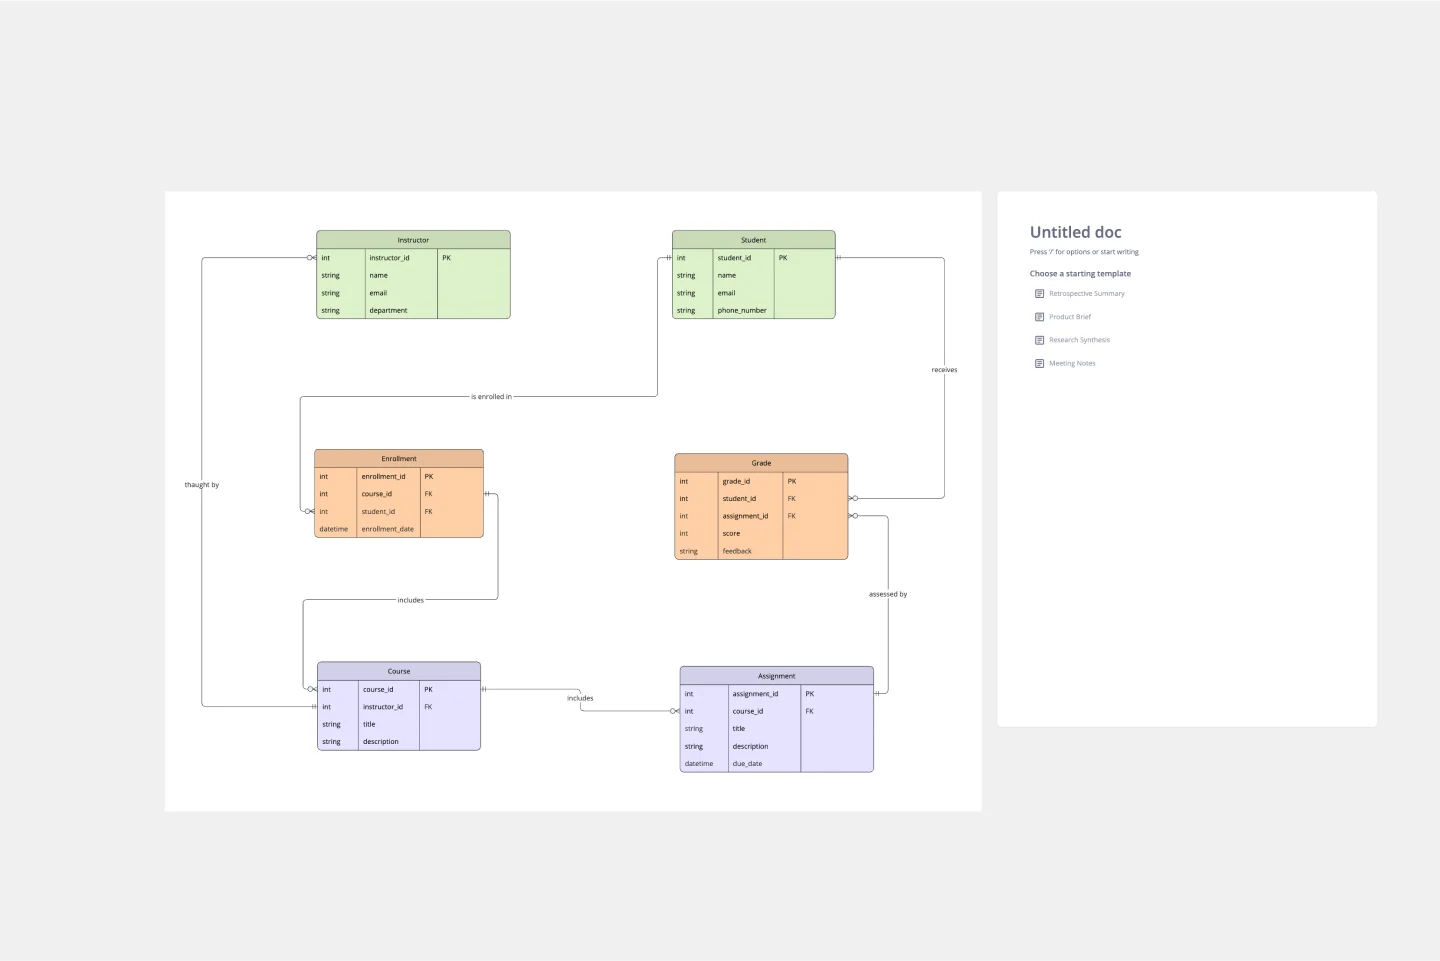
Diagrama UML Entidad-Relación
3 likes15 uses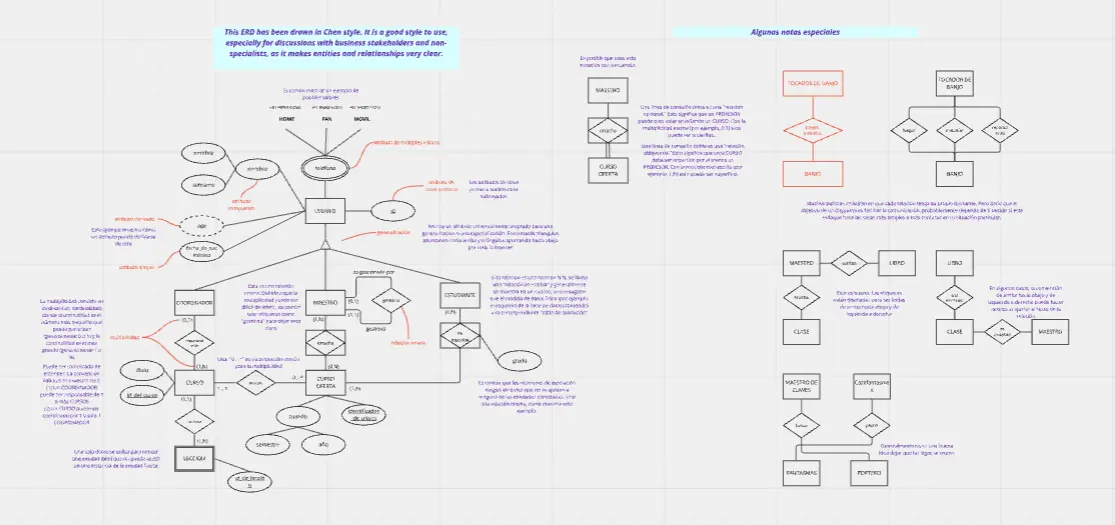
AI Entity Relationship Diagram Template
6 likes115 usesOrder Management ERD
1 likes24 uses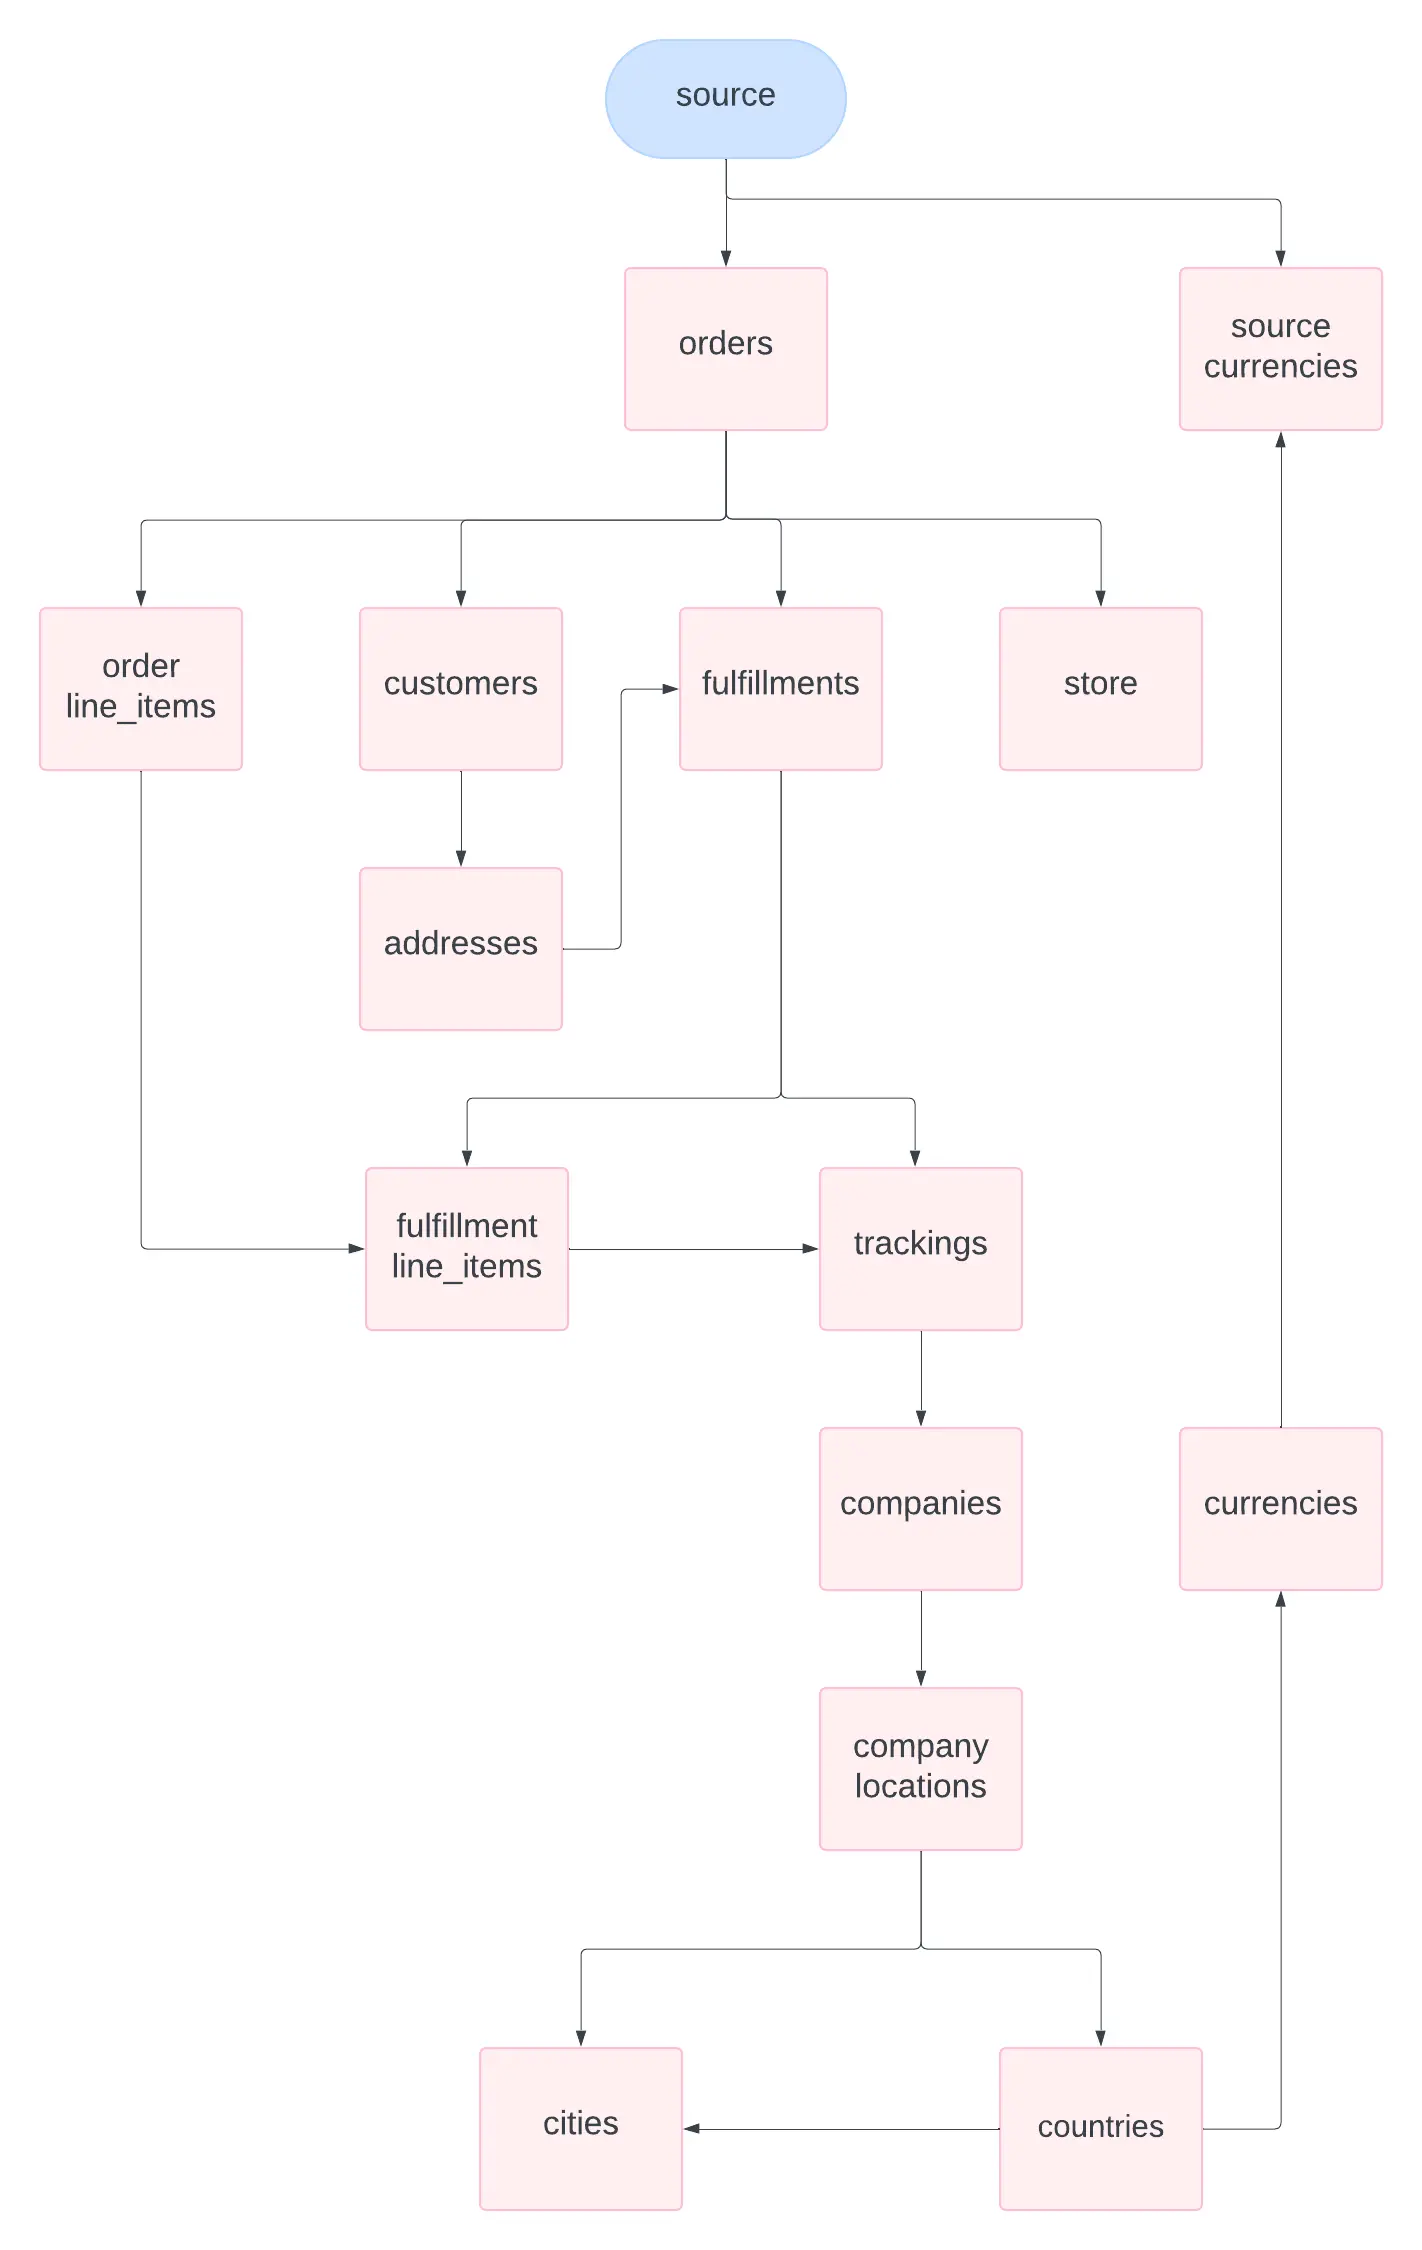
Database Architect
1 likes4 uses
Instantly drafts a precise, standards-compliant Entity-Relationship Diagram from your raw business requirements and user stories.
ERD Supply Chain Management System Template
0 likes17 uses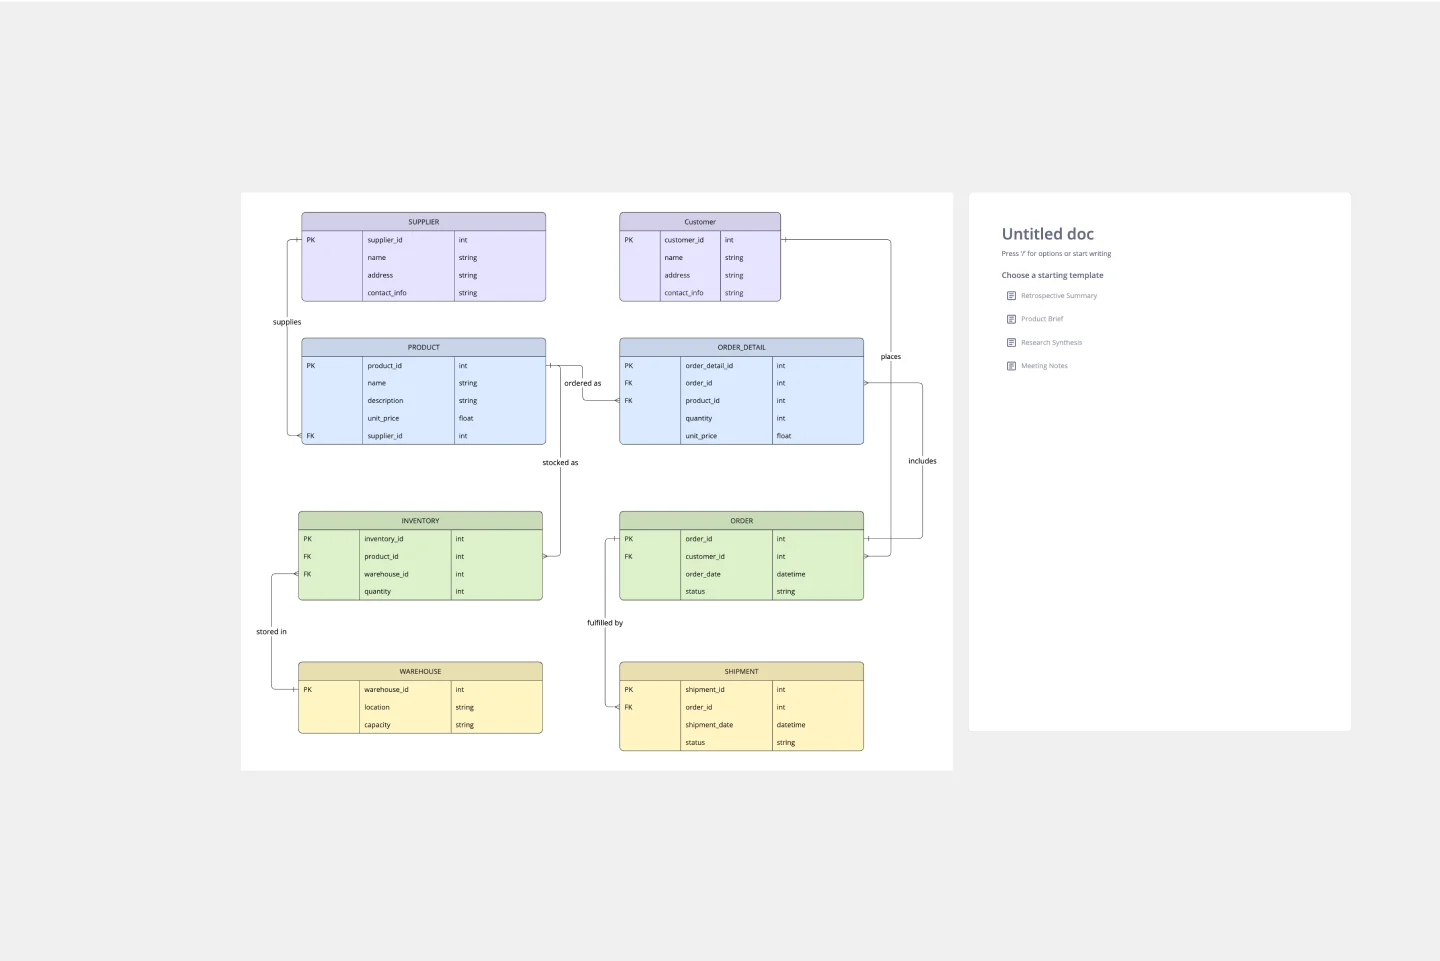
ERD Customer Relationship Management (CRM) Template
2 likes38 uses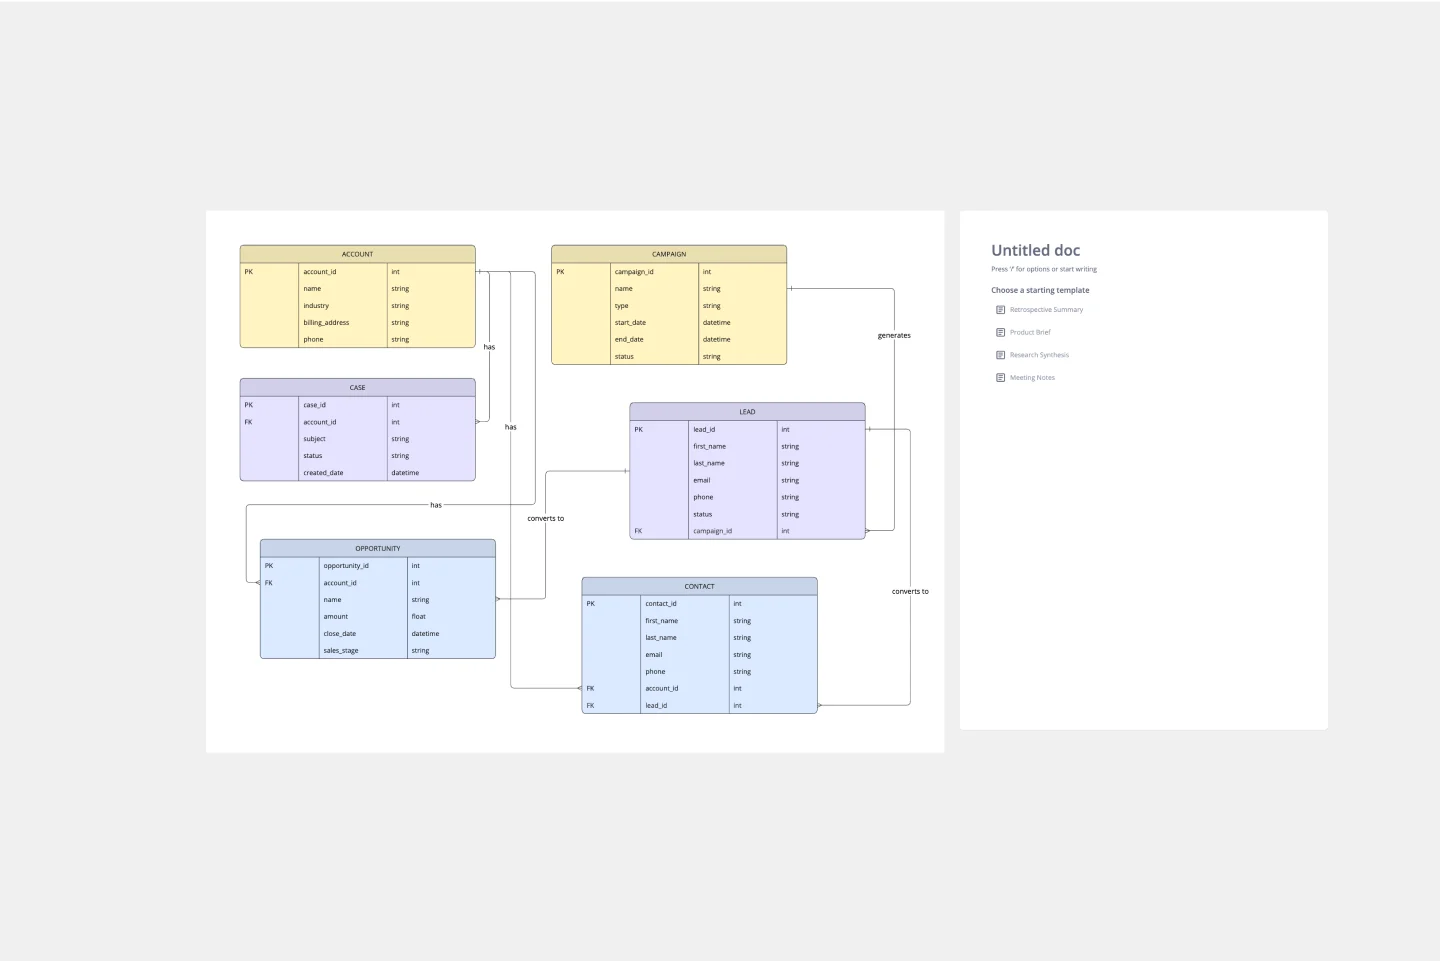
Salesforce Service Cloud Data Model
30 likes359 uses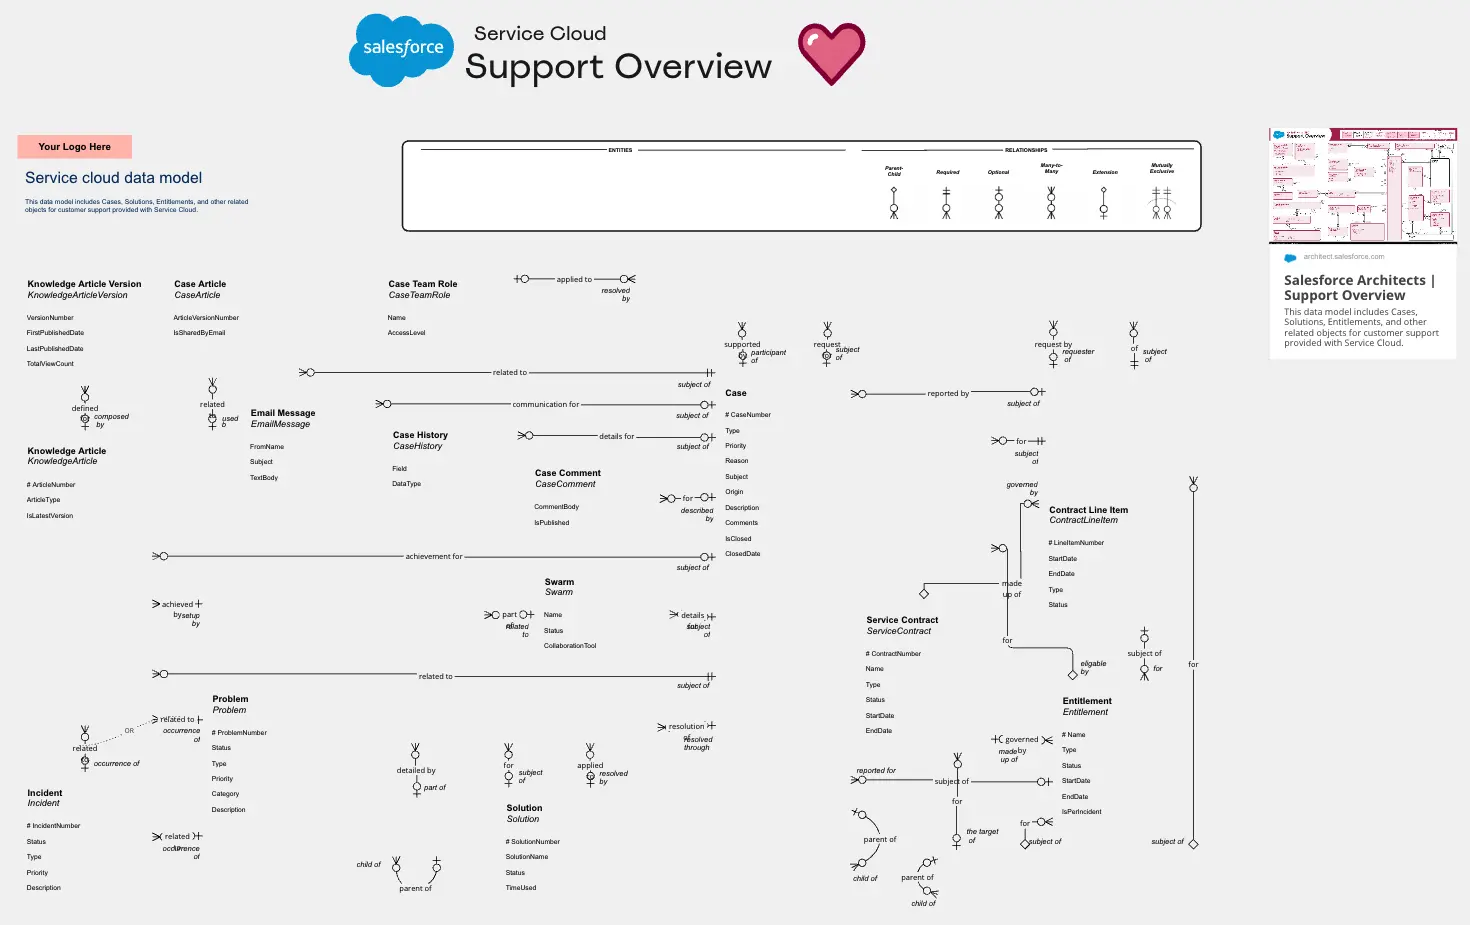
Precedence Diagram
1 likes126 uses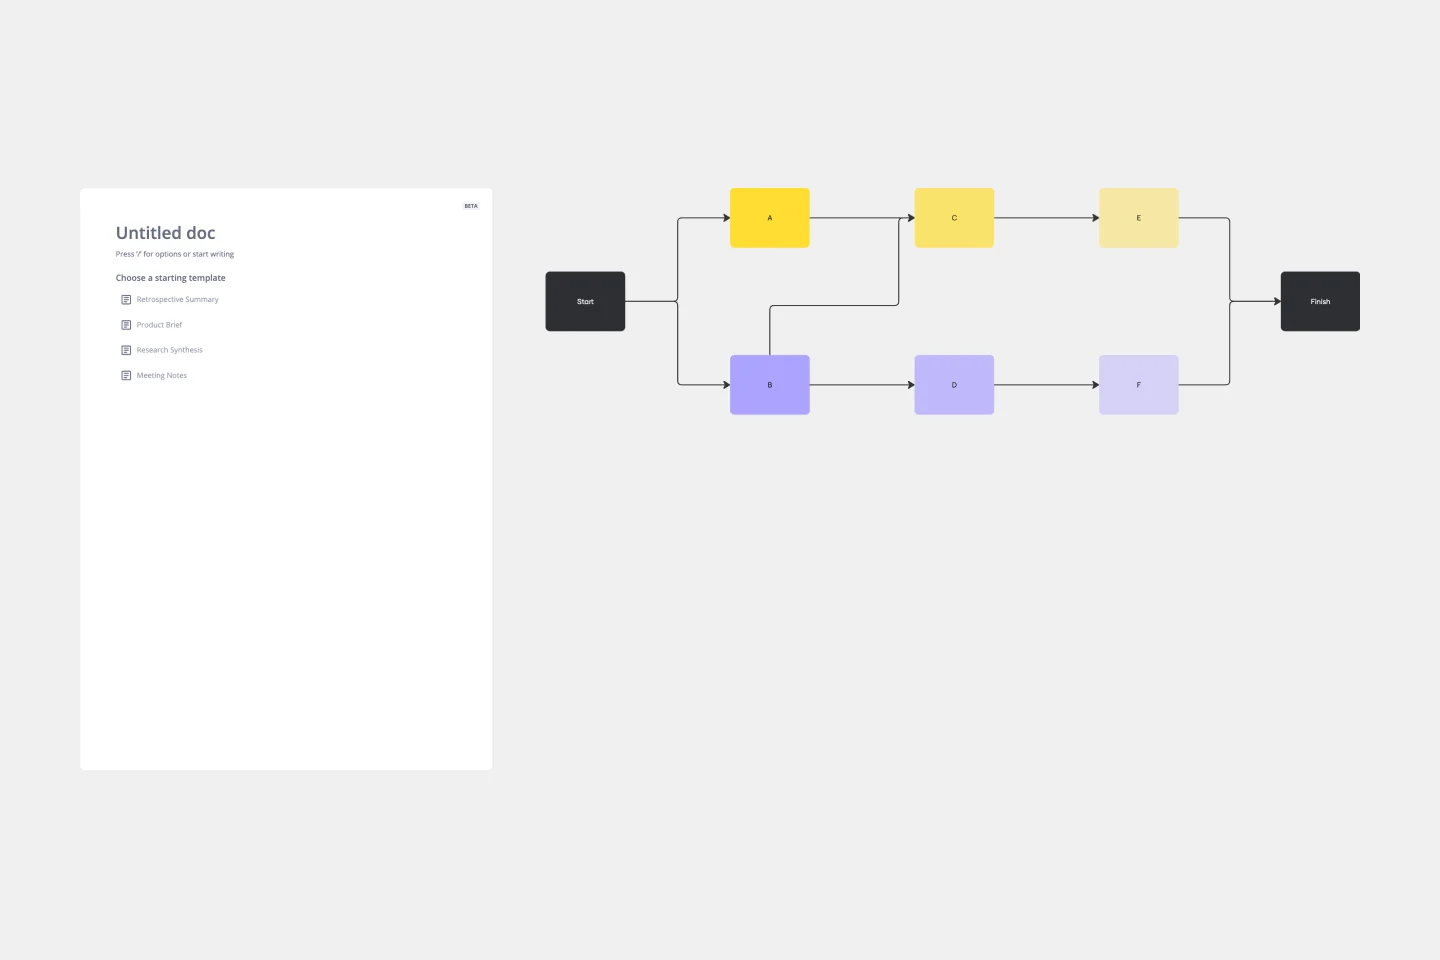
Diagrama de Ishikawa
7 likes186 uses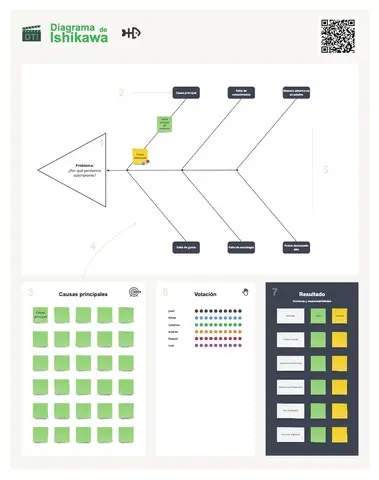
Venn Diagrams
24 likes265 uses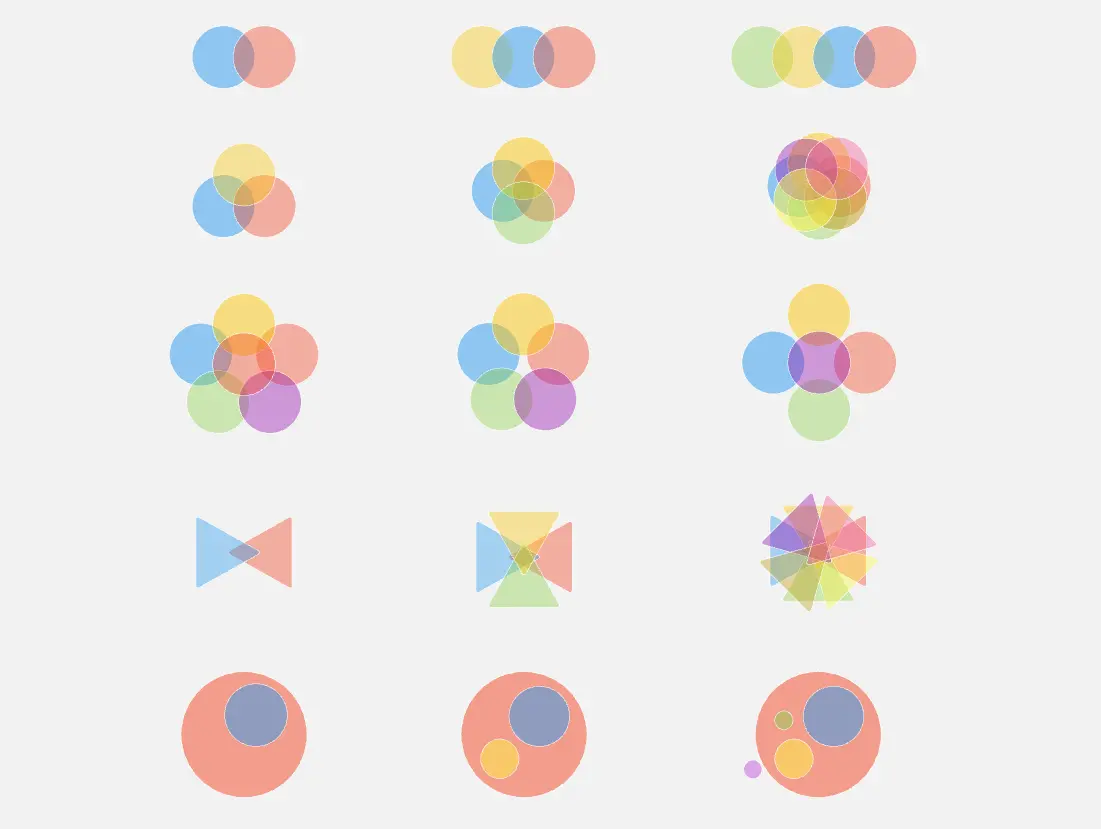
Fishbone Diagram
14 likes152 uses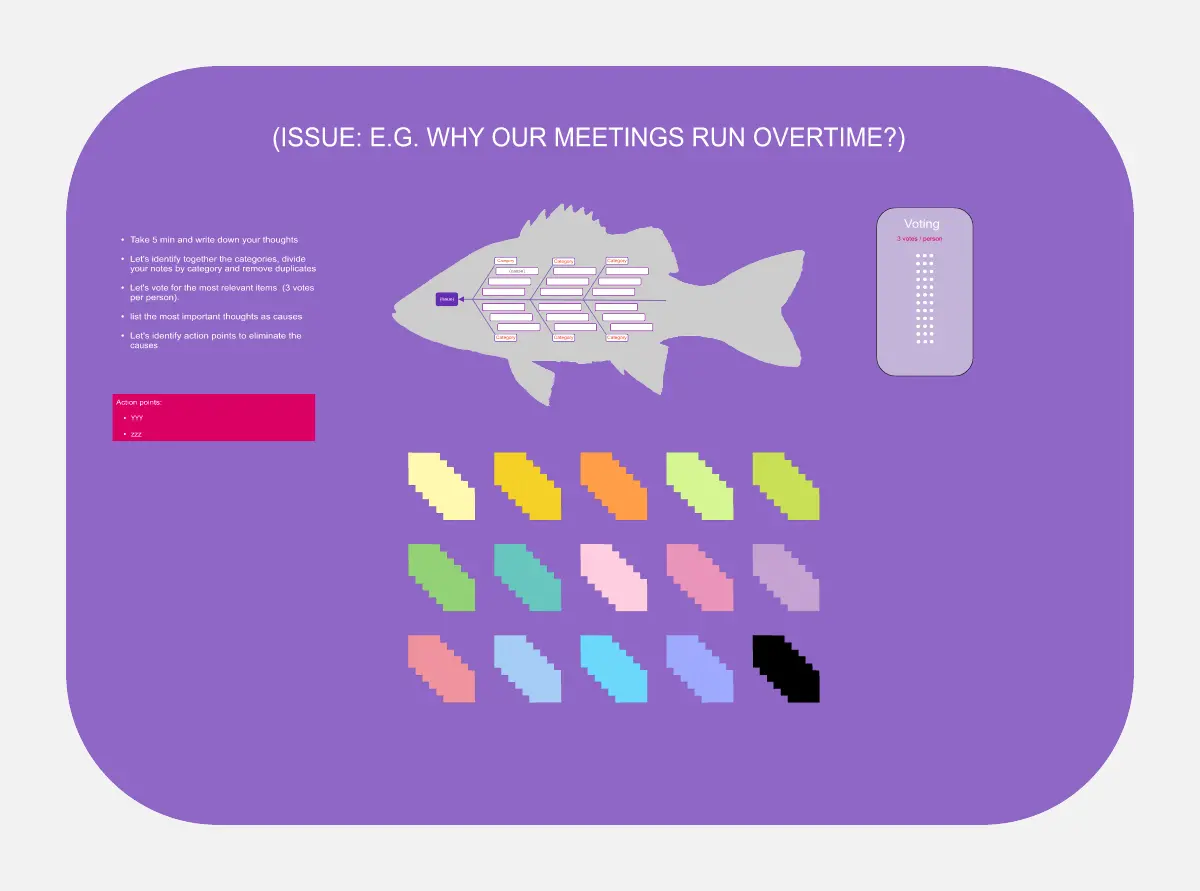
Software Architecture
12 likes172 uses
Create diagrams and docs for good software design.
Fishbone Diagram
12 likes422 uses
Context Diagram Template
2 likes448 uses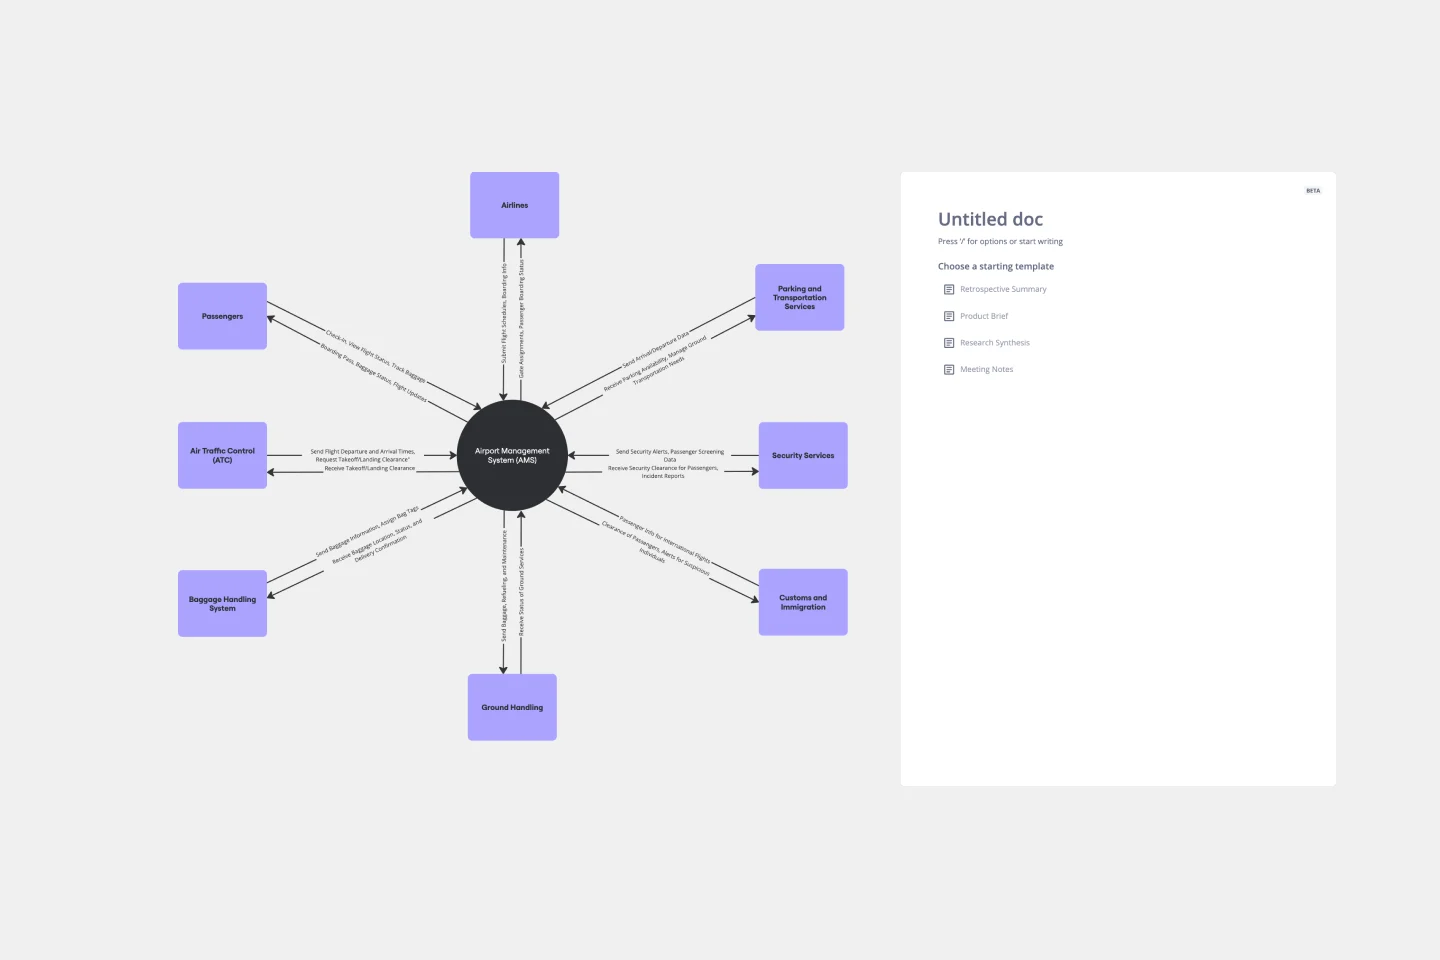
Onion Diagram Template
2 likes454 uses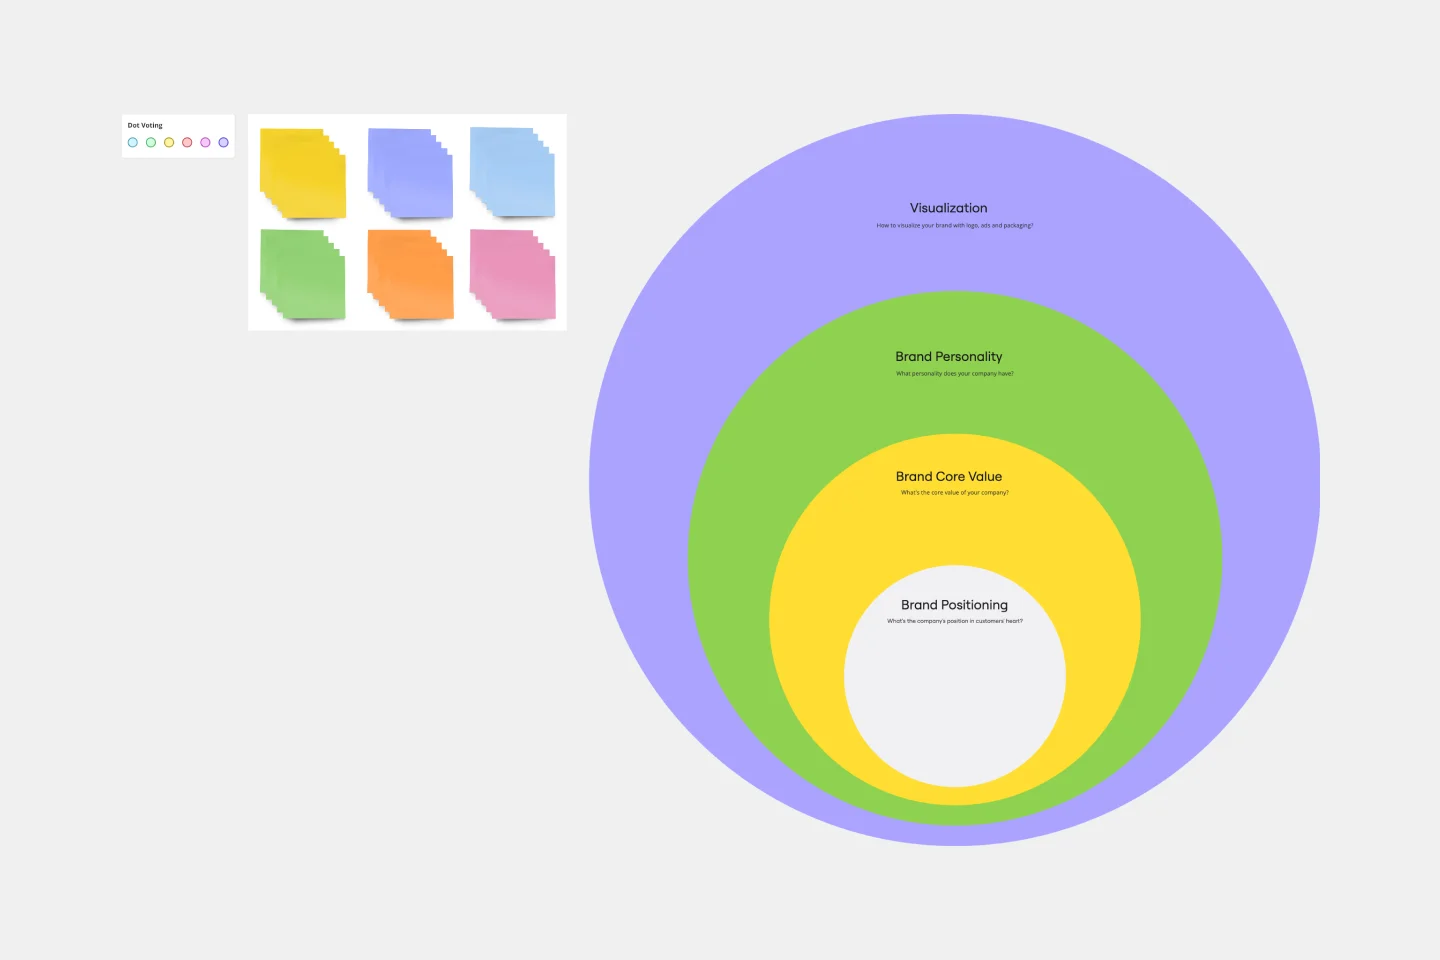
Lotus Diagram Template
2 likes303 uses
Cycle Diagram Template
1 likes116 uses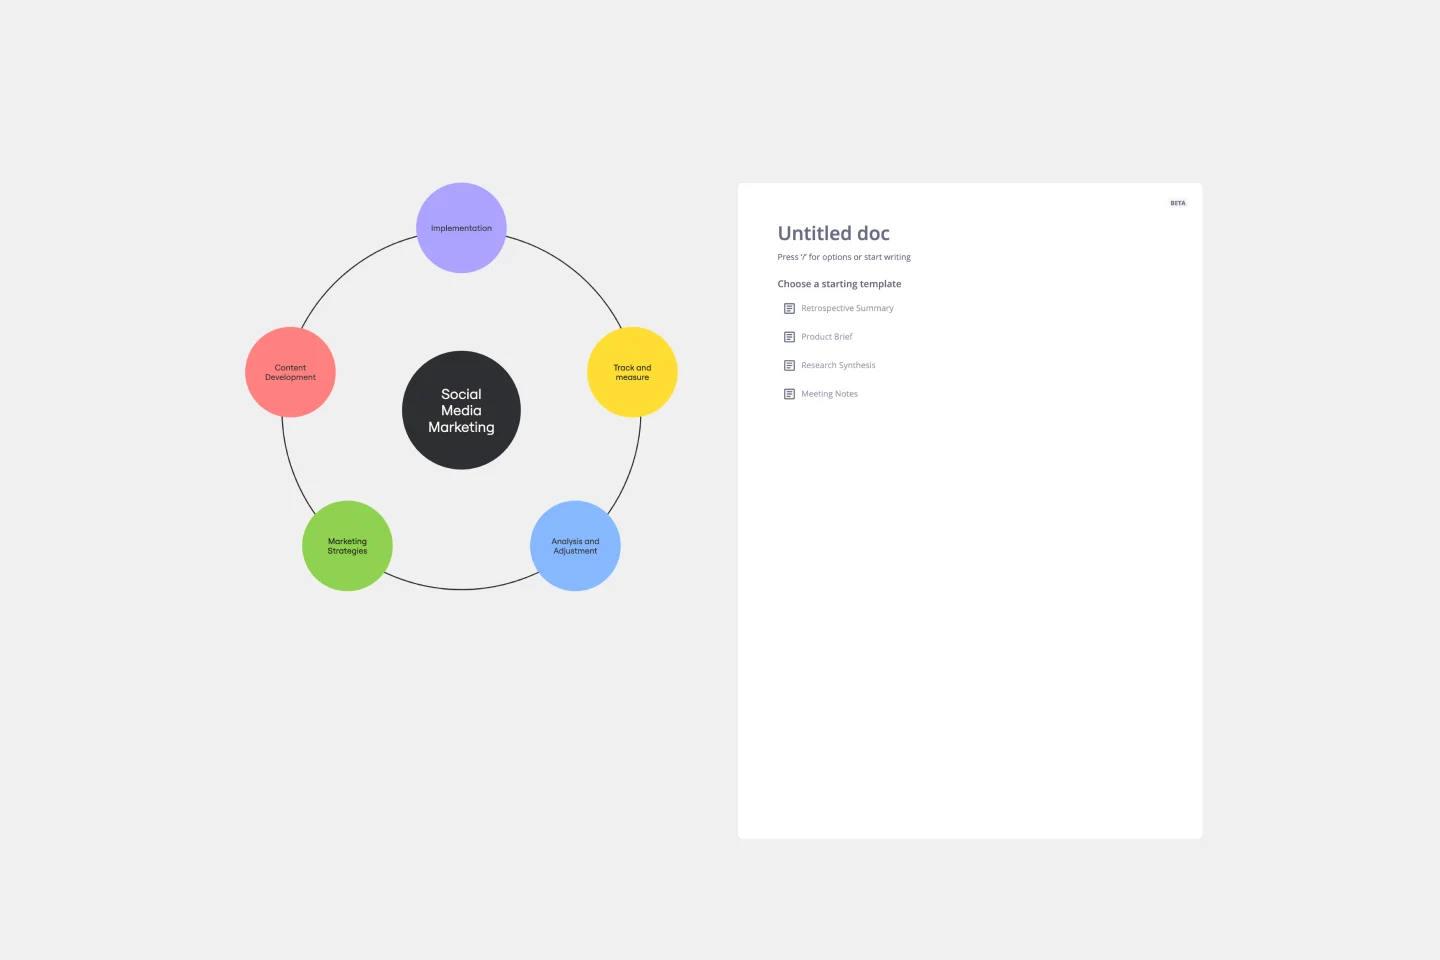
Euler Diagram Template
0 likes53 uses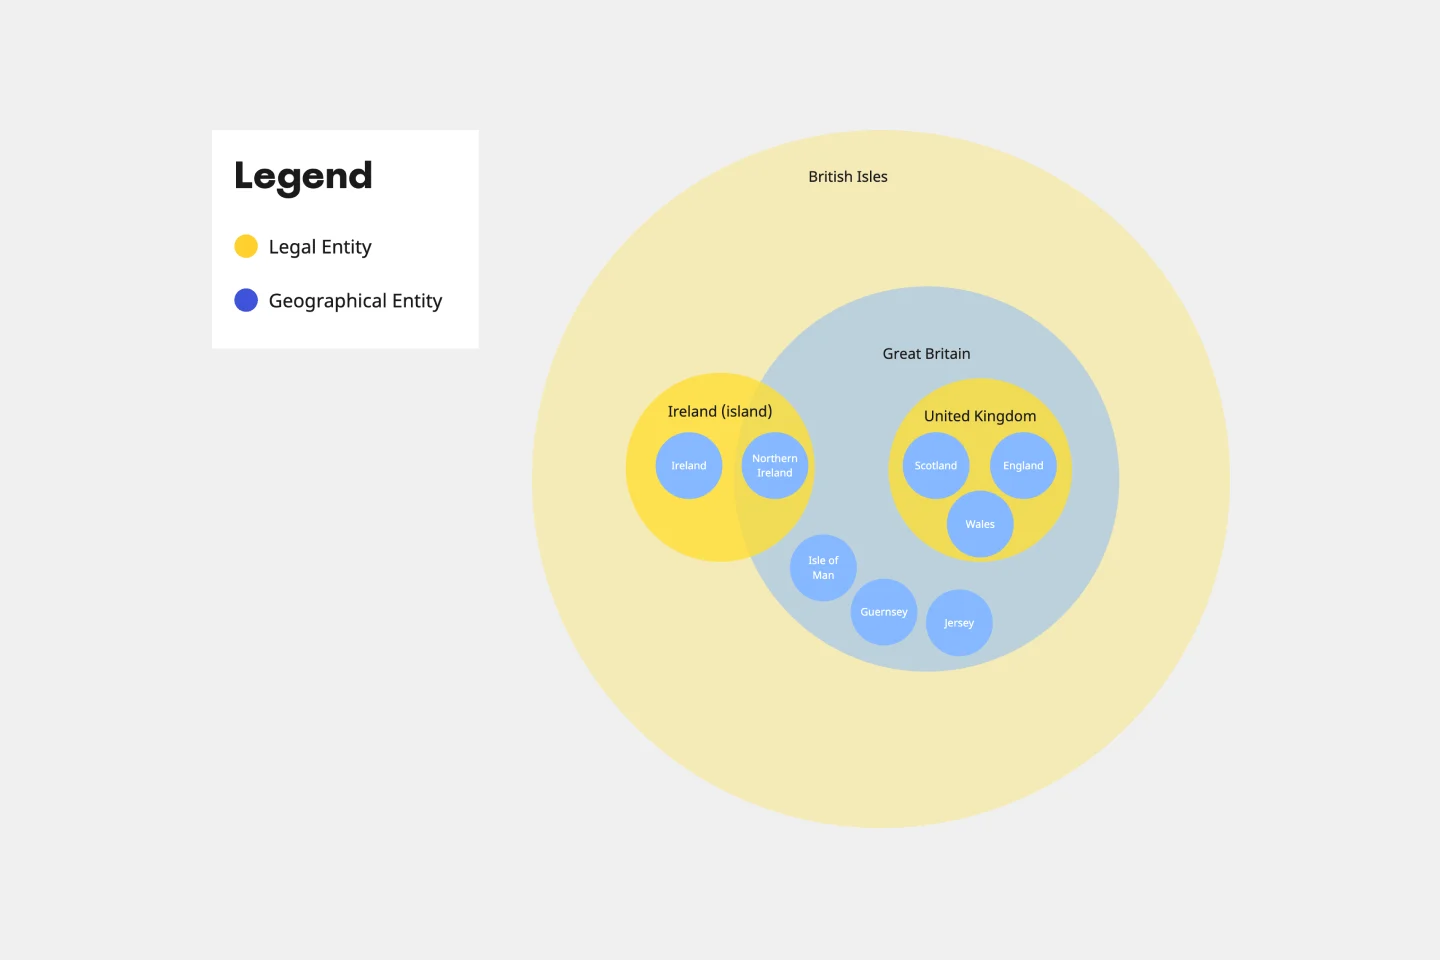
Basic Venn Diagram
20 likes147 uses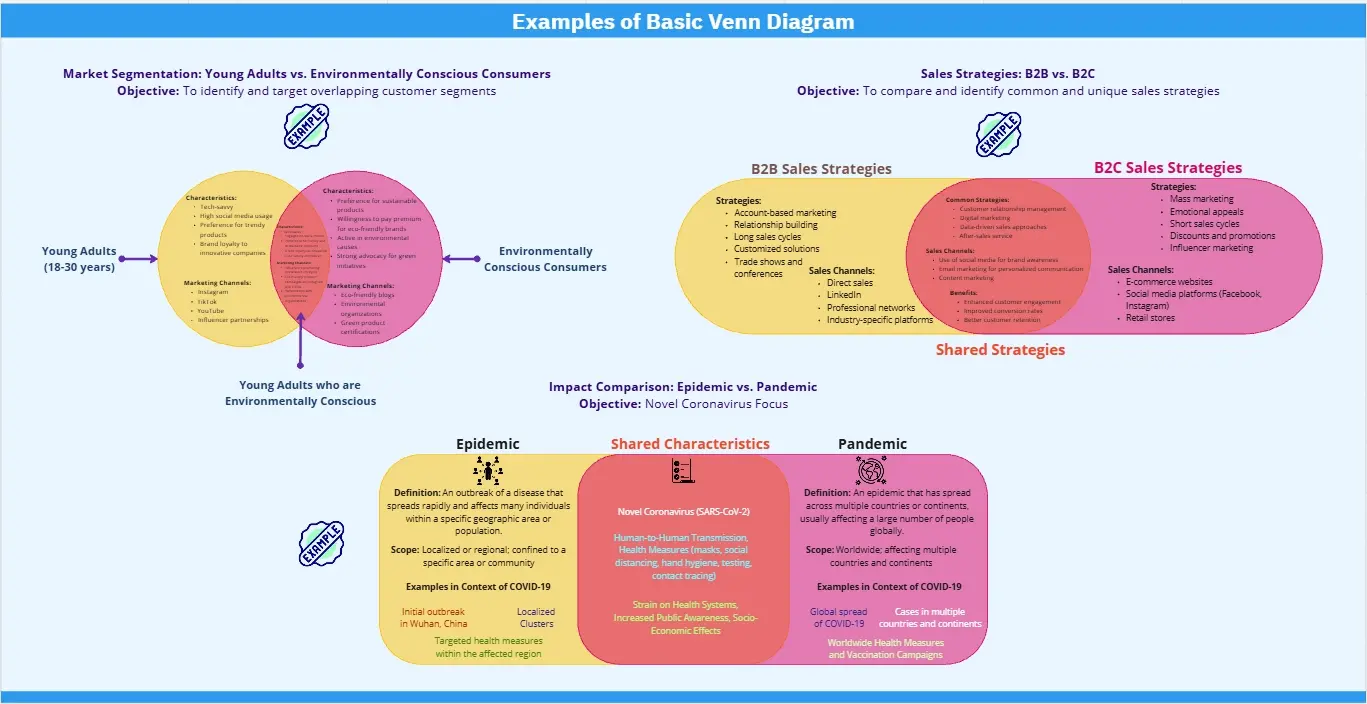
Fishbone Diagram
33 likes2.8K uses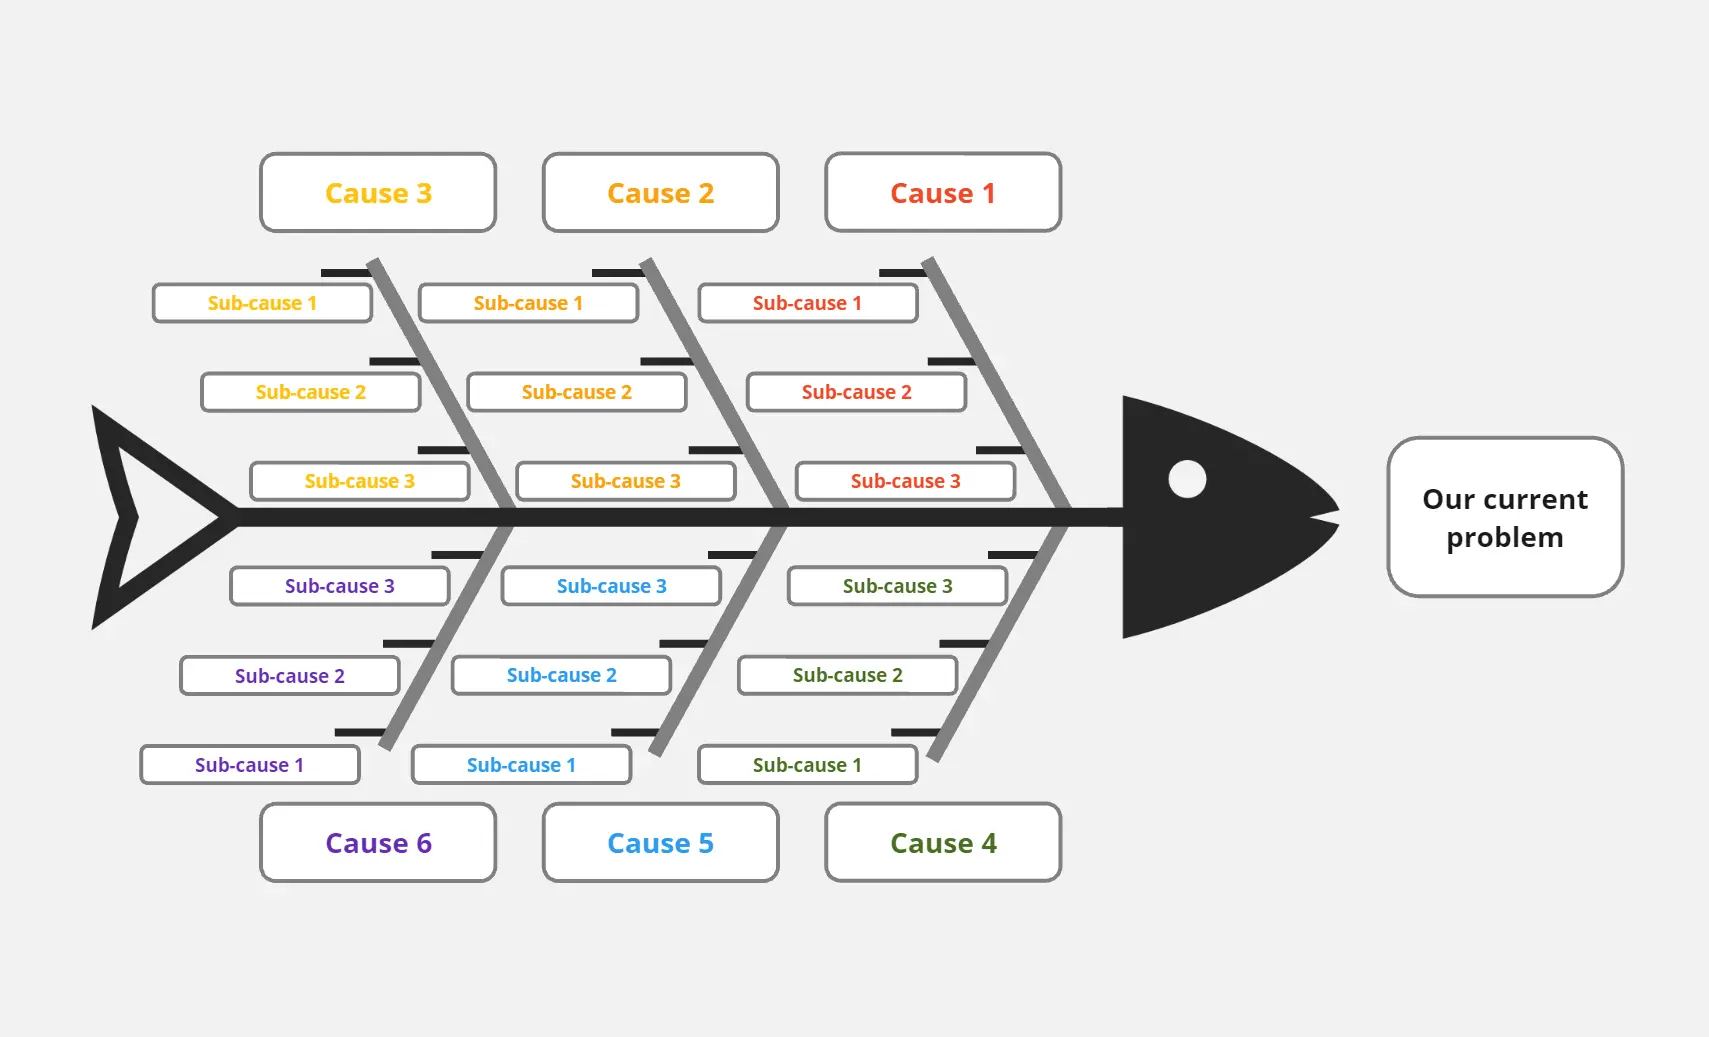
Affinity Diagram Template
7 likes455 uses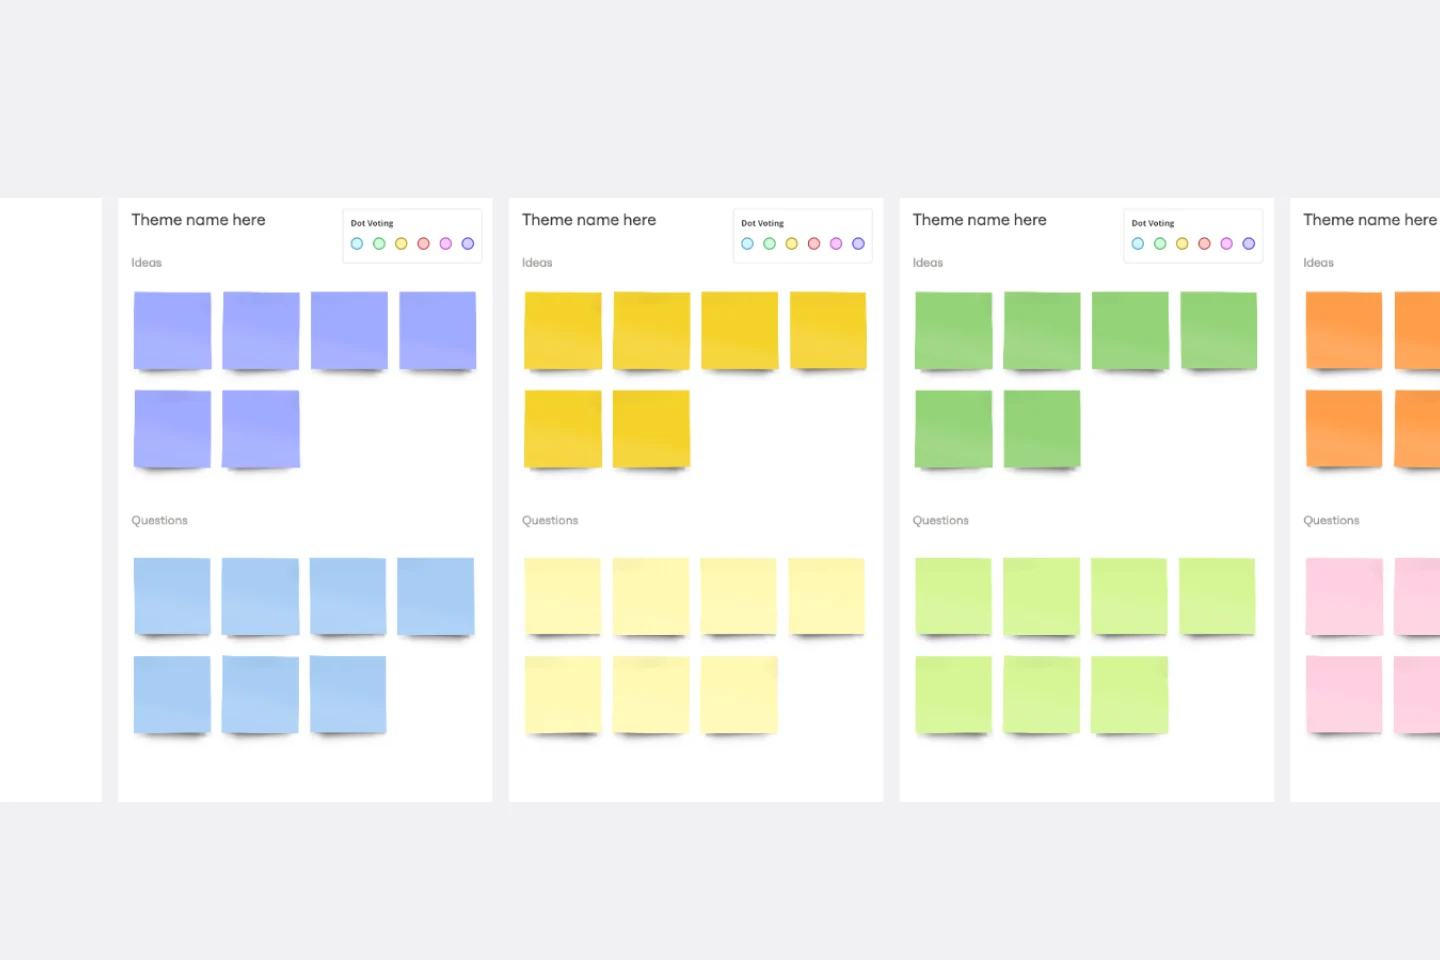
Flow Diagrams
59 likes540 uses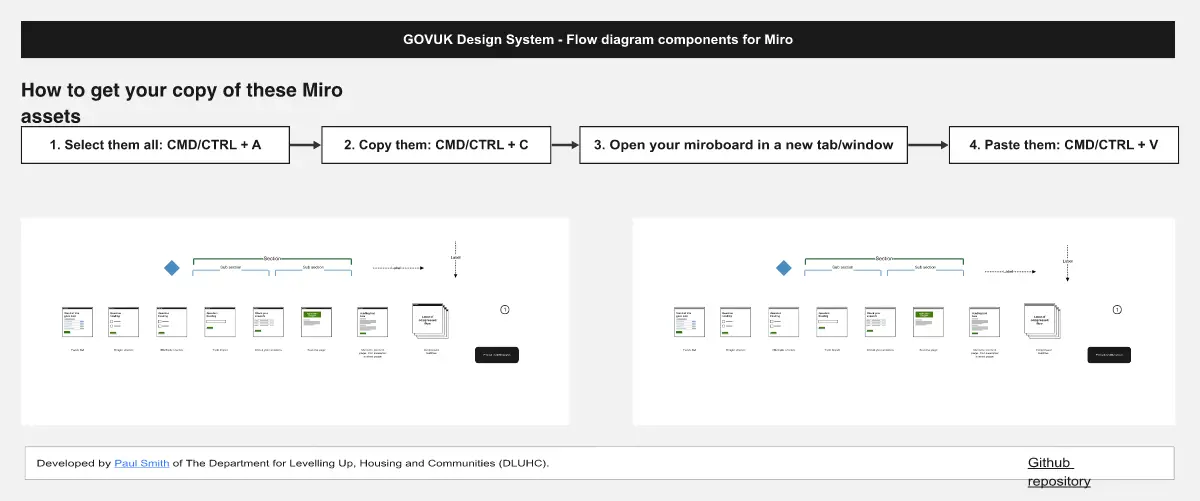
Web Diagram Template
2 likes54 uses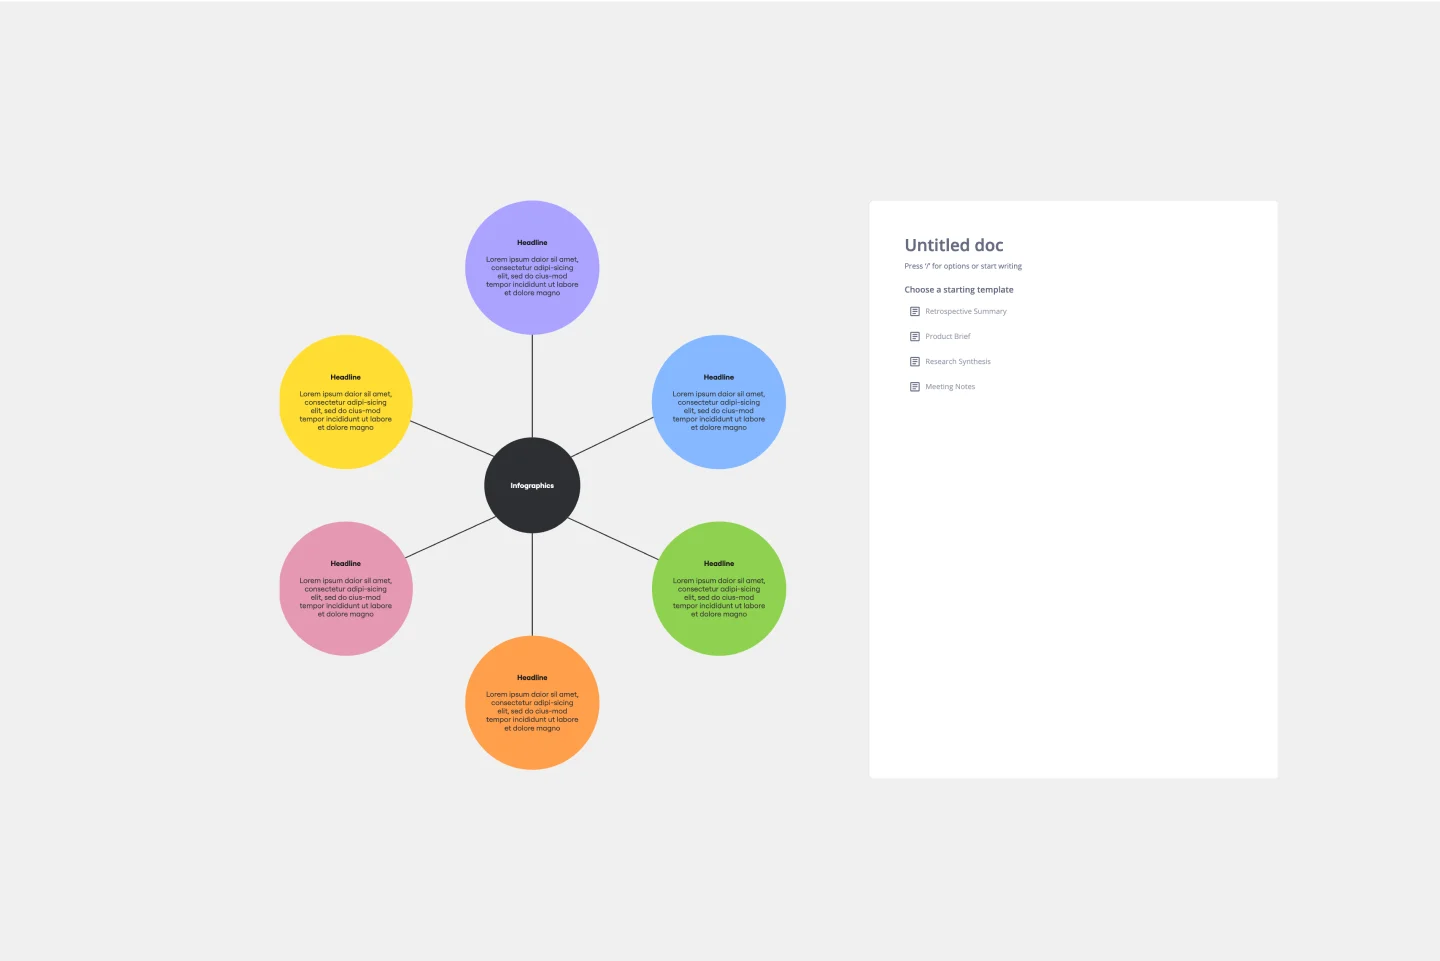
Kinship Diagram Template
2 likes620 uses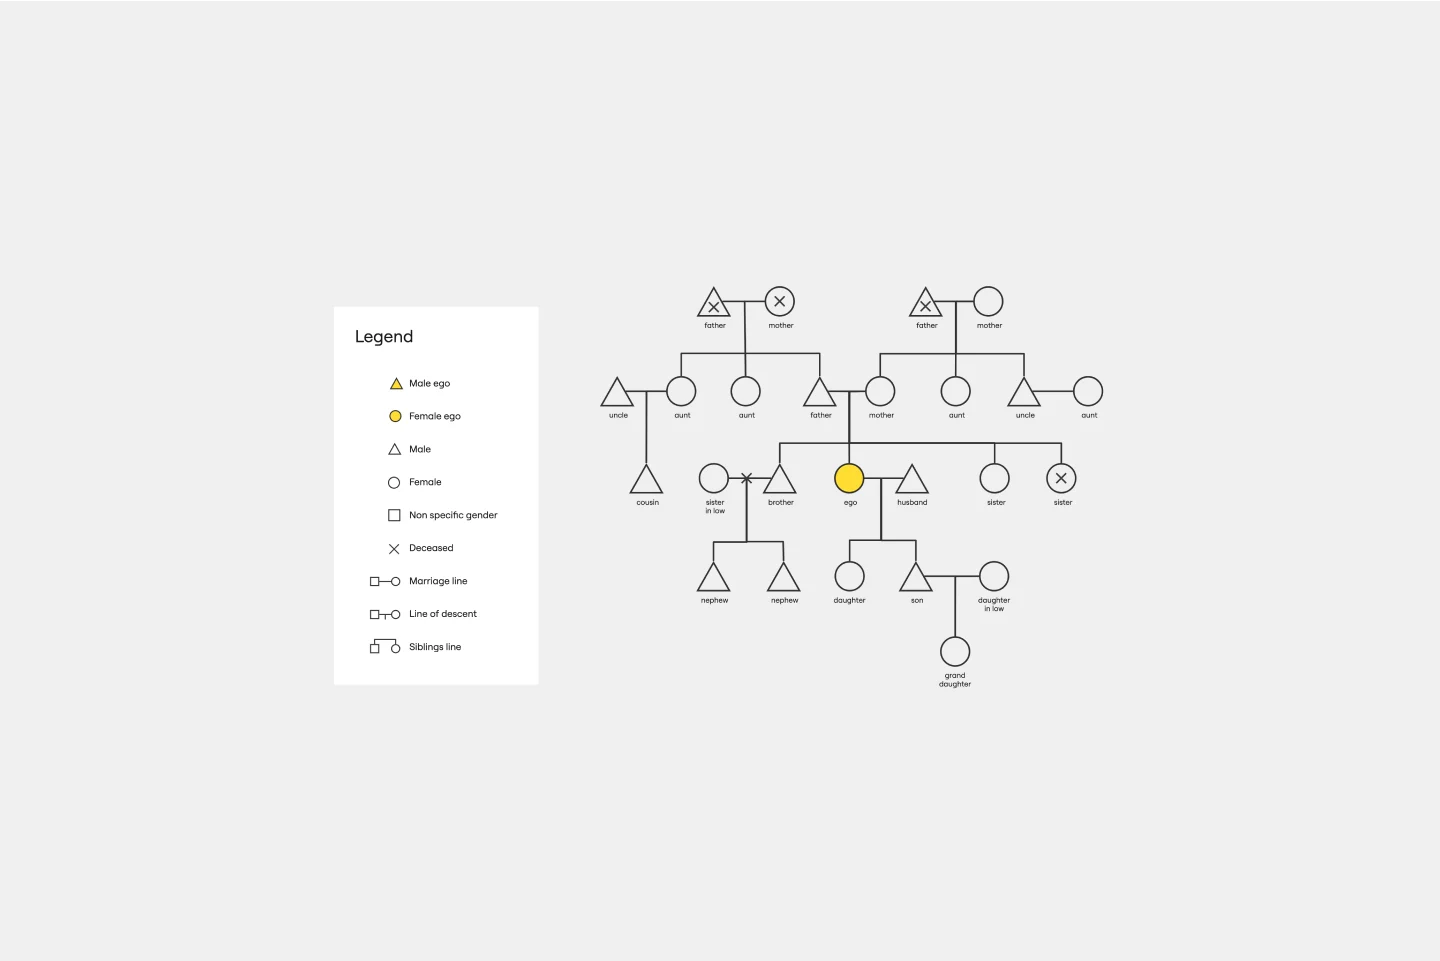
Pedigree Diagram Template
3 likes541 uses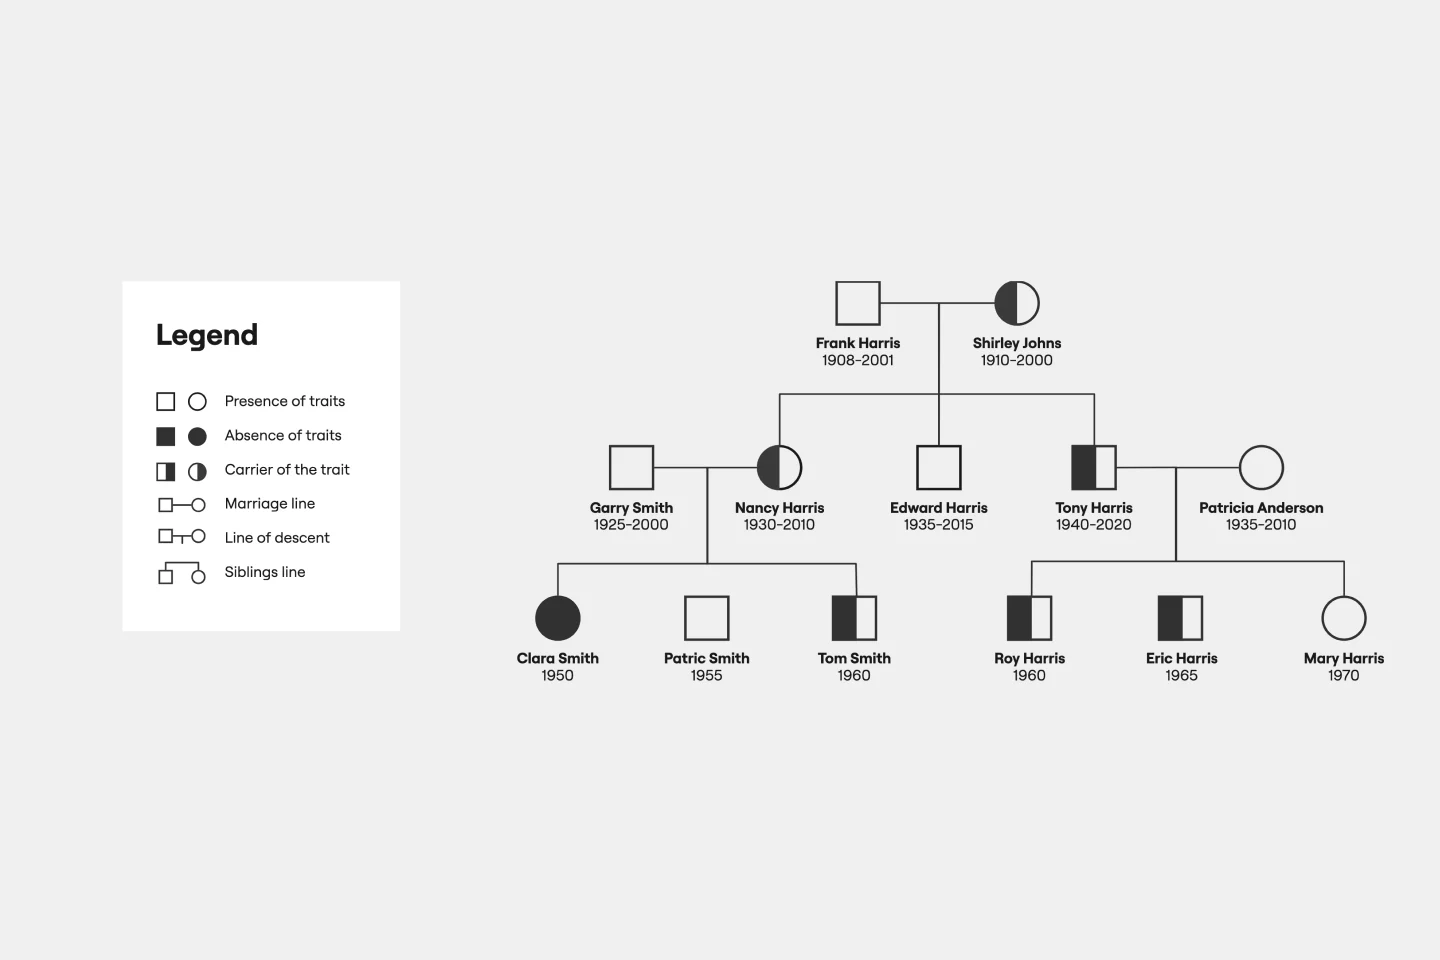
UML Diagram Template
5 likes253 uses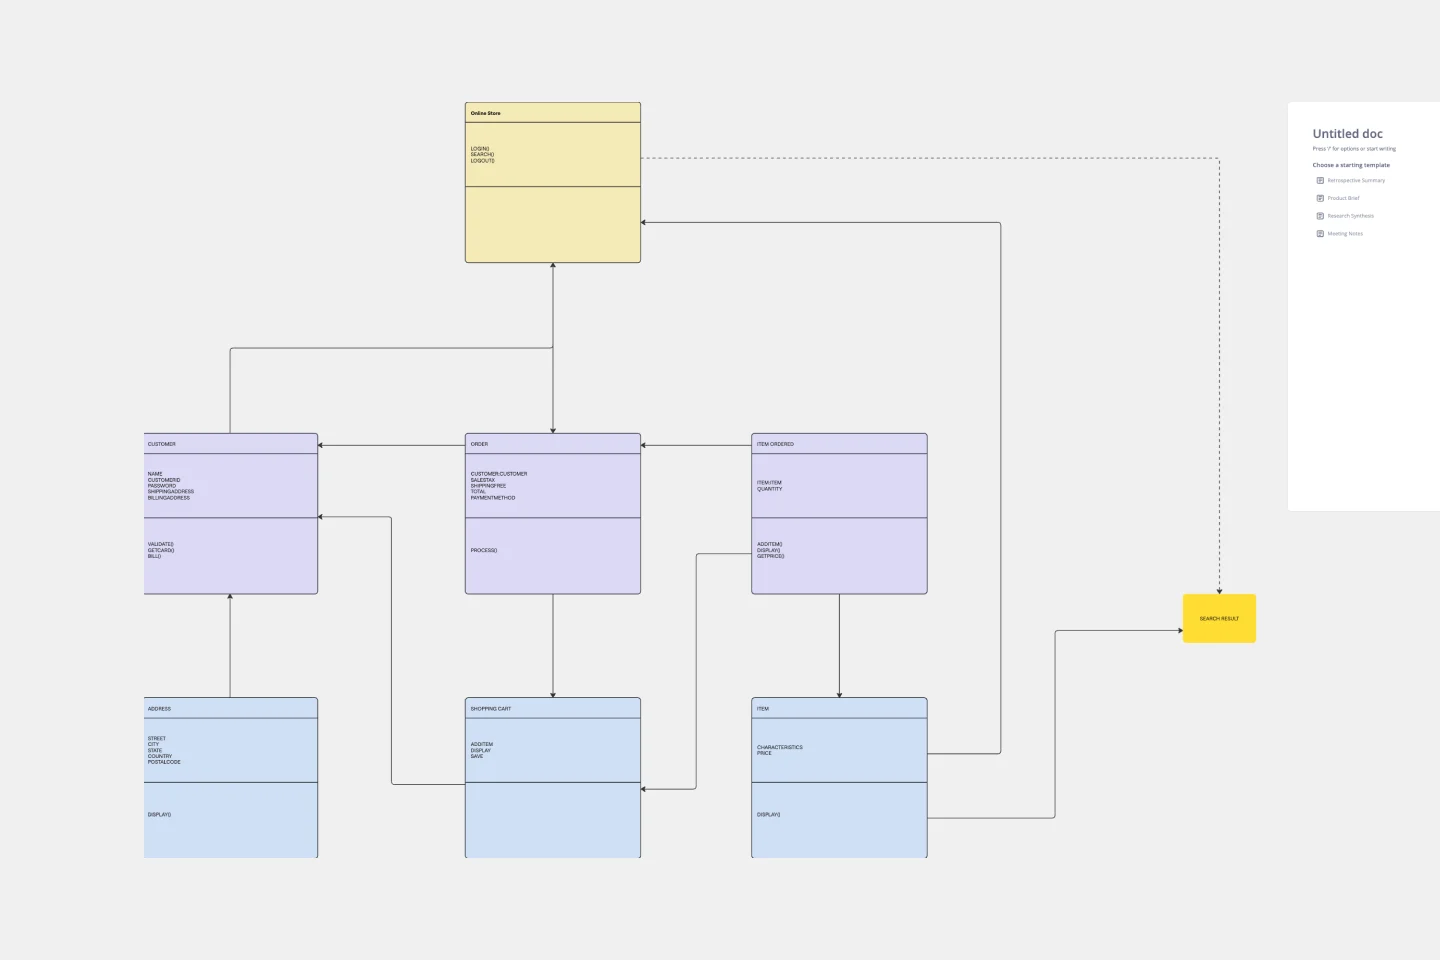
UML Class Diagram
38 likes307 uses