Web Diagram Template
Effortlessly interconnect elements and bring clarity to your ideas across diverse projects with the web diagram template.
About the Web Diagram Template
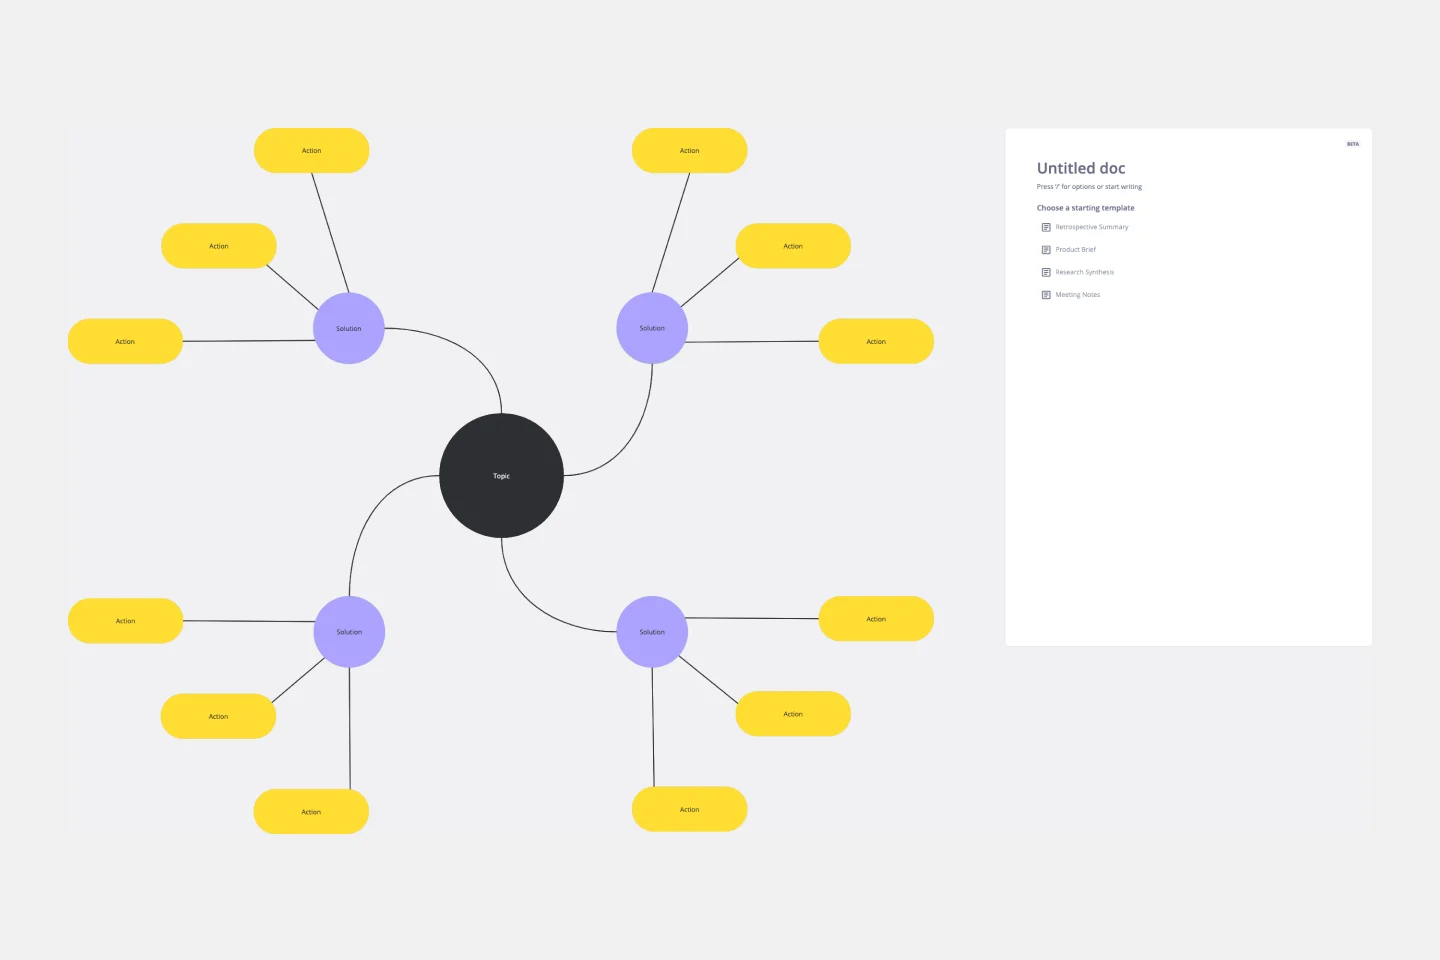
The web diagram template is a useful visual tool that works like a spider diagram. It helps in connecting various elements to create a comprehensive visual story. Whether you are working on web projects, brainstorming sessions, or strategic planning, this template can help you explore and weave a network of ideas that is clear and coherent. It helps in presenting your concepts in a more organized and easy-to-understand manner.
Understanding the web diagram template
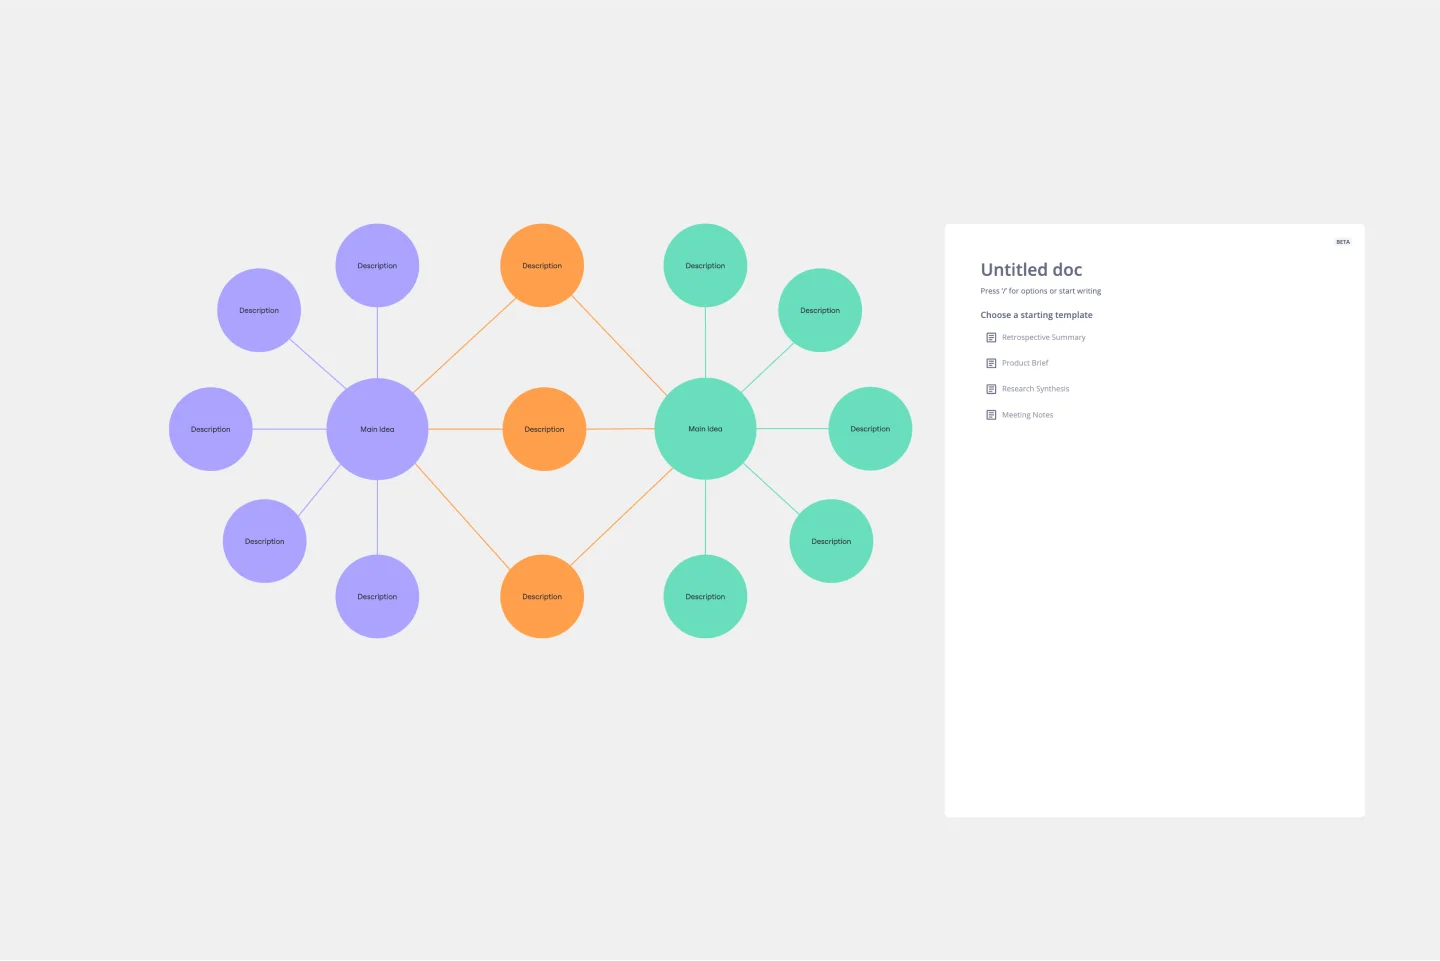
The web diagram template is an adaptable canvas that enables you to delineate relationships and connections among diverse elements, encouraging a comprehensive overview of your ideas. The template's flexibility makes it a valuable asset for various projects, allowing you to navigate complexities and showcase the intricate web of relationships inherent in any concept or strategy.
How to use the web diagram template in Miro
Easy editing: Customize your diagram easily by adding, removing, or repositioning elements. Miro's intuitive interface ensures seamless editing with just a few clicks.
Flexible diagram: As your project progresses, dynamically expand your diagram. The template accommodates the growth of your ideas, ensuring your interconnected web remains a vivid and accurate representation.
Add context: Enhance your diagram with contextual artifacts such as notes, comments, or attachments. This adds depth and clarity, ensuring your visual narrative is informative and interconnected.
Why should you use a web diagram template?
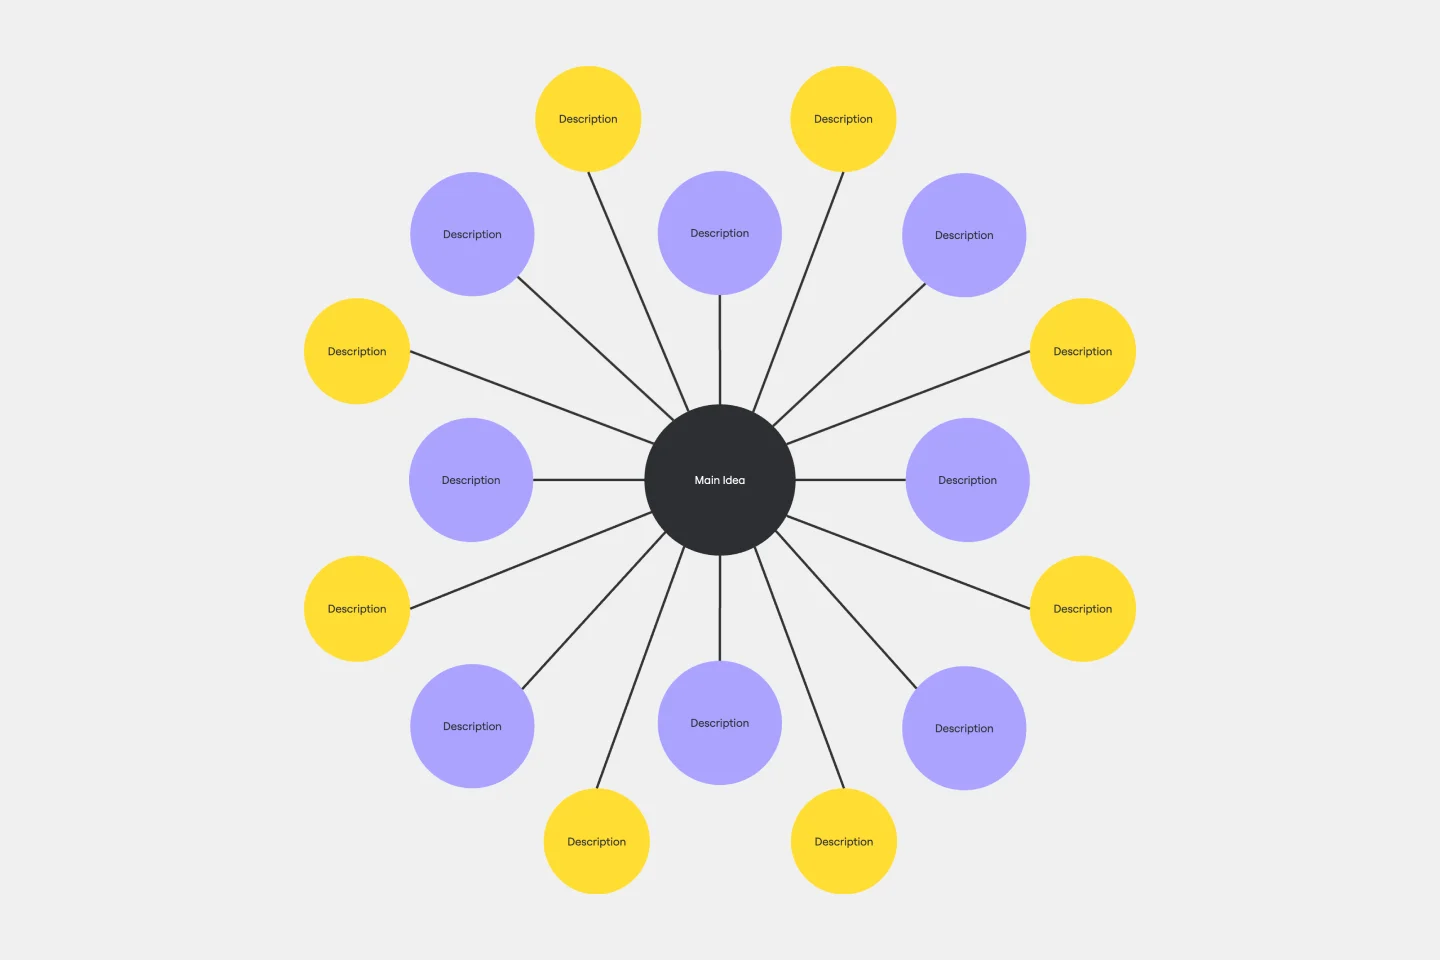
Clear relationships: Demonstrate the connections between different elements to help you better understand your concepts.
Flexible: It can be applied to various scenarios where interconnectedness is essential.
Efficient creation: Use Miro's automated diagramming tools to save time and effort while creating your interconnected web.
Collaborative space: Foster a collaborative environment where team members can contribute and provide insights into the interconnected nature of your ideas.
Adaptability: Navigate through the complexity of any project, adapting your interconnected web as it evolves to ensure relevance and accuracy.
Can I collaborate in real-time on the web diagram with team members?
Yes, Miro's real-time collaboration features allow multiple users to work seamlessly on the same diagram, fostering teamwork and shared insights.
How does the web diagram template maintain clarity as the diagram expands?
Miro's automated diagramming features intelligently adjust as you expand your interconnected web, ensuring that clarity is maintained throughout the evolution of your visual narrative.
Get started with this template right now.
Project Management Flow Chart
Works best for:
Flowcharts, Diagrams, Mapping
The Project Management Flow Chart template offers a visual tool for planning and managing projects using flowchart diagrams. It provides elements for mapping out project phases, tasks, dependencies, and timelines. This template enables project managers and teams to visualize project workflows, identify critical paths, and track progress effectively. By promoting clarity and transparency, the Project Management Flow Chart empowers organizations to deliver projects on time, within budget, and according to specifications.
Tree Diagram Template
Works best for:
Diagramming
The tree diagram template helps you organize and present complex information. One of its key benefits is its ability to provide unparalleled visual clarity. It enables you to simplify complicated ideas into a structured, hierarchical format, making it easier to understand and communicate. This template enhances brainstorming sessions, project planning, and decision-making processes by mapping out relationships and dependencies clearly and effortlessly. You can now say goodbye to information overload and immerse yourself in a visual journey that simplifies complexity with the tree diagram template.
Bank Mobile App User Journey
Works best for:
Diagramming
The Bank Mobile App User Journey template offers a visual framework for mapping out the user experience journey within a banking mobile application. It provides elements for visualizing user interactions, touchpoints, and emotions throughout the journey. This template enables teams to understand user needs, pain points, and opportunities for improvement, facilitating the design of user-friendly and intuitive banking apps. By promoting empathy and user-centric design, the Bank Mobile App User Journey template empowers teams to create digital experiences that meet customer expectations and drive engagement.
UML Class Content Management System (CMS) Template
Works best for:
UML
The UML Class Content Management System CMS Template simplifies documenting and designing the architecture of a Content Management System. It allows for the creation of UML class diagrams to visualize the structure of a CMS. Teams can efficiently map out key classes and their interactions, such as how users create, manage, and publish digital content. The template's integration into Miro's collaborative platform allows for real-time teamwork, customization, and easy sharing of feedback. This streamlines the documentation process and is valuable for software development projects aiming to develop or refine a CMS.
AWS Git to S3 Webhooks Template
Works best for:
Software Development, Diagrams
The AWS Git to S3 Webhooks Template is a visual representation of Git webhooks with AWS services Quick Start architecture. You can now have an overview of your AWS architecture with Miro’s AWS Git to S3 Webhooks Template, track your cloud solutions easily, and optimize processes like never before.
Fishbone Diagram Template
Works best for:
Operations, Diagrams, Workflows
What is the best way to solve any problem your team faces? Go straight to the root. That means identifying the root causes of the problem, and fishbone diagrams are designed to help you do it best. Also known as the Ishikawa Diagram (named after Japanese quality control expert Kaoru Ishikawa), fishbone diagrams allow teams to visualize all possible causes of a problem, to explore and understand how they fit together holistically. Teams can also use fishbone diagrams as a starting point for thinking about what the root cause of a future problem might be.