


Presentations for research analysts

Turn your findings into a stakeholder-ready deck without rebuilding from scratch. Present live, share async, and keep your analysis front and center.

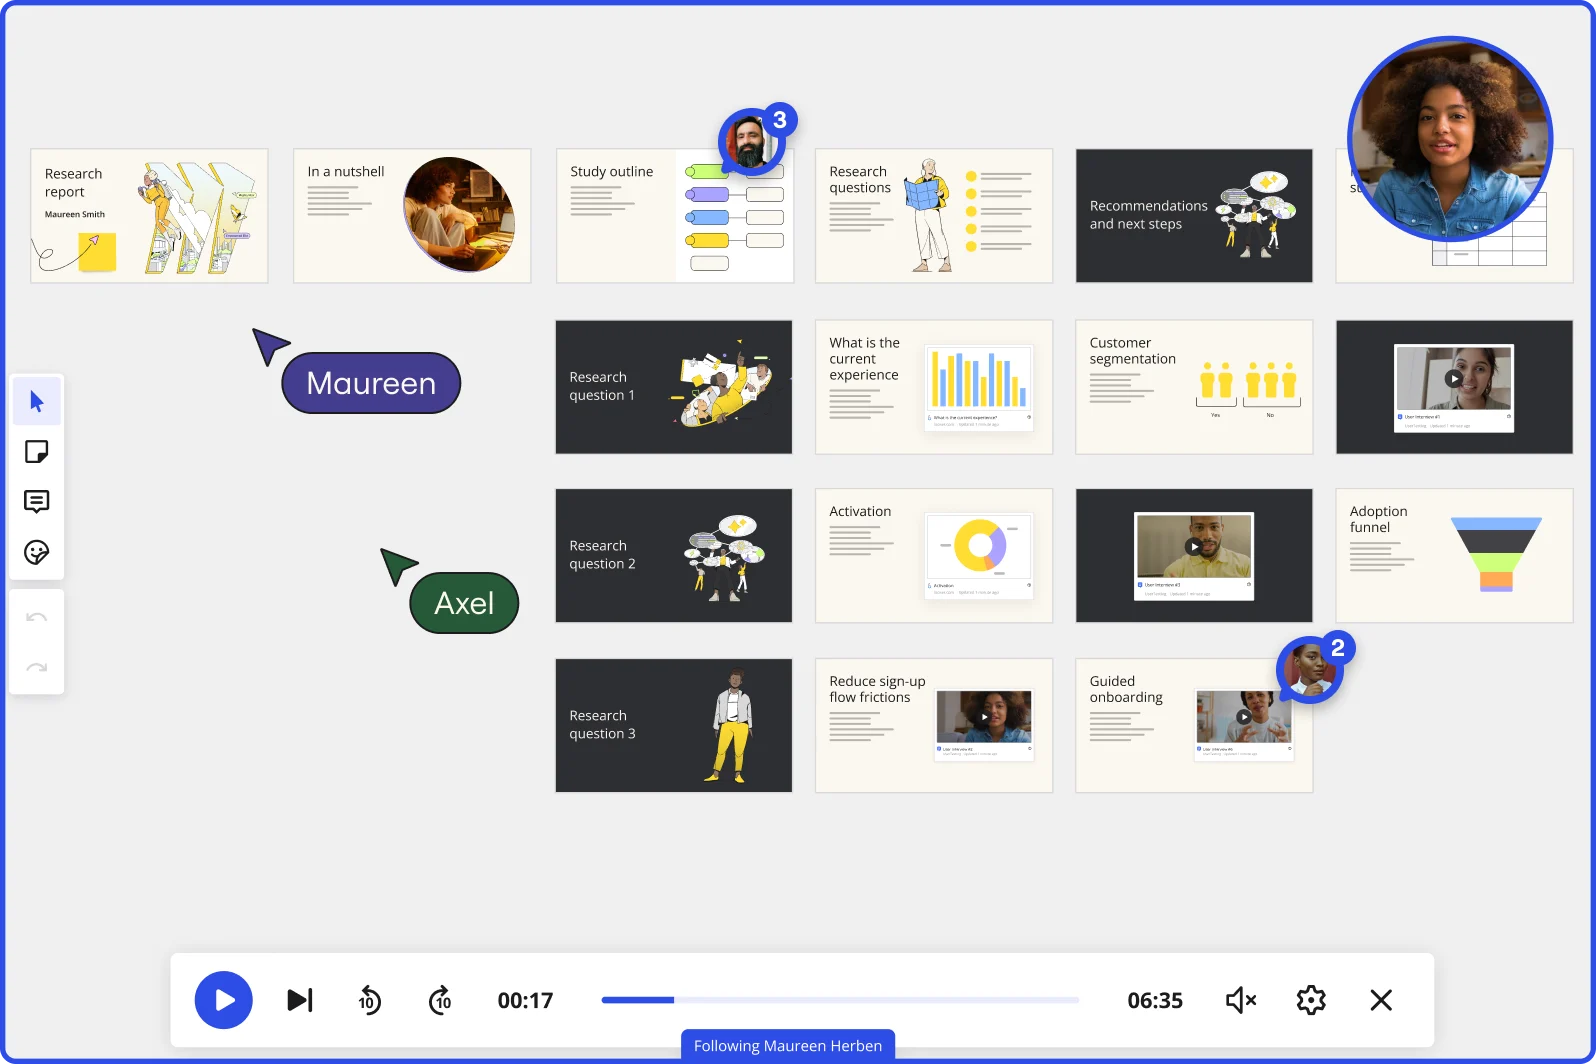
Miro board in Interactive Presentation Mode displaying a research report presentation with multiple slides organized in rows, covering topics including research questions, customer segmentation charts, adoption funnel, and guided onboarding, with two collaborators (Maureen and Axel) visible as cursors, video playback controls at the bottom showing 00:17 of 06:35, and a live webcam feed of a presenter in the top right corner.

What experts say

  • The way we present information and tell stories using slides has a massive impact on how well our ideas are understood and remembered.

    Nancy Duarte

    Speaker and CEO · Duarte

    Industry Expert
  • Professionals who flip their workflow - thinking first, slides last - create presentations in half the time with dramatically better results.

    Mary Beth Hazeldine

    Author · Winning Presentations

    Industry Expert

The research on presentations and slides

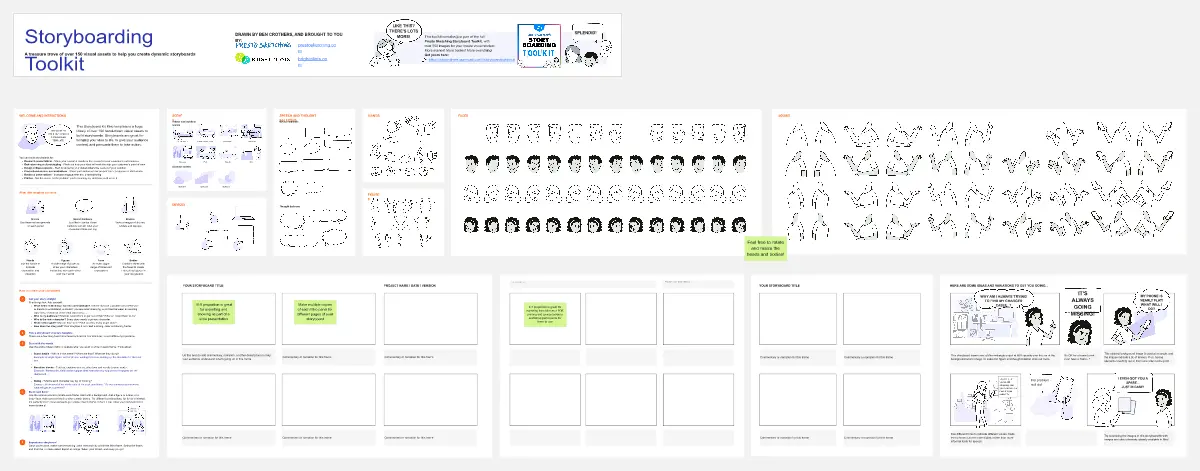
  • Storyboarding helps analysts organize thoughts into visual narratives and present findings through a structured visual layout.

    Source: SAGE Publishing

  • 66%

    Visual presentations with graphs and diagrams increased audience conviction from 50% (verbal only) to over 66%, demonstrating the persuasive power of diagramming in consulting presentations

    Source: Cornell University / Wharton School of Business

See presentations and slides in action

Related templates for research analysts

We have 22 templates in our library for Presentations and Slides.

Why research analysts love creating presentations with Miro Slides

  • From raw data to structured findings deck

    After a research sprint, your insights live across Affinity diagrams, tagged sticky notes, and synthesis maps - none of it in a format your VP of Product or CX lead can absorb in 20 minutes. Select the frames that tell the story and use Miro's AI slide generator to turn that canvas directly into a structured deck, complete with layout options, title slides, and summary slides.
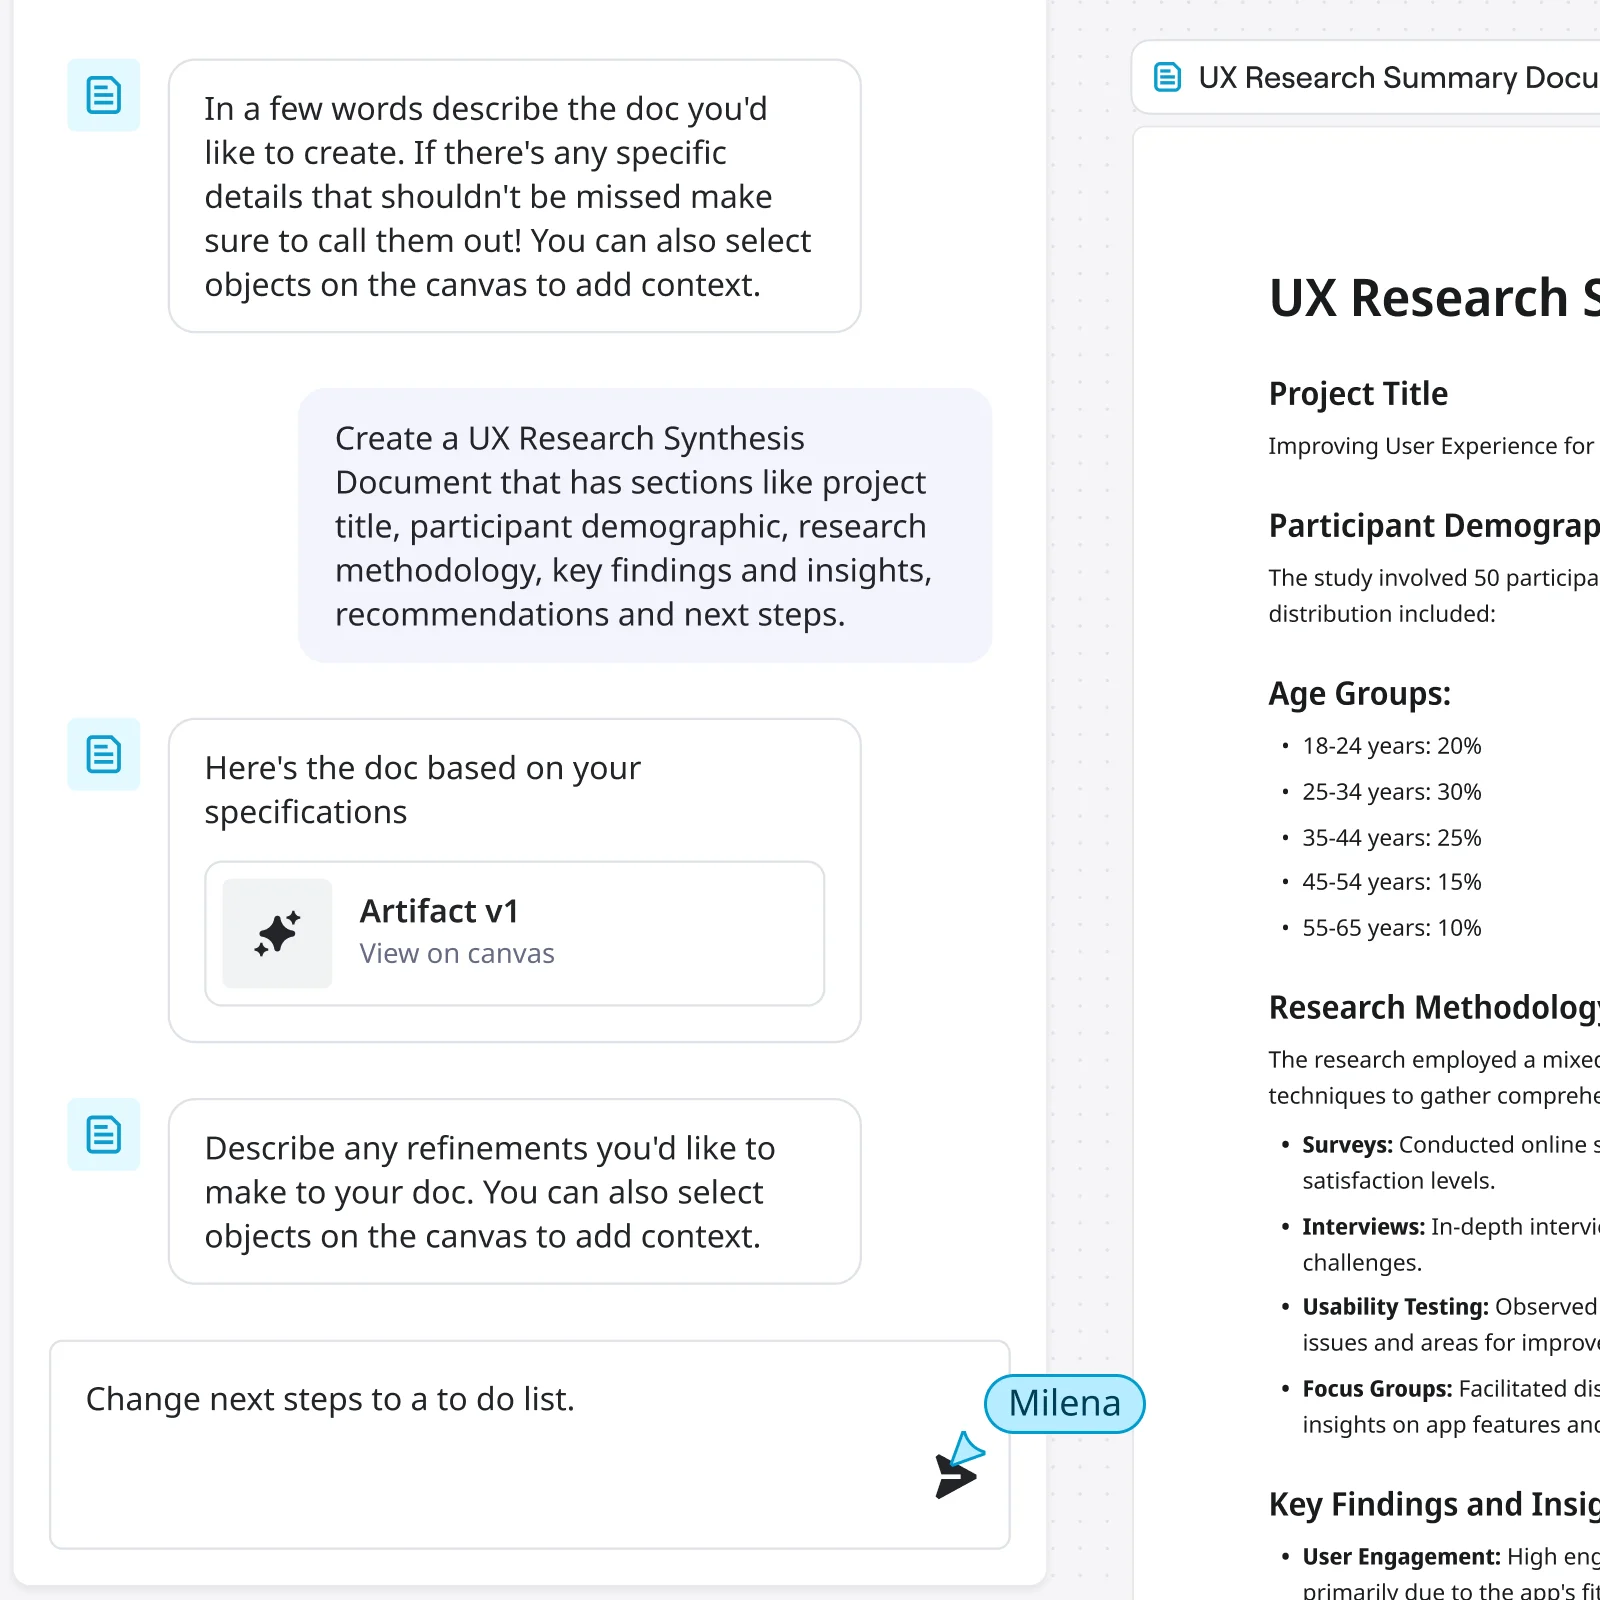
    Miro AI chat panel on the left showing a conversation where a user requests a UX Research Synthesis Document, and the AI generates it as an artifact viewable on the canvas on the right, displaying sections including Project Title, Participant Demographics with age group breakdowns, Research Methodology with survey/interview/usability testing/focus group bullets, and Key Findings and Insights.
  • When your findings need to reach three different audiences

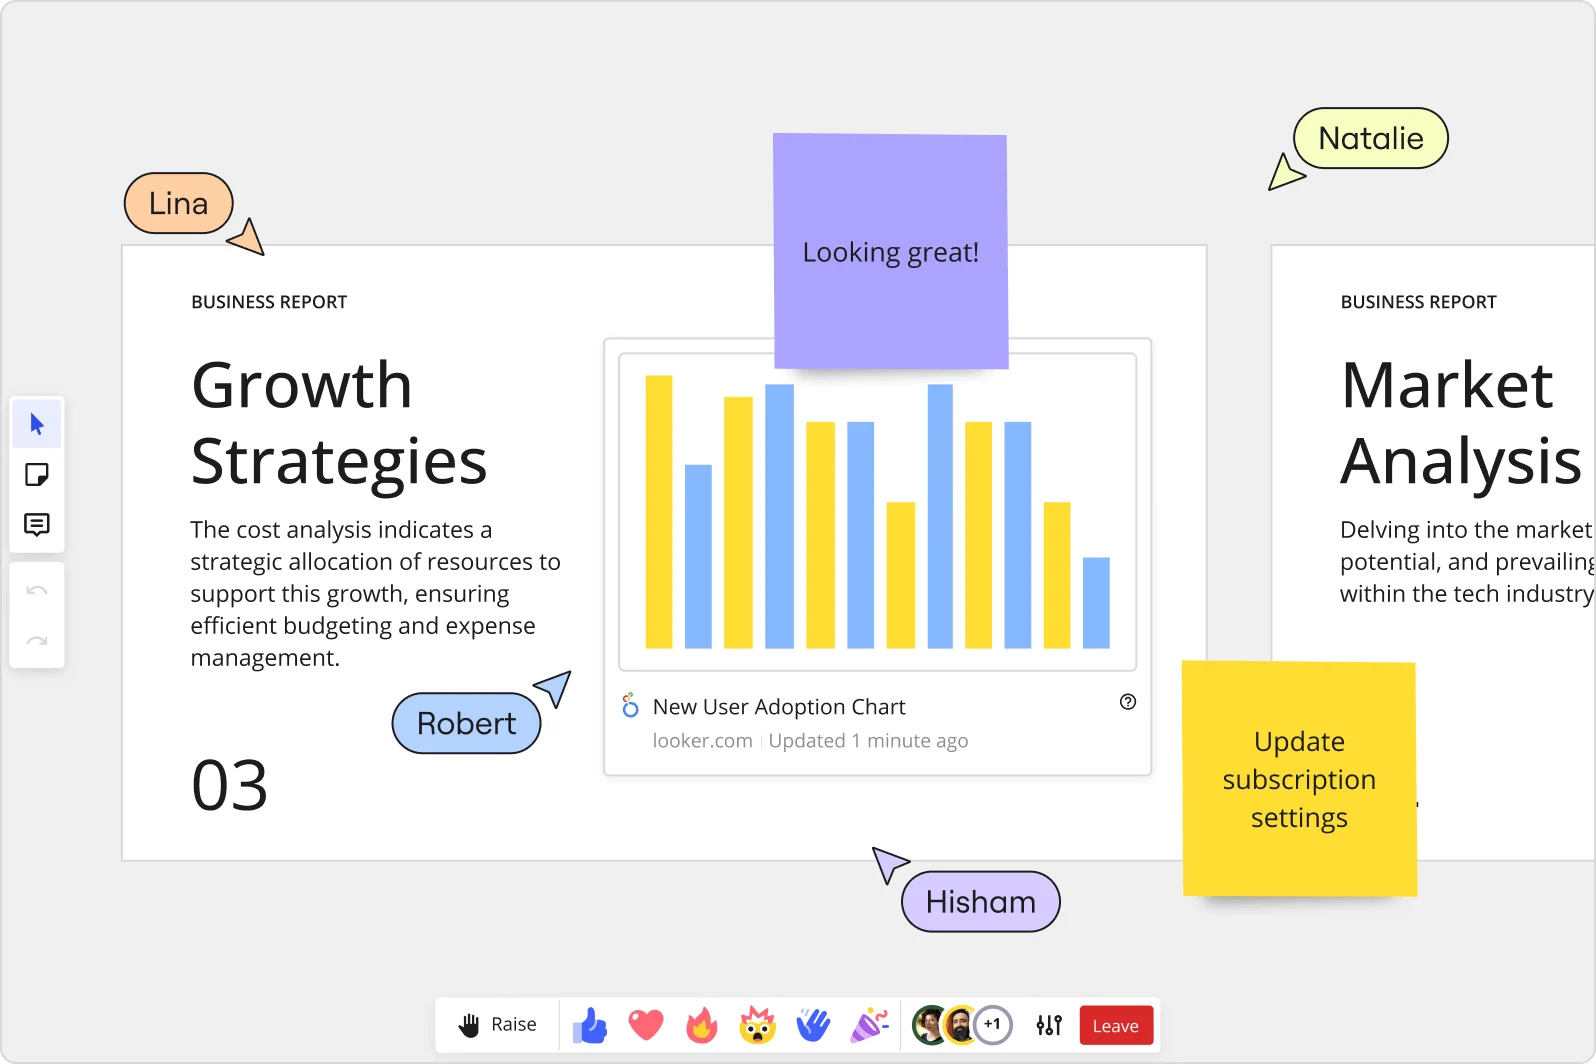
    A small research team might send one deck to everyone. A larger org often needs an executive cut, a working-team version, and a client-facing variant - all from the same source material. AI Sidekicks restructure your findings deck per audience, and Synced Copies push master updates to every version in seconds, so a revised methodology slide doesn't require three manual edits.

    Miro collaborative presentation workspace showing two business report slides ('Growth Strategies' and 'Market Analysis') with an embedded Looker 'New User Adoption Chart' bar chart, purple and yellow sticky notes with comments, and four named collaborator cursors (Lina, Robert, Natalie, Hisham) visible simultaneously.
  • Stop losing your narrative when analysts go async

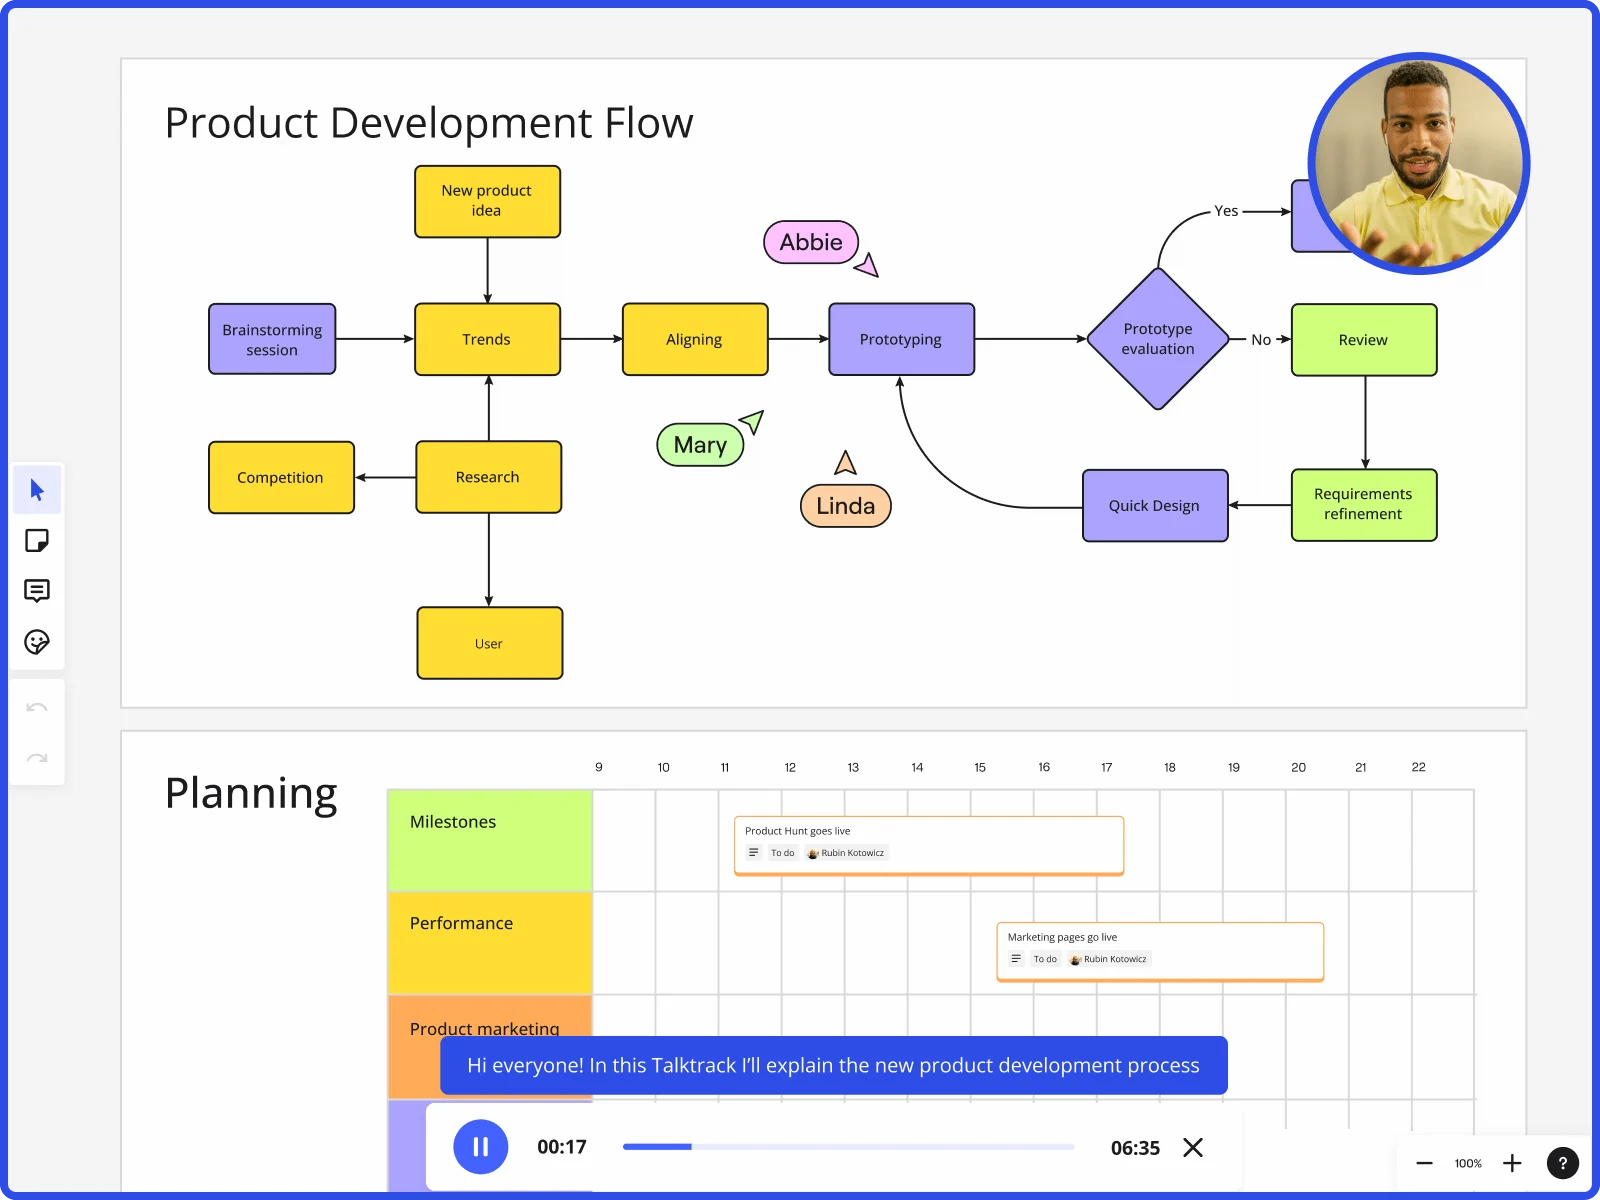
    Distributed reviewers - design directors, product leads, and procurement stakeholders - rarely attend every live readout. A Talktrack recording captures your narration synchronized with each frame, so decision-makers replay the full session with your emphasis and context intact, not just a silent PDF export.

    Miro board showing product development flow with brainstorming, research, prototyping stages and planning timeline with Talktrack presentation
  • Your recurring research readout, without the rebuild

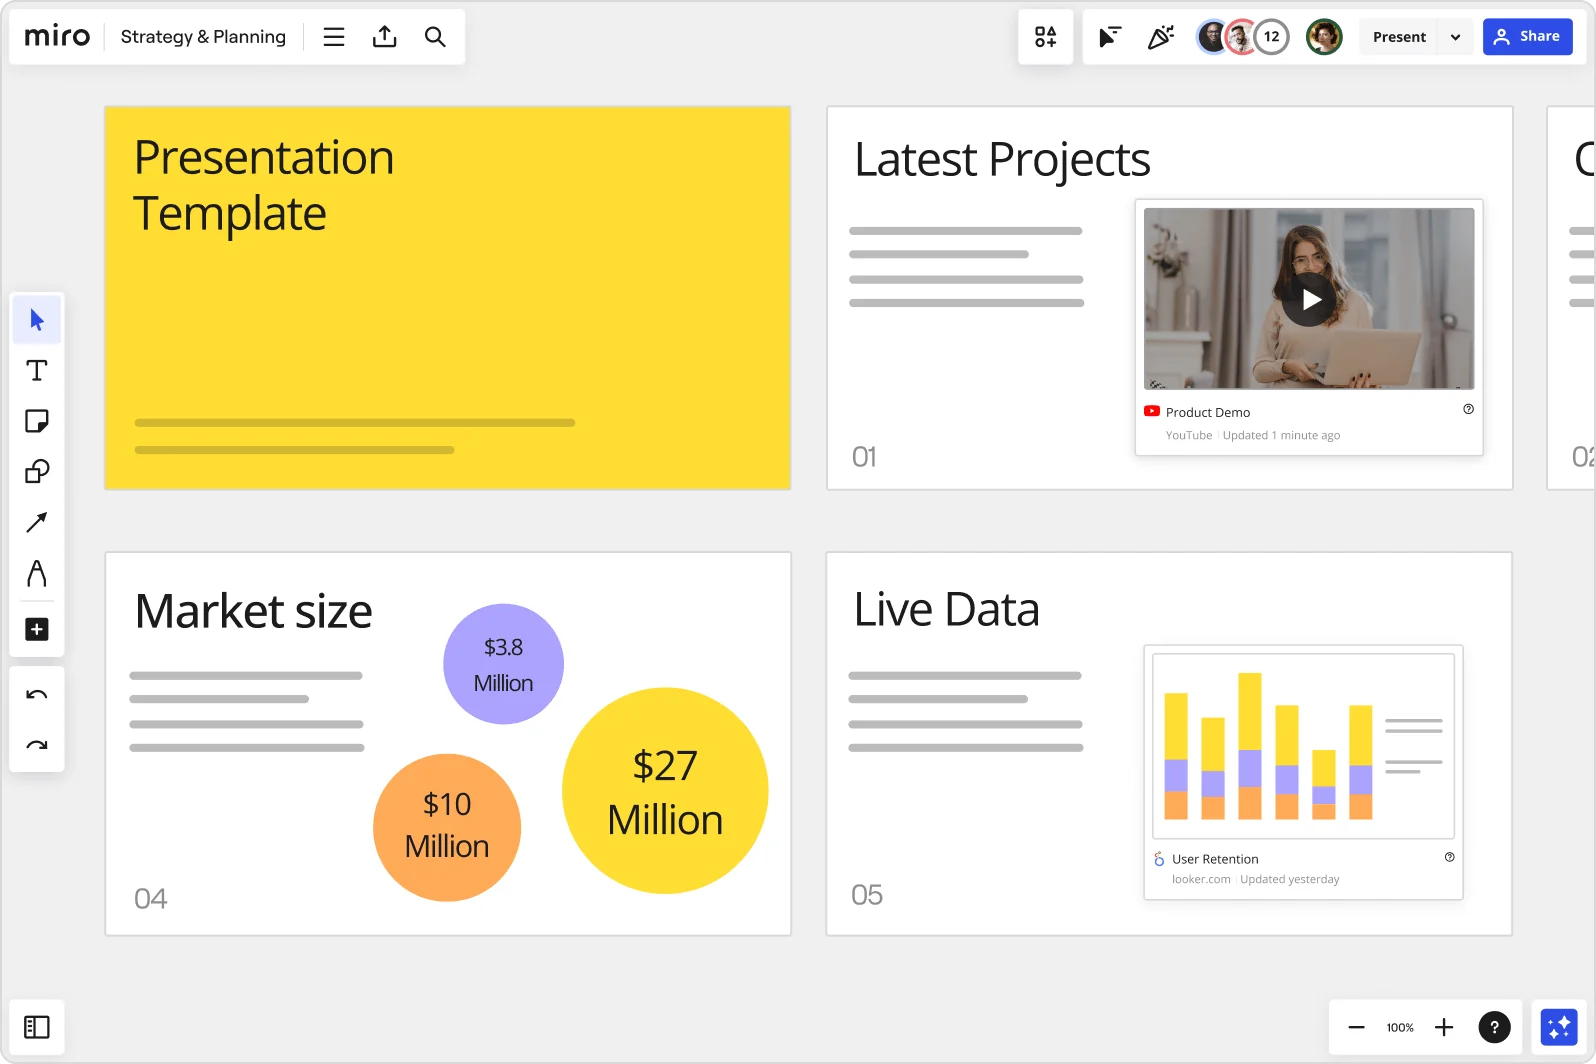
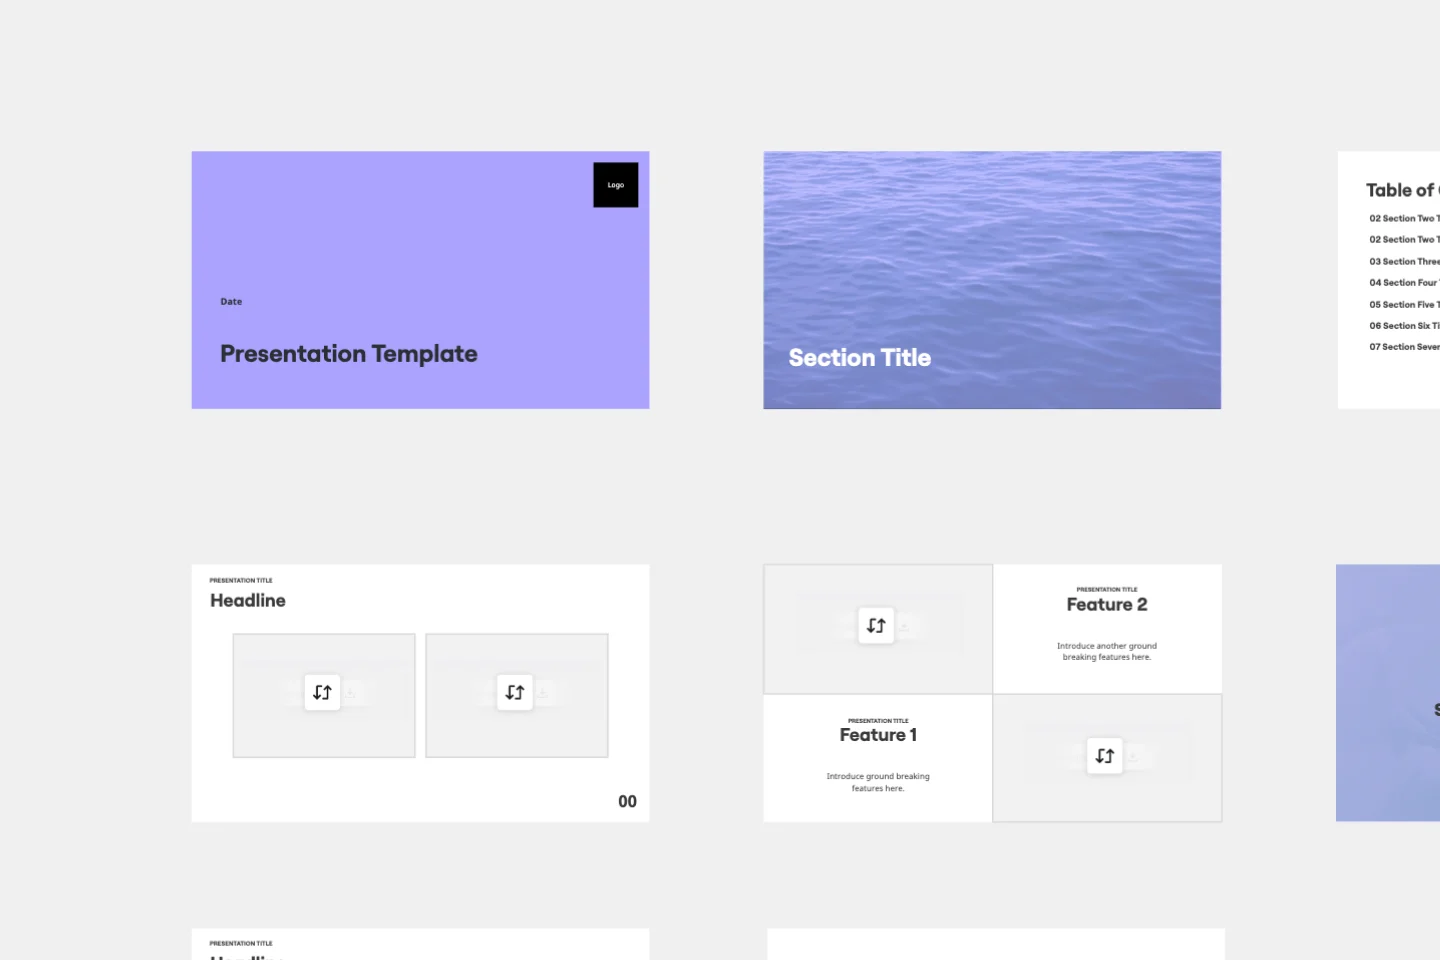
    Whether you run bi-weekly usability reviews or quarterly longitudinal studies, rebuilding the same deck structure wastes time you'd rather spend on analysis. Save your research presentation format as a custom template or Blueprint, and every new cycle starts with the right frames, Engage activity slots, and embedded speaker notes already in place.

    Miro board showing a Strategy & Planning presentation workspace with four slides visible: a yellow title slide labeled 'Presentation Template', a 'Latest Projects' slide with an embedded YouTube Product Demo video, a 'Market size' slide with bubble charts showing $3.8M, $10M, and $27M values, and a 'Live Data' slide featuring an embedded Looker.com User Retention bar chart.
  • Live Q&A that actually captures the room

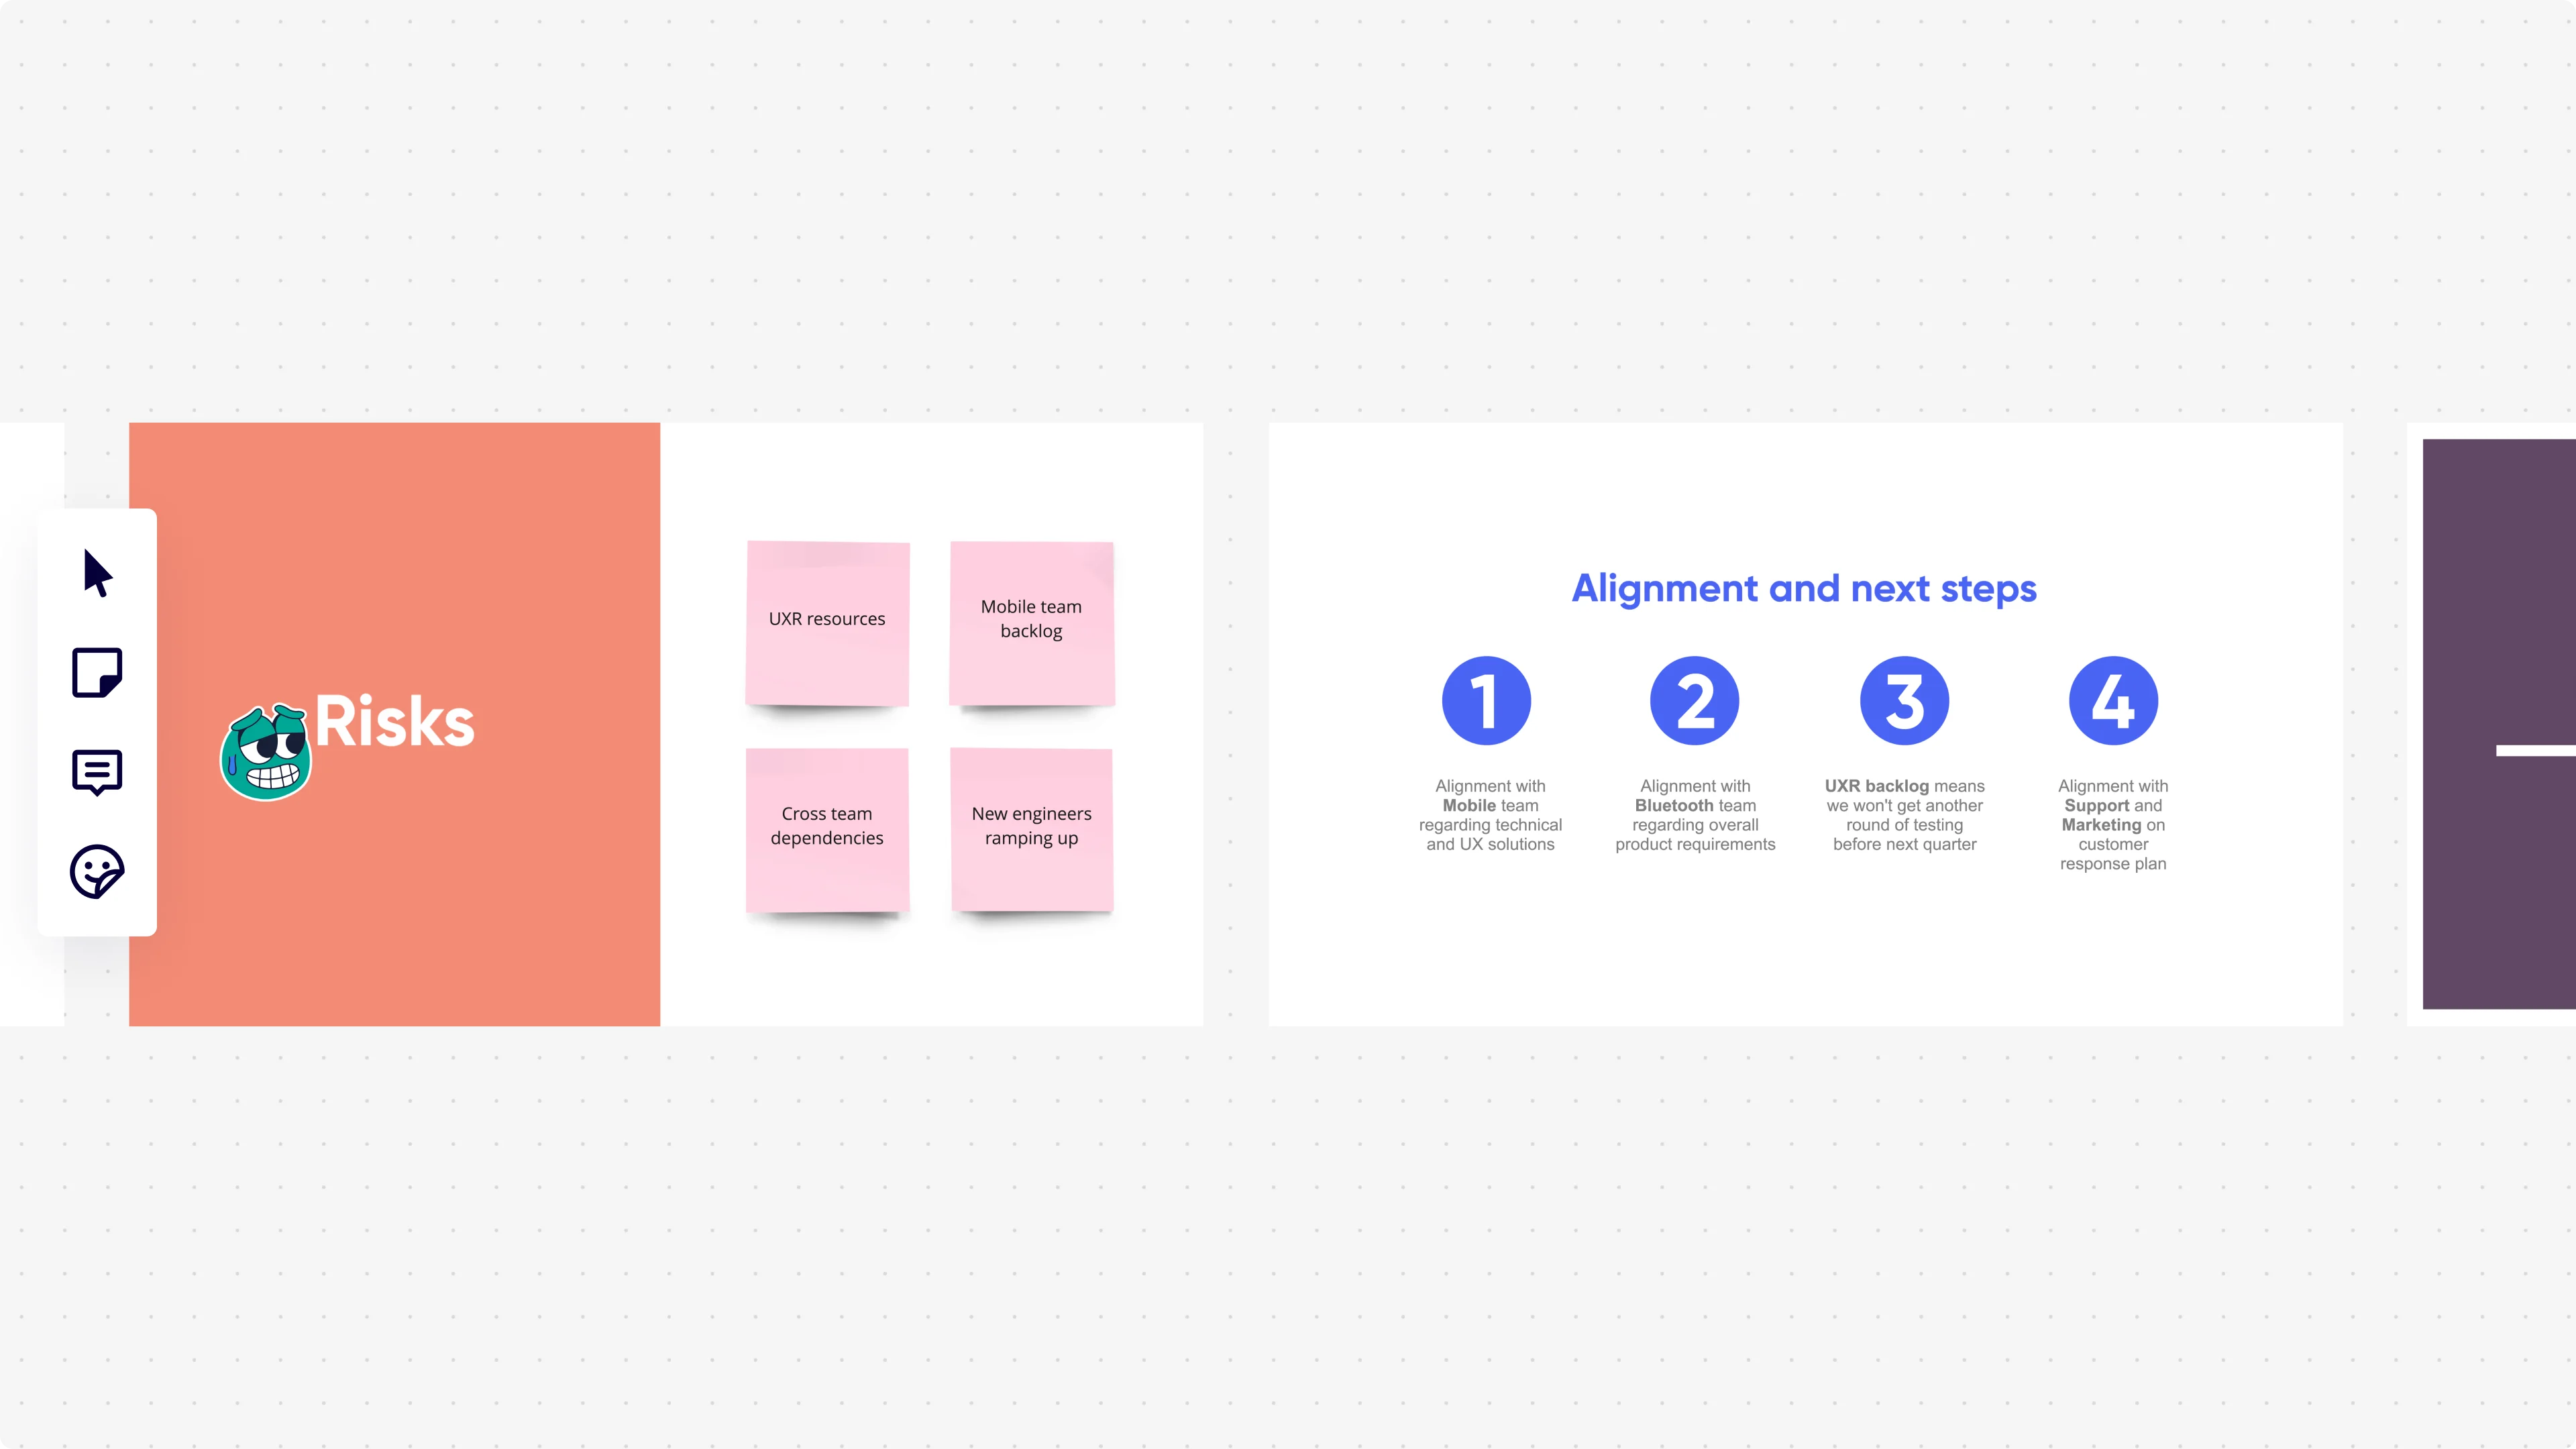
    After presenting findings, the most useful signal often comes from the discussion - but verbal responses disappear. Embed Multiple Choice polls, Word Cloud activities, and open-ended Q&A directly into your slides. Attendees join from their phone via QR code, no Miro account needed, and responses export straight to sticky notes on your board for follow-up analysis.

    Miro presentation mode displaying two slides side by side: a 'Risks' slide with an orange background showing four pink sticky notes (UXR resources, Mobile team backlog, Cross team dependencies, New engineers ramping up), and an 'Alignment and next steps' slide with four numbered blue circle icons listing team alignment actions with Mobile, Bluetooth, UXR backlog, and Support/Marketing teams.

How research analysts get started with Presentations in Miro

  • Pull your findings into frames

    Open a new board and use Frames to map each insight theme - confidence level, sample size, and key quote - directly from your Dovetail or Aurelius exports into individual slides before you touch a single design element.

  • Draft your readout with AI Slides

    Describe your study scope and stakeholder audience in a text prompt (e.g., "8-slide research readout: methodology, key themes, opportunity areas, and recommendations for a product team") and let AI Generate Slides build the narrative skeleton, so you're editing a story rather than staring at a blank canvas.

  • Embed live data where it matters

    Drop your quantitative cuts directly into the deck using External Embeds for live Looker or Power BI charts, so the numbers in your findings slides always reflect the latest data pull when you present to PMs or executives - no manual copy-paste before every readout.

  • Record a Talktrack for async stakeholders

    Narrate your synthesis walkthrough with Talktrack - capturing why a finding is directional even when the data is messy - so product leads who miss the live session get the full research story, not just a deck stripped of context.

Slides tips for research analysts

  • Use the Product Marketer Sidekick via Action Shortcuts on dense insight slides to flag where a finding reads like raw data rather than a clear implication - it'll prompt you to reframe for a non-research audience before the deck goes to leadership.

  • For recurring research readouts tied to product review cycles, save your findings frame structure as a Custom Template so the methodology slide, theme grid, and recommendations format carry over to the next sprint without rebuilding from scratch.

  • When your study spans multiple markets or languages, run Miro AI Translate on slide text before sharing globally - it supports 18 languages and keeps your insight framing intact rather than leaving translation to whoever opens the deck.

Understand how research analysts transform their work

  • I use Miro as a substitute for PowerPoint slides when I want a more interactive discussion.

    Verified User

    TrustRadius
  • Settting up interactive workshops in one platform - emotes and voting tools provide an easy to use way of structuring participant input. Far better than anything I have worked with so far.

    Verified User

    G2

Presentations and slides essential guide for research analysts

CategoryKey insights
  • Common mistakes to avoid

    The biggest trap for analysts is cramming a findings deck with every data cut, confidence interval, and methodology note onto a single frame. Treat each frame like a slide your PM has fifteen seconds to absorb, not a data appendix. Also, check sharing permissions before you send the link out: exposing the full research board instead of the curated frame sequence is the fastest way to bury your headline insight in a sea of sticky notes.

  • Key integrations for research analysts

    Google Slides and Microsoft PowerPoint let analysts export polished deliverables when stakeholders need a file they can own, while Confluence keeps research readouts living alongside the product documentation they inform. Zoom and Microsoft Teams connect directly for live readouts, and Dovetail or Qualtrics outputs can be embedded via Iframe so the source data sits right behind the insight, not in a separate tab.

  • When to use it

    Use this when your research sprint has wrapped and you need to turn tagged themes from Dovetail into a findings deck before the roadmap locks, without rebuilding everything in a separate slide tool. A product team is halfway through a quarterly review cycle: the analyst opens the Miro board where synthesis happened, creates Frames around each insight theme, and uses AI slide generation to pull the narrative together fast. Stakeholders in a different time zone get a Talktrack recording with narrated context so the "why behind the finding" doesn't get lost in an email thread.

  • Security & Compliance

    Analysts handling proprietary research, competitive intelligence, or participant data need to know that Miro is SOC 2 Type II certified, which covers the audit requirements most enterprise procurement teams will ask about first. For firms in regulated industries or with strict data governance policies, data residency controls and granular sharing permissions mean analysts can share a curated presentation view without exposing raw board content or unfinished synthesis work. Private Mode adds an extra layer when a session involves sensitive findings that aren't ready for the full room.

Frequently asked questions for research analysts

Last updated: Thursday, July 30, 2026