Stage-Gate Process Flowchart Template
Improve decision-making, mitigate risks, and drive project success with the stage-gate process flowchart template.
About the Stage-Gate Process Flowchart Template
The Stage-Gate Process Flowchart Template is a significant asset for project management, designed to simplify the advancement of projects through different stages. This template provides a systematic approach that helps teams efficiently manage and monitor each phase of a project, starting from the beginning to completion. It guides teams through a sequence of checkpoints or "gates" where decisions are made before moving on to the subsequent stage.
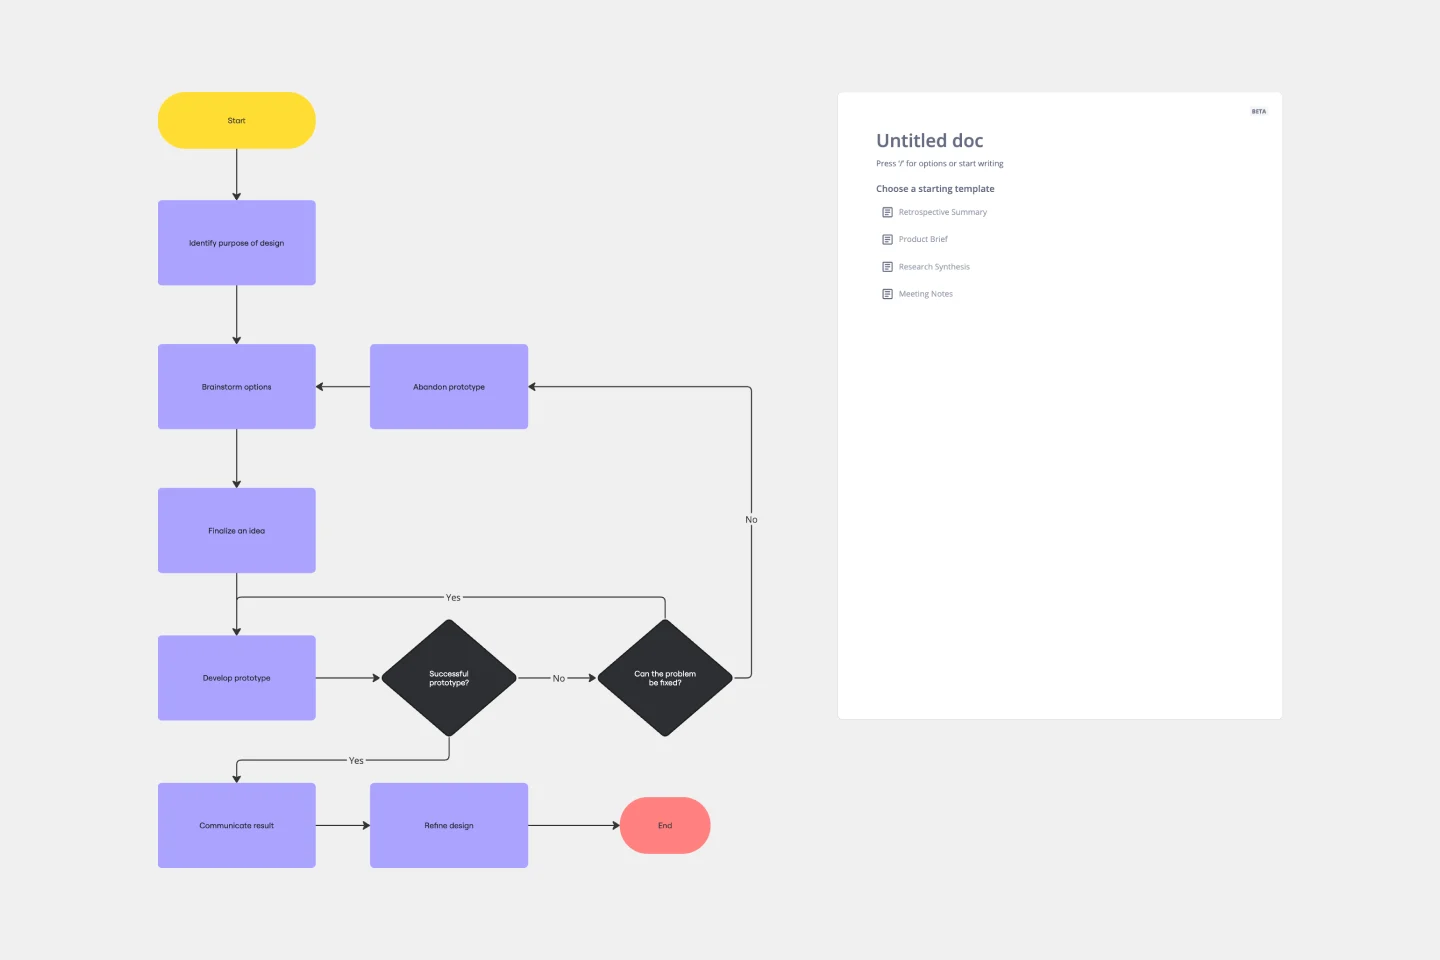
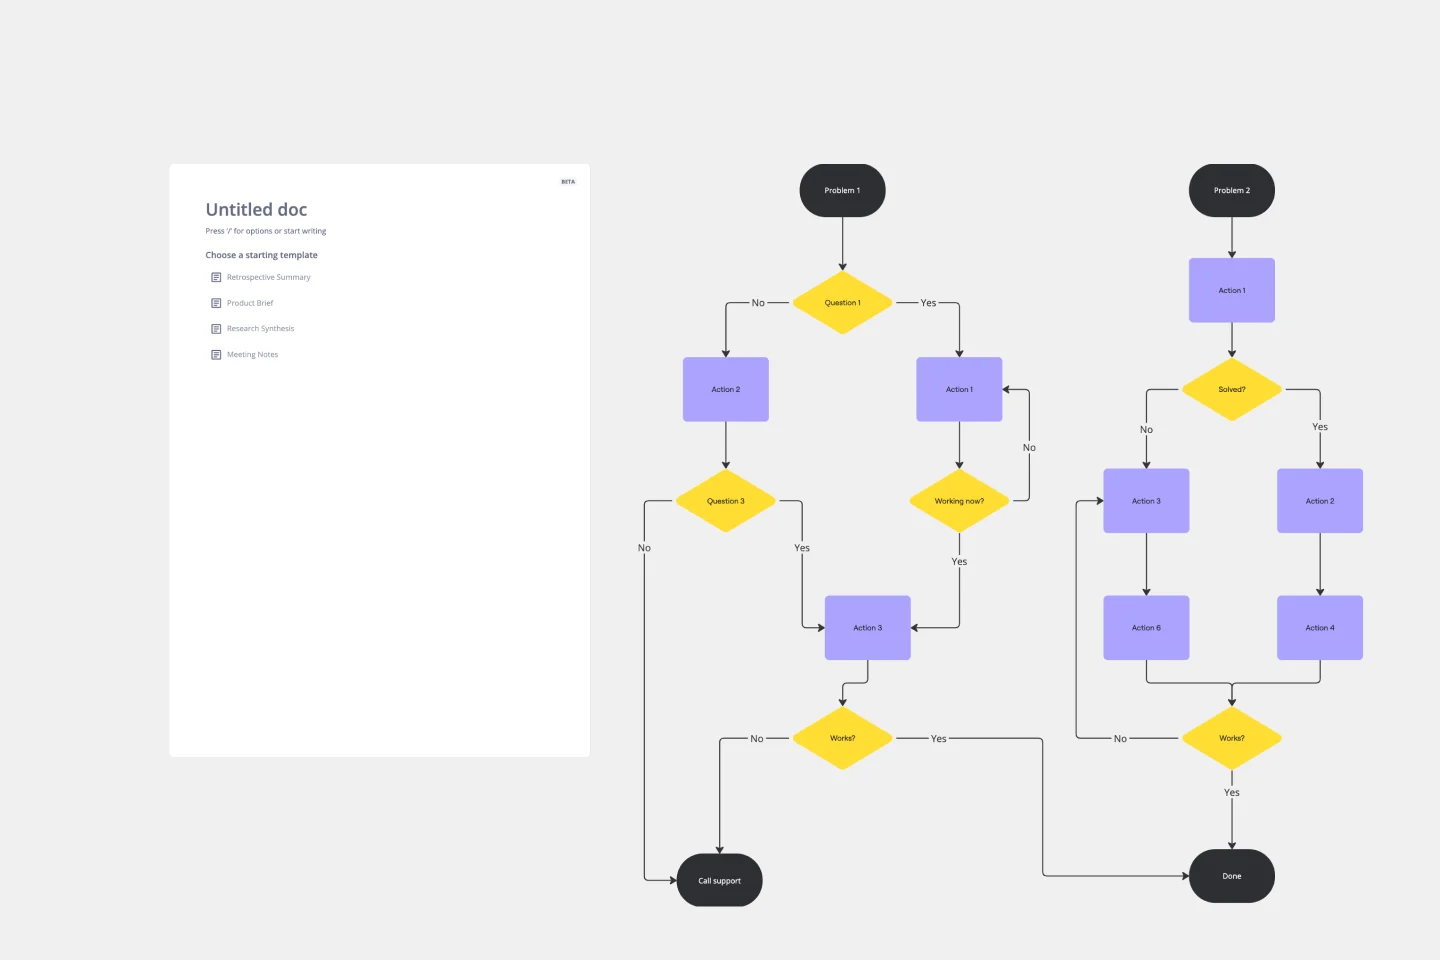
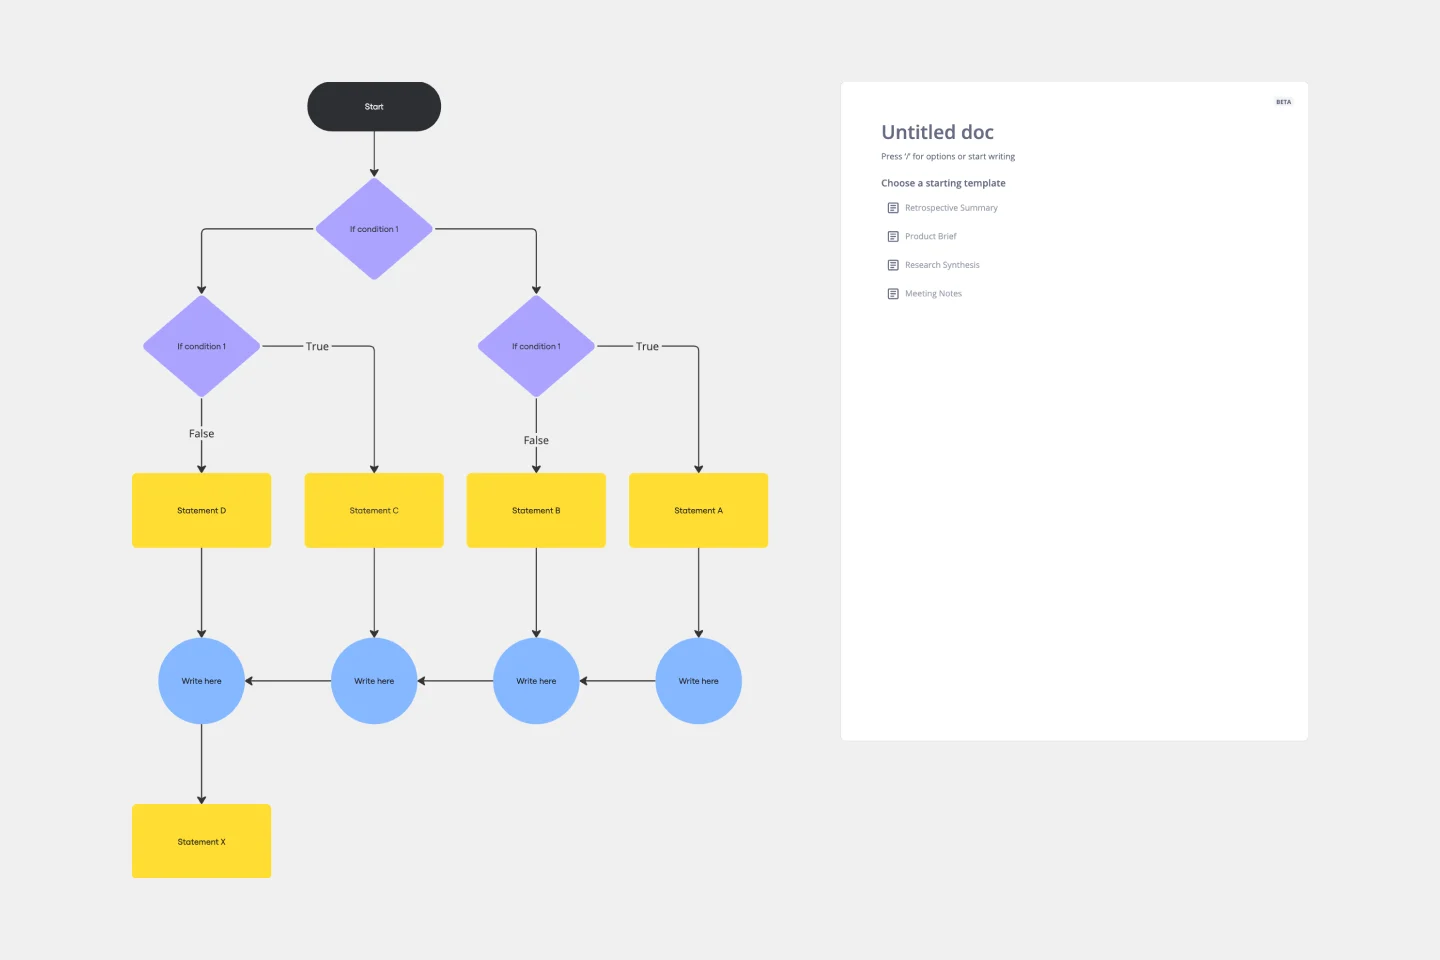
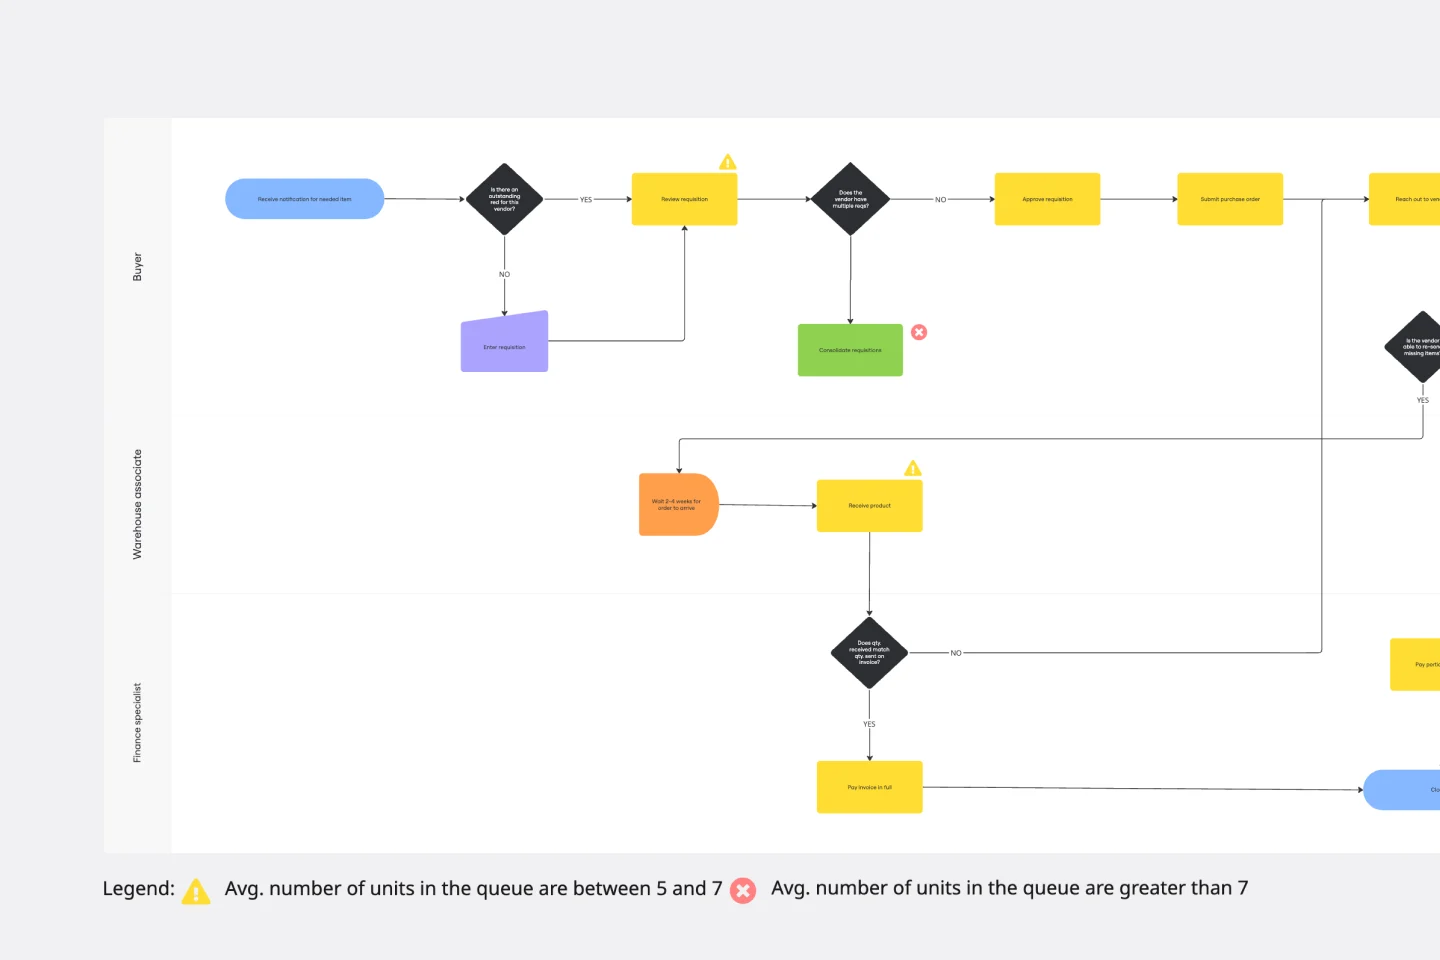
This template is divided into sections representing a project's various stages and decision points. Each stage signifies a key phase in the project, such as ideation, planning, execution, and review. The decision points, positioned between stages, serve as checkpoints where progress is evaluated, and a decision is made to either continue, change, or stop the project. Using this template, you can systematically track progress, identify potential issues early on, and ensure that each project phase aligns with the objectives.
How to use the Stage-Gate Process Flowchart Template in Miro
Customize the template: Easily edit the template with just a few clicks. Change the stage names and descriptions to suit the project's specific needs.
Expand with diagramming tools: Use Miro's automated diagramming features to add more shapes and connector lines, enriching the flowchart with additional details and complexities as needed.
Integrate artifacts: Enhance the flowchart by adding any relevant artifacts directly onto the Miro board. This could include documents, images, or links, providing context and information at each stage.
Collaborate and share: Invite team members to view, edit, and comment on the flowchart, fostering a collaborative environment where everyone stays informed and aligned.
Why should you use a Stage-Gate Process Flowchart Template?
Improved project clarity: Clearly define each project stage, ensuring team members understand their roles and responsibilities at every phase.
Informed decision-making: The gate checkpoints facilitate informed decisions based on thorough project progress and feasibility evaluations.
Risk mitigation: Early identification and management of potential risks and issues, reducing the likelihood of project delays or failures.
Efficient resource allocation: Allows for the best distribution and utilization of resources throughout the project lifecycle.
Facilitates communication: Provides a visual representation of the project plan, improving Communication and understanding among stakeholders.
Can the template be customized for different project types?
Yes, the template is highly adaptable and can be tailored to fit a wide range of project types and industries.
How does the template assist in risk management?
The template allows for regular assessments at each gate, enabling teams to identify and address risks early in the project lifecycle.
Get started with this template right now.
Logic Model Template
Works best for:
Diagramming
The logic model template is a strategic visual tool designed to delineate the relationship between a program's inputs, activities, outputs, and outcomes. By providing a clear and comprehensive map of the project lifecycle, stakeholders can swiftly grasp the intricate connections within a given initiative. One standout benefit of this template is its ability to enhance clarity: by visually representing the transformation of resources into anticipated results, teams can ensure more efficient and targeted use of their resources, thus maximizing the potential for success in their endeavors.
Insightful Venn
Works best for:
Venn Diagram
Discover insights and visualize data relationships with the Insightful Venn template. This tool helps you compare multiple datasets, identify intersections, and understand unique and common elements. Use it for data analysis, research, and presentations to communicate complex information effectively. Perfect for analysts, educators, and researchers aiming to convey data-driven insights visually.
Workflow Diagram Template
Works best for:
Diagramming, Mapping, Process mapping
The Workflow Diagram Template maps out and represents processes or systems using standardized symbols and shapes. By delineating the various steps or stages in a process, it ensures that tasks flow seamlessly from initiation to completion. One of the standout benefits of using this template is its clarity. By translating processes into a visual format, all participants can gain a comprehensive understanding at a glance, eliminating confusion and ensuring everyone is on the same page. This clarity not only promotes efficient task execution but also fosters collaboration among team members.
ERD Blogging System Template
Works best for:
ERD
The ERD Blogging System template in Miro efficiently manages and organizes digital content. It features key entities such as User, Post, Comment, Category, Tag, and File, which are essential for managing the creation and publication of blog posts, engaging users through comments, and organizing content via categories and tags. Additionally, it supports media attachments through the File entity, linking them to the relevant content. This template helps streamline the blogging process, making it an invaluable tool for content management and publication.
Azure Demand Forecasting Template
Works best for:
Software Development, Diagrams
The Azure Demand Forecasting diagram will show the architecture of a demand forecast, making it easier for you to predict data consumption, costs, and forecast results. Azure is Microsoft’s cloud computing platform, designed to provide cloud-based services such as remote storage, database hosting, and centralized account management. Azure also offers new capabilities like AI and the Internet of Things (IoT).
Intent to Outcome Diagram
Works best for:
Diagramming
The Intent to Outcome Diagram template is a visual tool for mapping out the relationship between desired outcomes and the actions required to achieve them. It provides a structured framework for defining intentions, outcomes, and key activities. This template enables teams to align on goals, track progress, and identify areas for improvement. By promoting clarity and alignment, the Intent to Outcome Diagram empowers organizations to set strategic direction and drive results effectively.