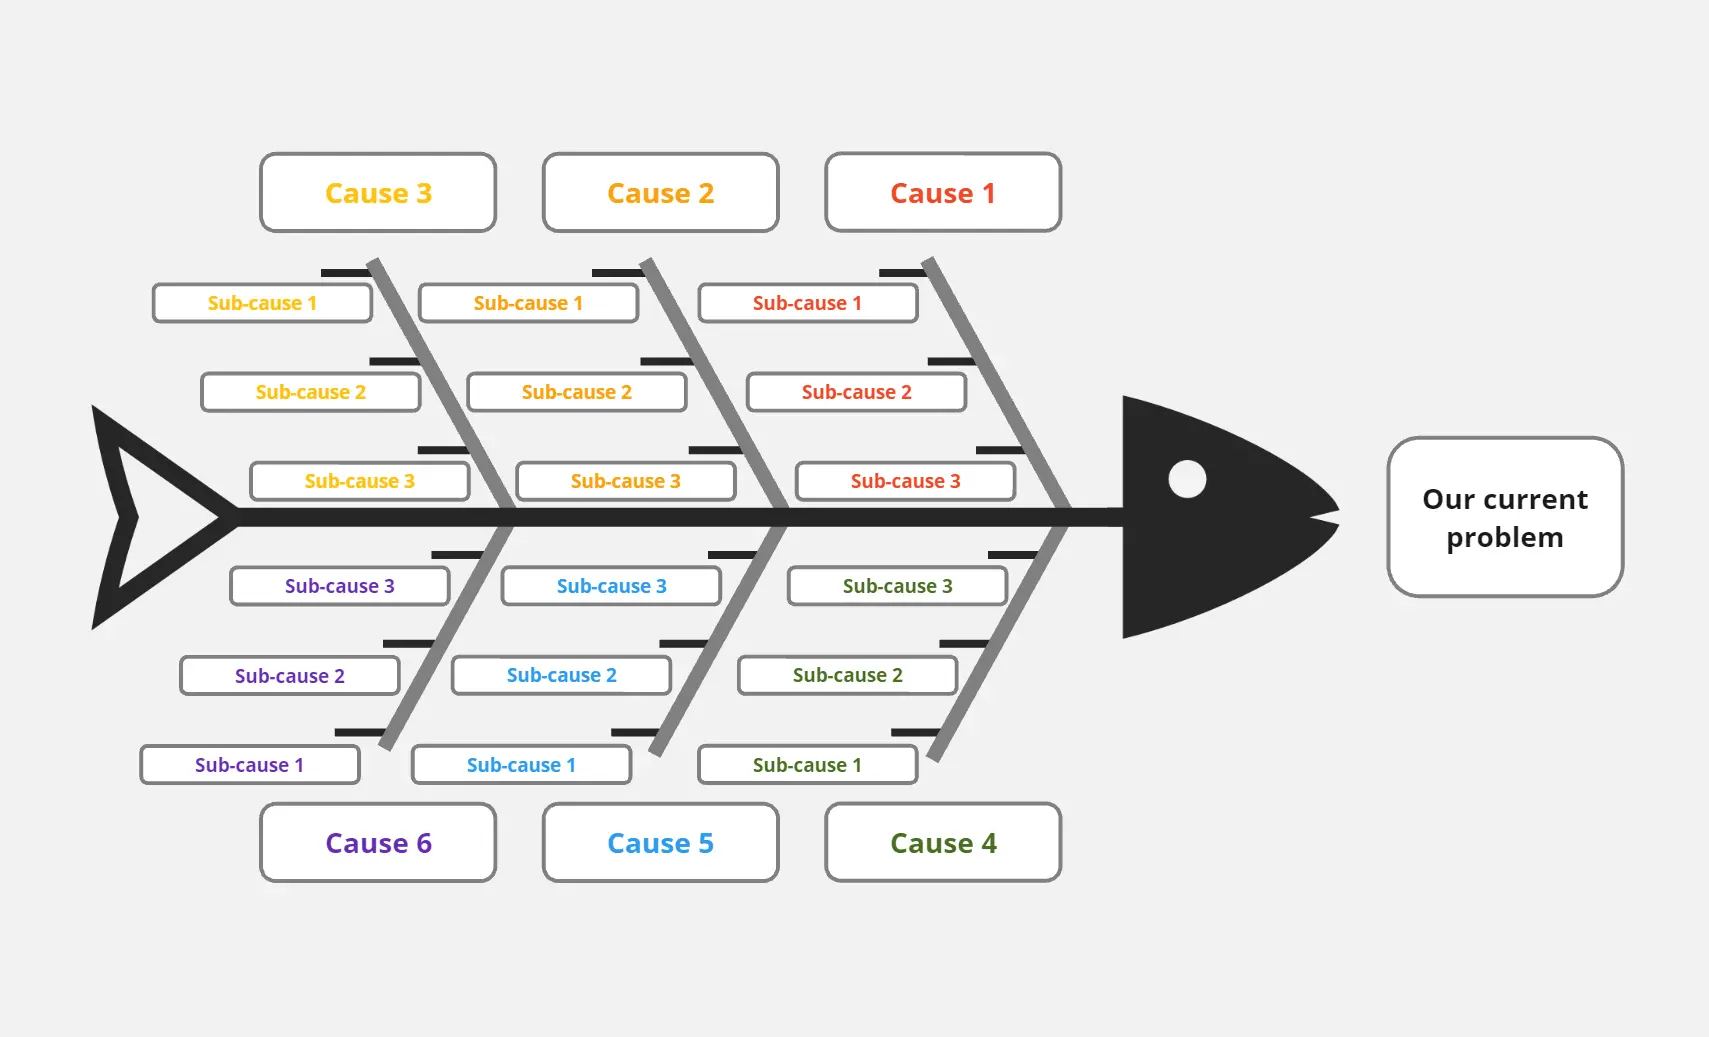
The Six Sigma Fishbone Diagram (also known as the Ishikawa or Cause-and-Effect Diagram) is a premier visual tool used by Lean Six Sigma practitioners to identify, explore, and display all possible causes of a specific problem. By systematically mapping out the relationship between an effect and its potential causes, teams can move beyond symptoms to find the true root cause.
What Problem Does the Six Sigma Fishbone Diagram Solve?
In complex environments, solving the wrong problem is a common and costly mistake. This template eliminates that risk by providing:
Elimination of Surface-Level Thinking: It forces teams to look past the obvious and uncover "hidden" variables in the process.
Structured Brainstorming: Instead of chaotic discussions, it categorizes ideas into the 6Ms framework (Manpower, Method, Machine, Material, Measurement, Mother Nature).
Data-Driven Focus: It helps prioritize which "bones" of the diagram require statistical validation (using tools like Pareto Charts or Regression Analysis).
Cross-Functional Alignment: It visualizes how different departments (from Engineering to HR) intersect to create a specific outcome.
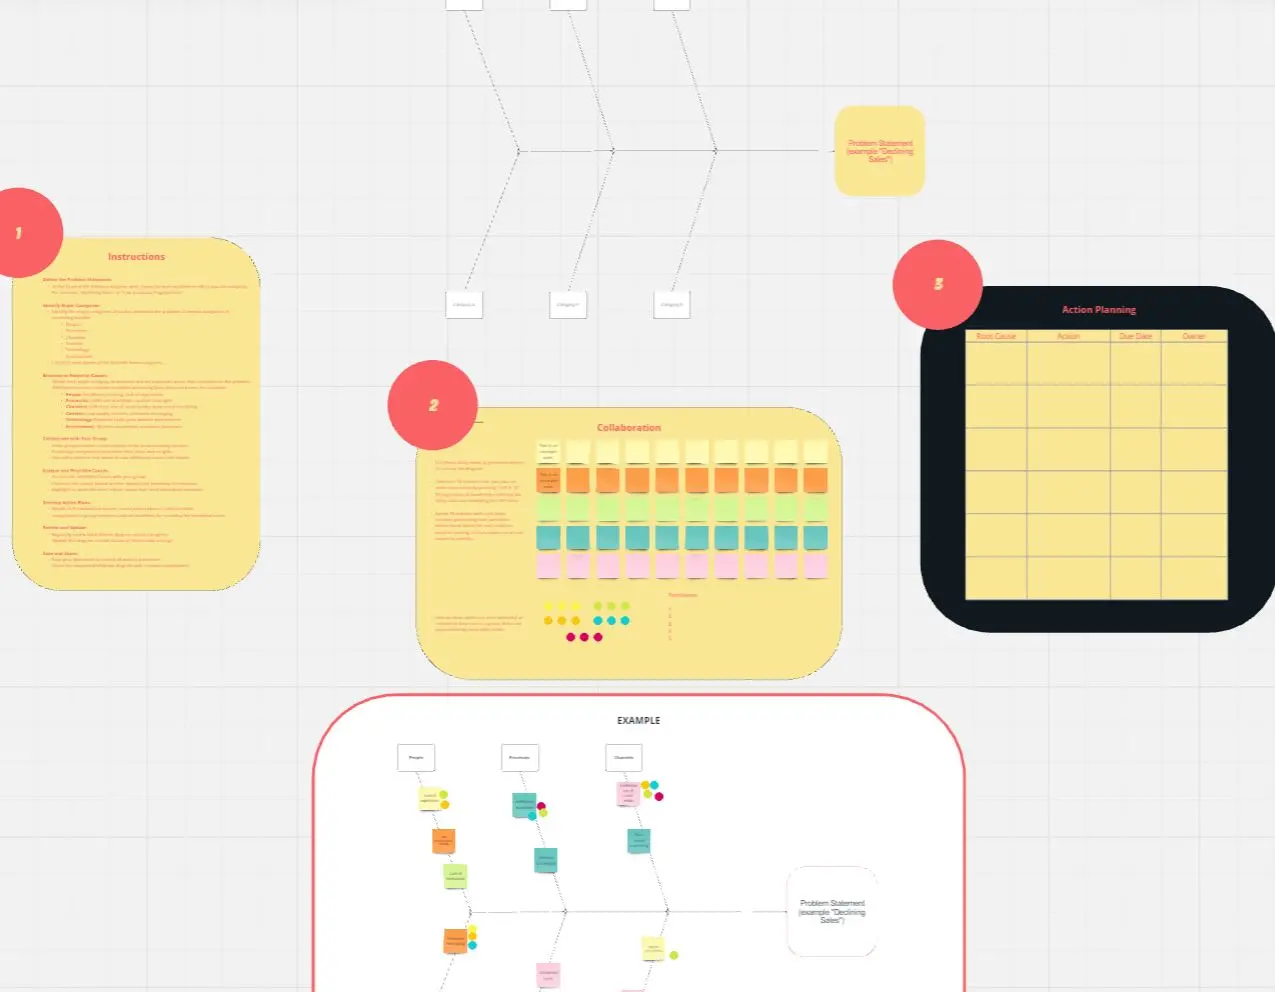
How to Use the Six Sigma Fishbone Template (The 6Ms Framework)
To conduct a professional-grade Six Sigma analysis, follow these steps:
Define the Problem (The Head): State the "Effect" clearly. Example: "15% increase in defect rate during Q3 assembly."
Categorize the Main Bones: Use the standard 6M categories to ensure 360-degree coverage:
Manpower: Skills, training, fatigue, or staffing levels.
Methods: Process steps, rules, or outdated SOPs.
Machines: Tools, software, maintenance, or hardware capacity.
Materials: Raw inputs, data quality, or supplier variations.
Measurement: Calibration, data accuracy, or biased metrics.
Mother Nature (Environment): Temperature, humidity, noise, or workspace layout.
Deep Dive with "5 Whys": For every cause added to a bone, ask "Why?" until you reach a point where an actionable solution can be implemented.
Frequently Asked Questions (FAQ)
Is the Fishbone Diagram only for manufacturing?
No. While it originated in manufacturing, it is widely used in Service Six Sigma, Healthcare, and Tech (DevOps) to analyze service delays, software bugs, or customer churn.
What is the difference between a Fishbone and a 5 Whys analysis?
The Fishbone Diagram is a breadth tool (identifying many potential causes), while the 5 Whys is a depth tool (drilling down into one specific cause). In Six Sigma, they are most effective when used together.
When should I move from the Fishbone to a Pareto Chart?
Once your Fishbone is complete, use team voting or historical data to identify the "vital few" causes. A Pareto Chart will then help you focus your improvement efforts on the 20% of causes creating 80% of the problems.