About the Six Sigma templates collection
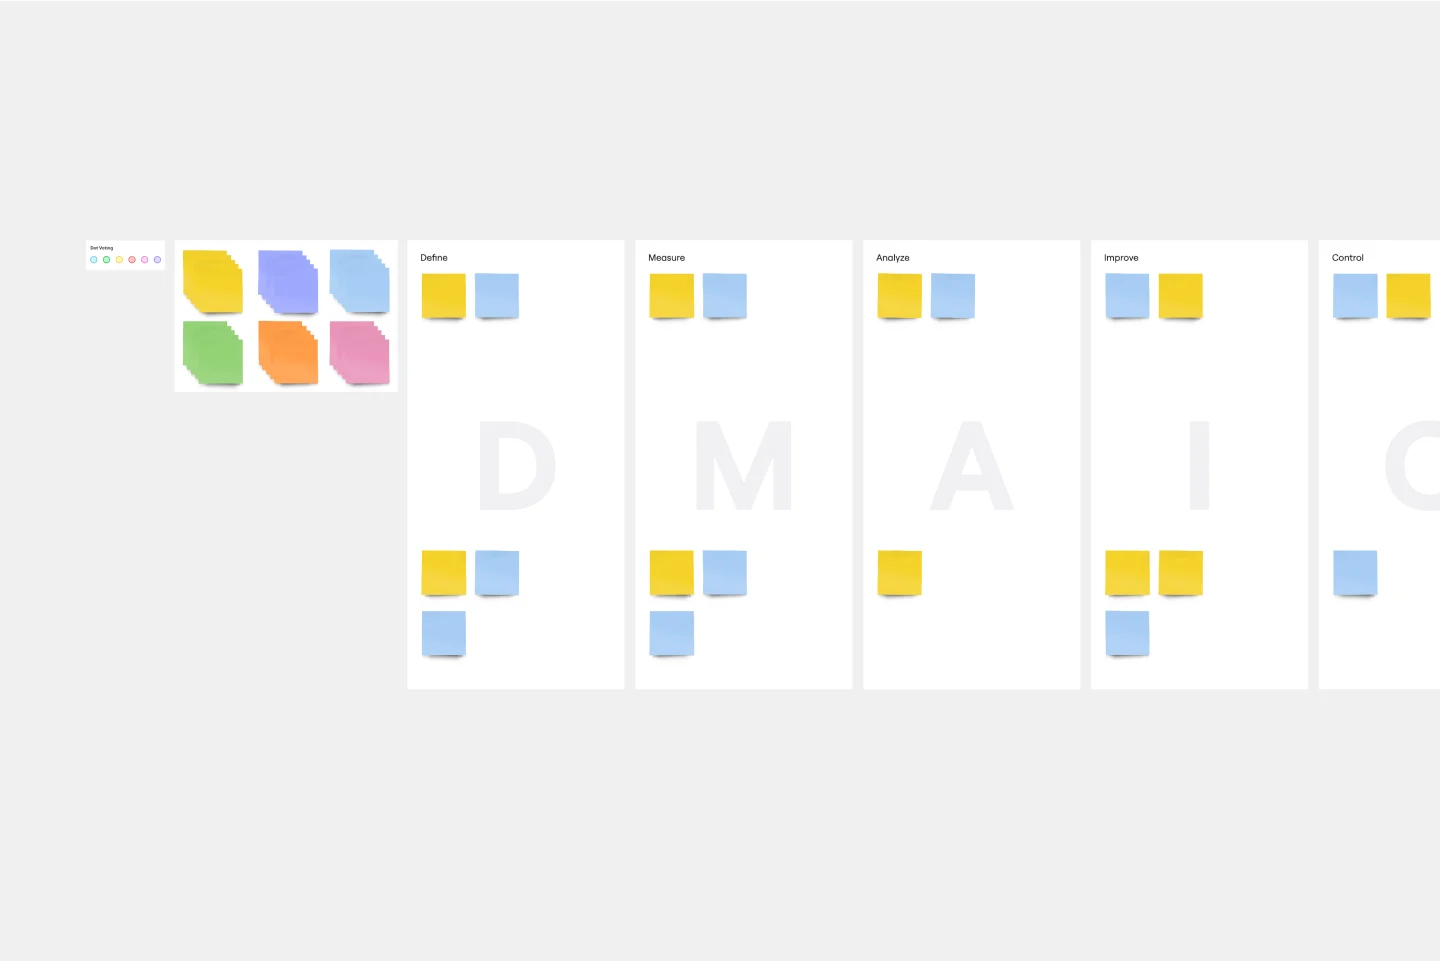
A Six Sigma template is a structured toolkit used to improve business processes by identifying and removing the causes of errors. Built around the DMAIC (Define, Measure, Analyze, Improve, Control) roadmap, these templates provide the mathematical and visual rigor needed to achieve "Six Sigma" quality which technically means a process produces fewer than 3.4 defects per million opportunities.
Key Components of a Six Sigma Template
A professional Six Sigma template is built on statistical evidence. Every high-performance Miro board should include these five elements:
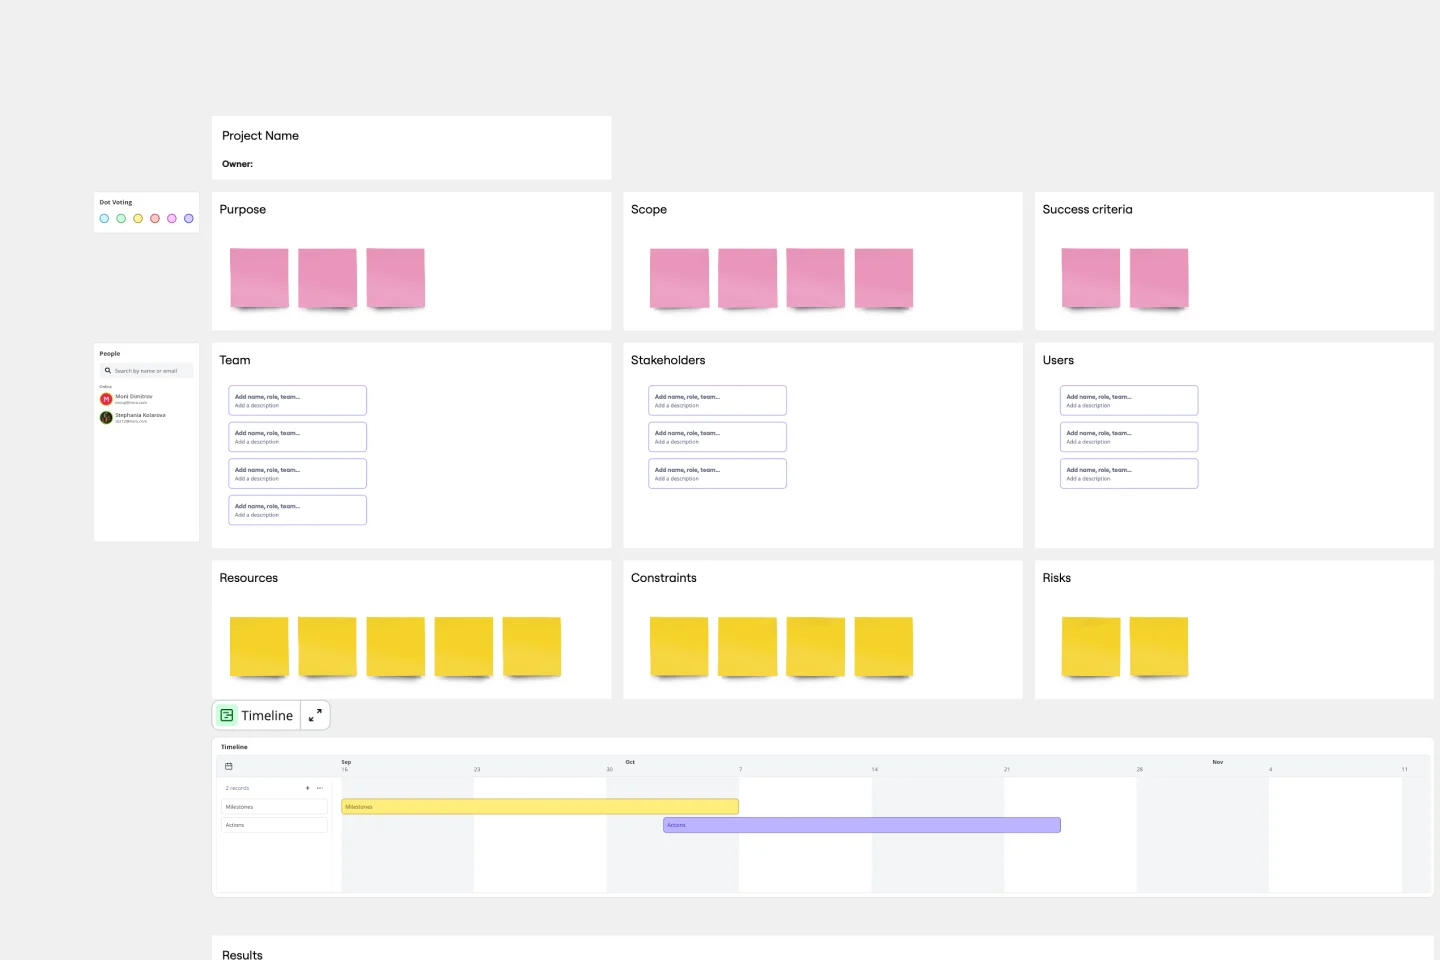
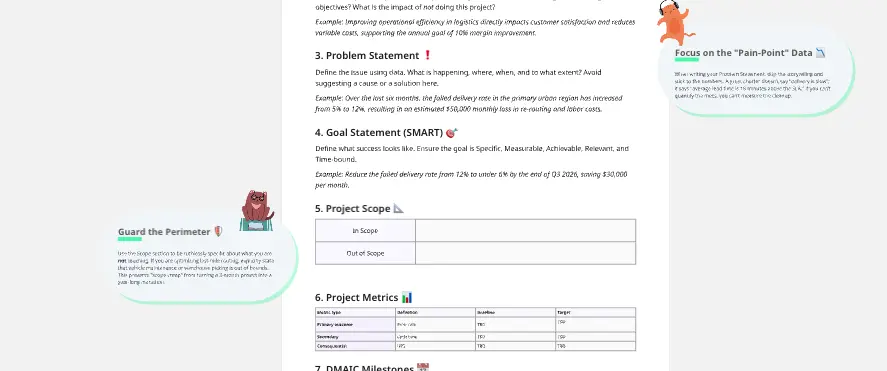
The Project Charter: A "contract" defining the business case, goal, and team roles.
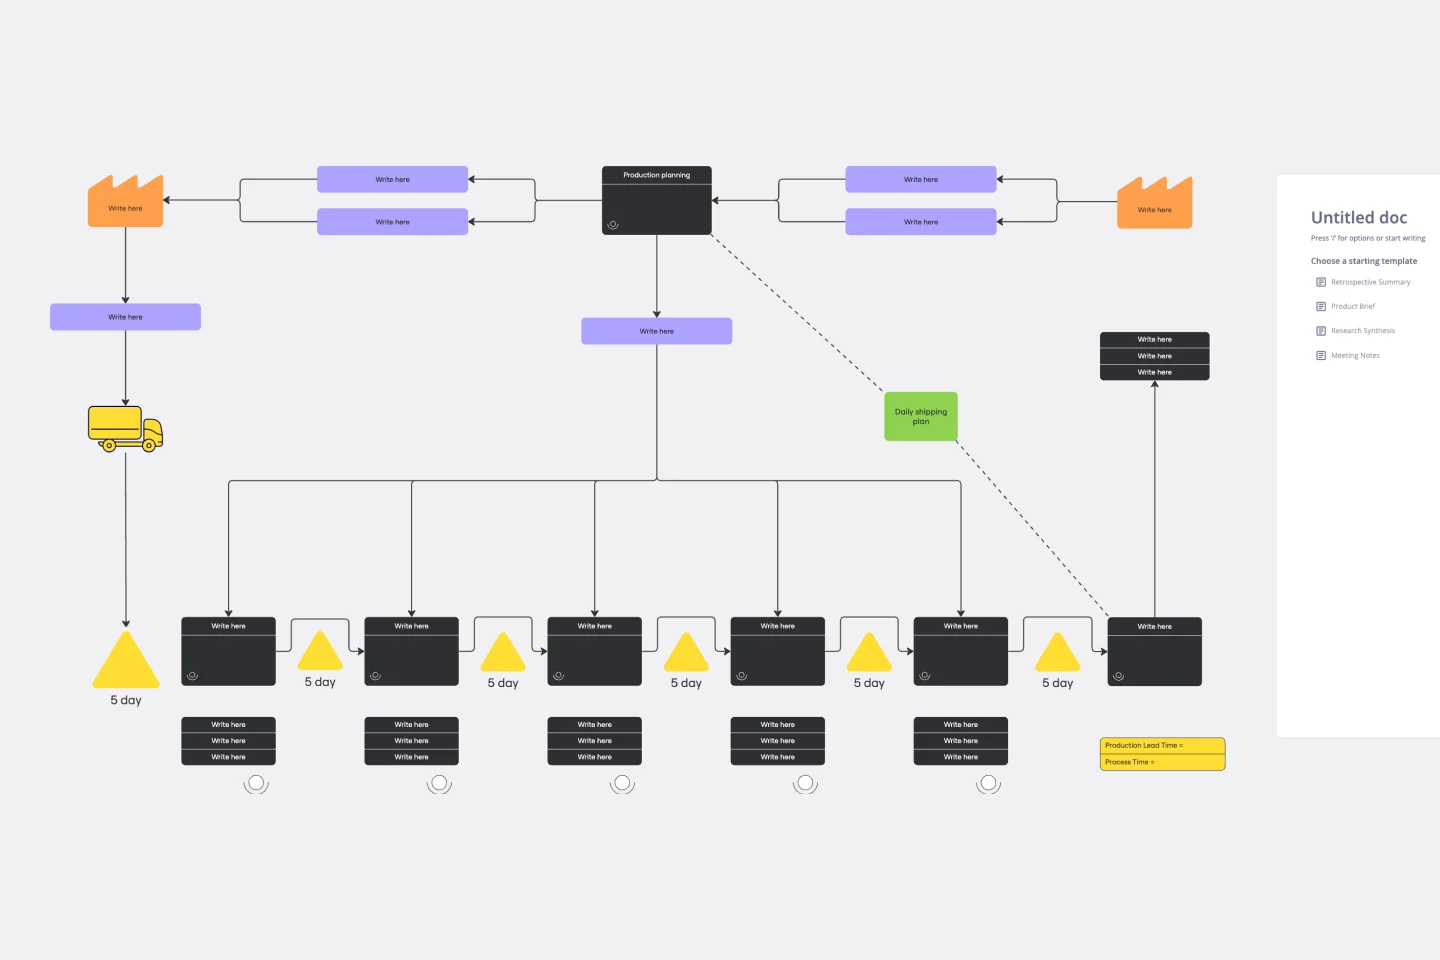
Process Maps: Detailed "As-Is" flows to identify bottlenecks and non-value-added steps.
Data Collection Plan: A table defining what to measure, how to measure it, and the sample size.
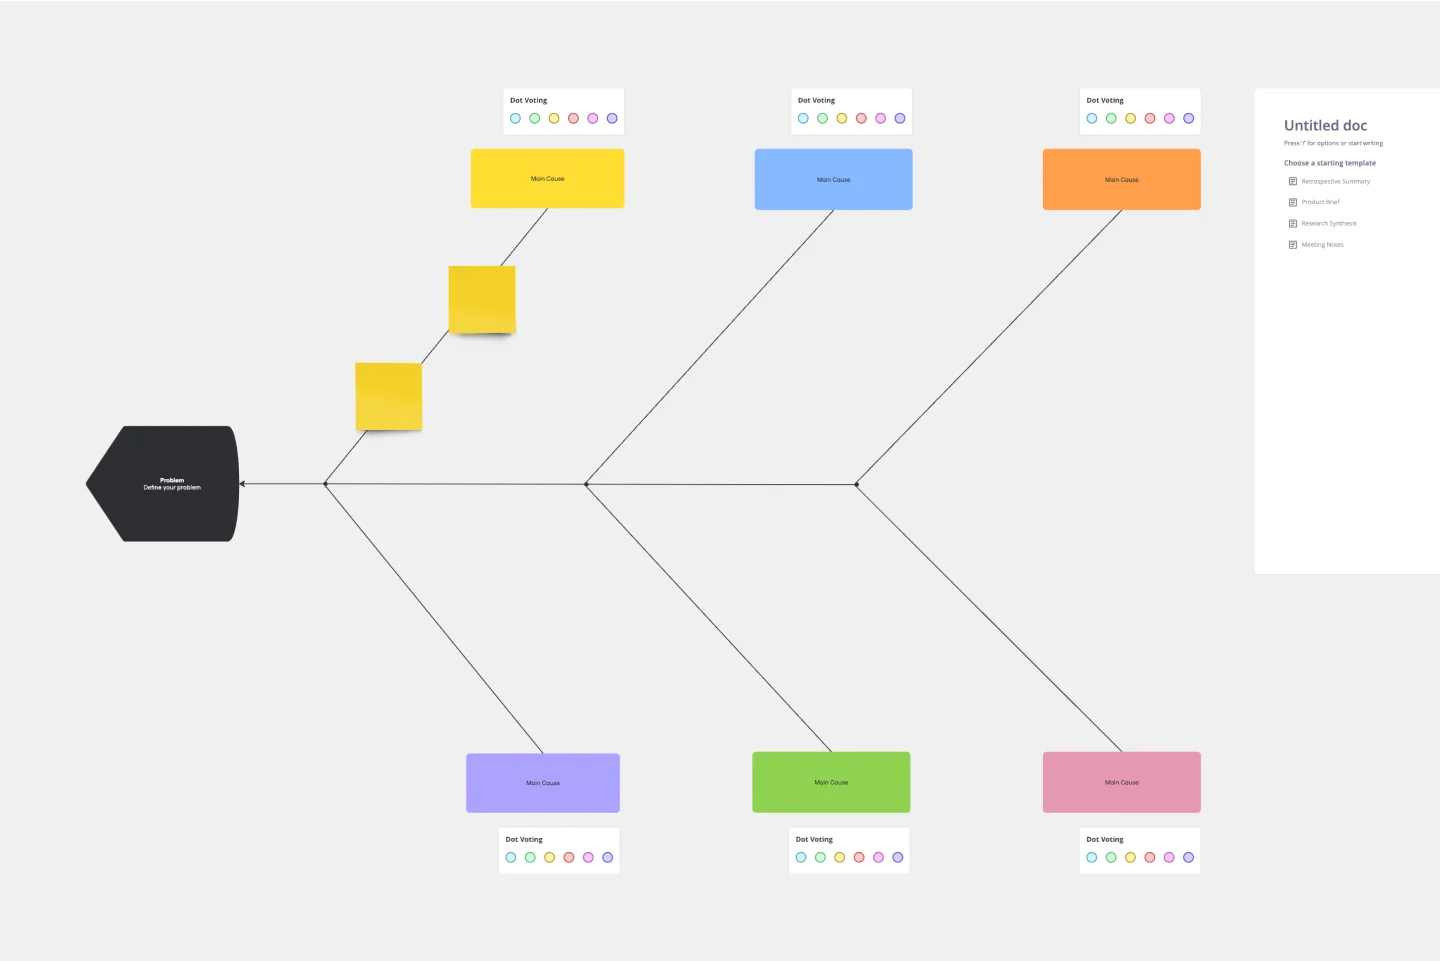
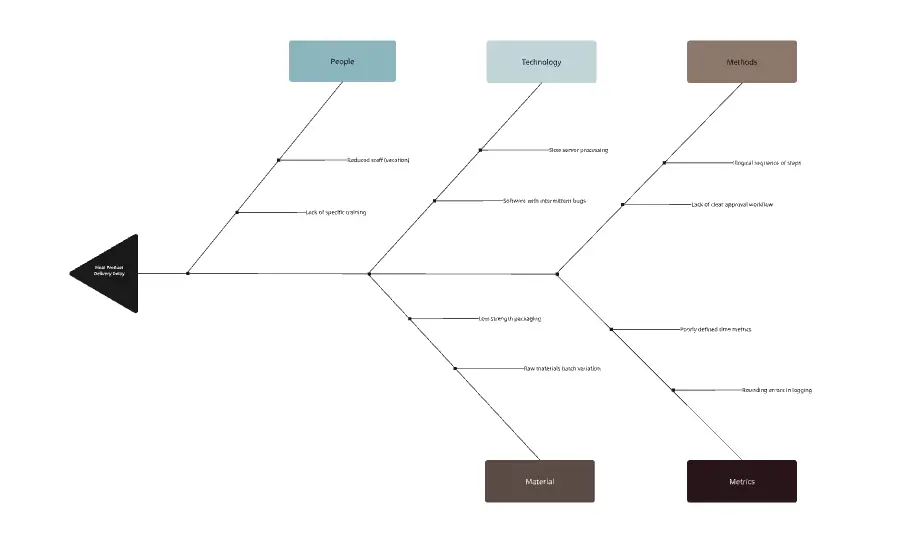
Cause-and-Effect (Fishbone) Diagram: A visual tool to brainstorm potential root causes across Man, Machine, and Method.
Sigma Level Calculator: A space to record DPMO (Defects Per Million Opportunities) and convert it to a Sigma Score.
Which Six Sigma Template Do You Need?
Select the Miro template that matches your current phase of the DMAIC journey:
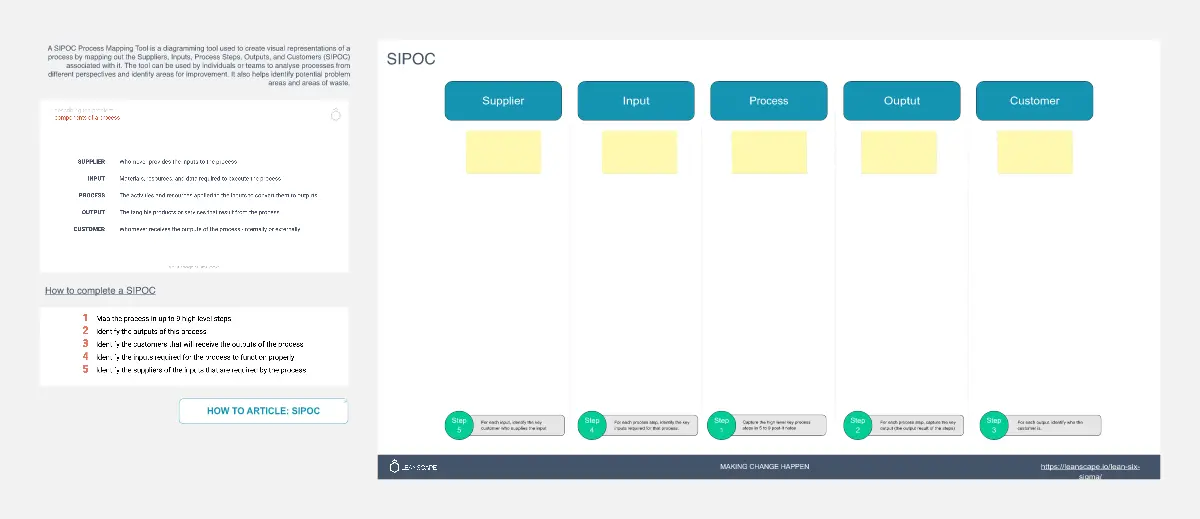
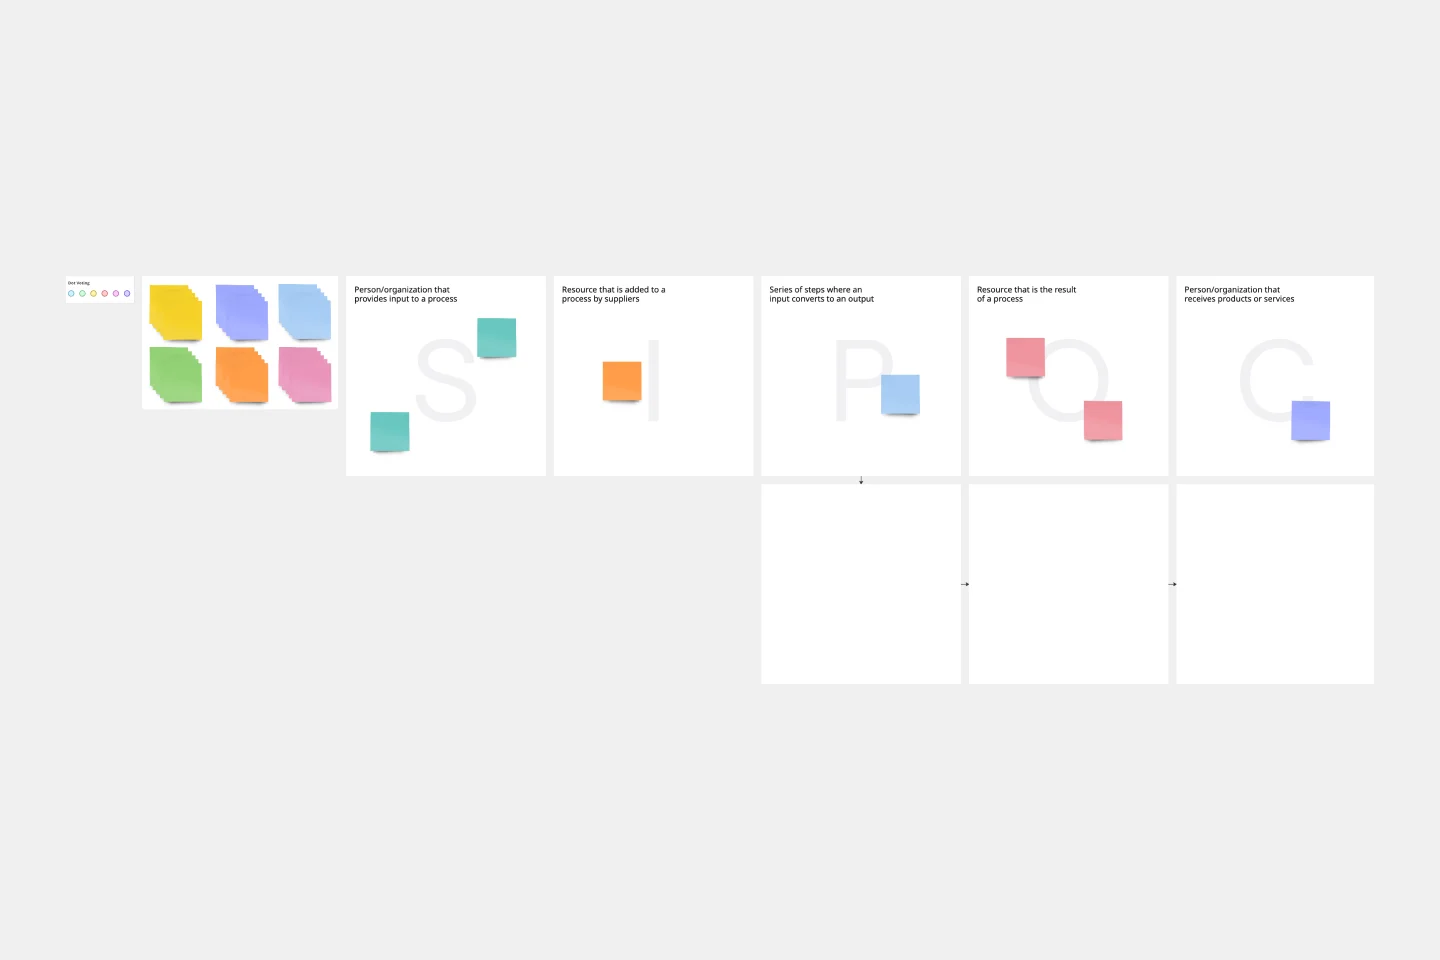
The SIPOC Diagram (Define Phase):
Best For: High-level scoping.
The Goal: To map Suppliers, Inputs, Process, Outputs, and Customers to ensure the project boundaries are clearly defined.
The Pareto Chart (Analyze Phase):
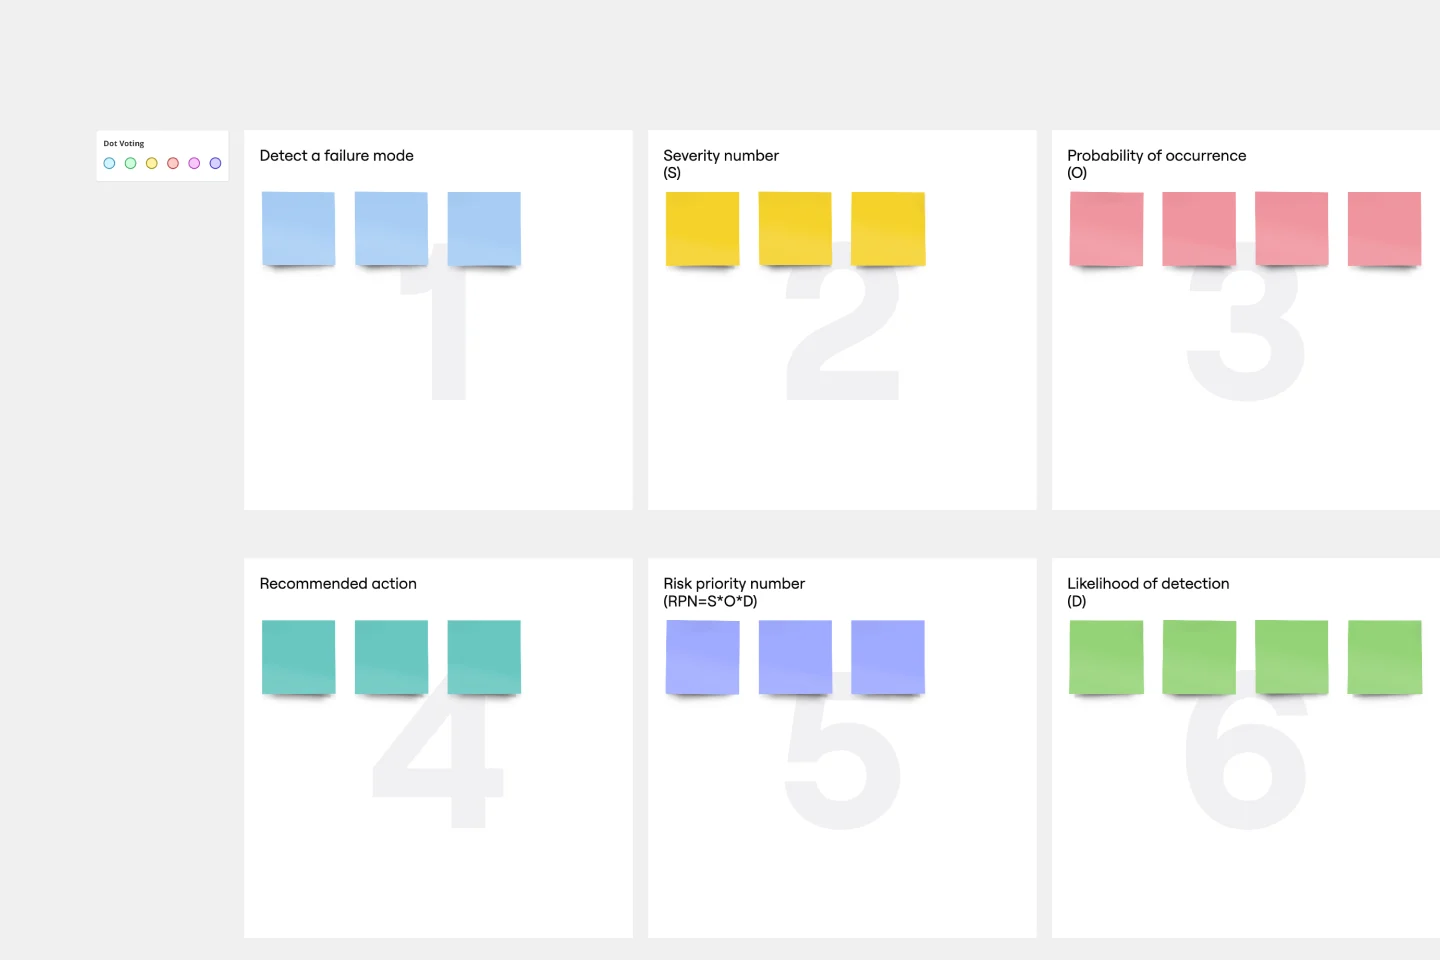
The FMEA (Improve Phase):
Best For: Risk prevention.
The Goal: To calculate a Risk Priority Number (RPN) for every potential failure mode, allowing the team to mitigate high-risk items before they happen.
The Control Plan (Control Phase):
Best For: Long-term sustainability.
The Goal: To define exactly who monitors the process, how often, and what the "Reaction Plan" is if the process goes out of spec.
How to use the Six Sigma templates in Miro
Select a template: Choose one template from the Six Sigma templates category. You can select templates like DMAIC, SIPOC, or Six Sigma root cause analysis templates.
Customize the template: Tailor the template to your specific project needs. Add or remove sections, adjust the layout, and input your data.
Collaborate with your team: Share the template with your team members. Use Miro’s real-time collaboration features to gather input, make edits, and discuss findings.
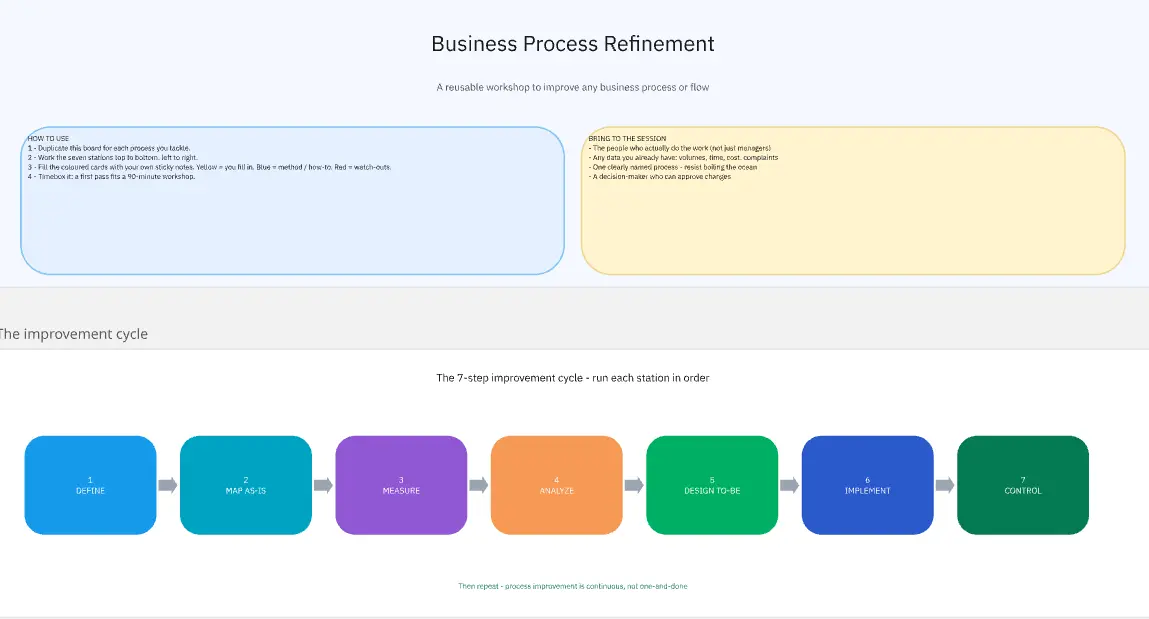
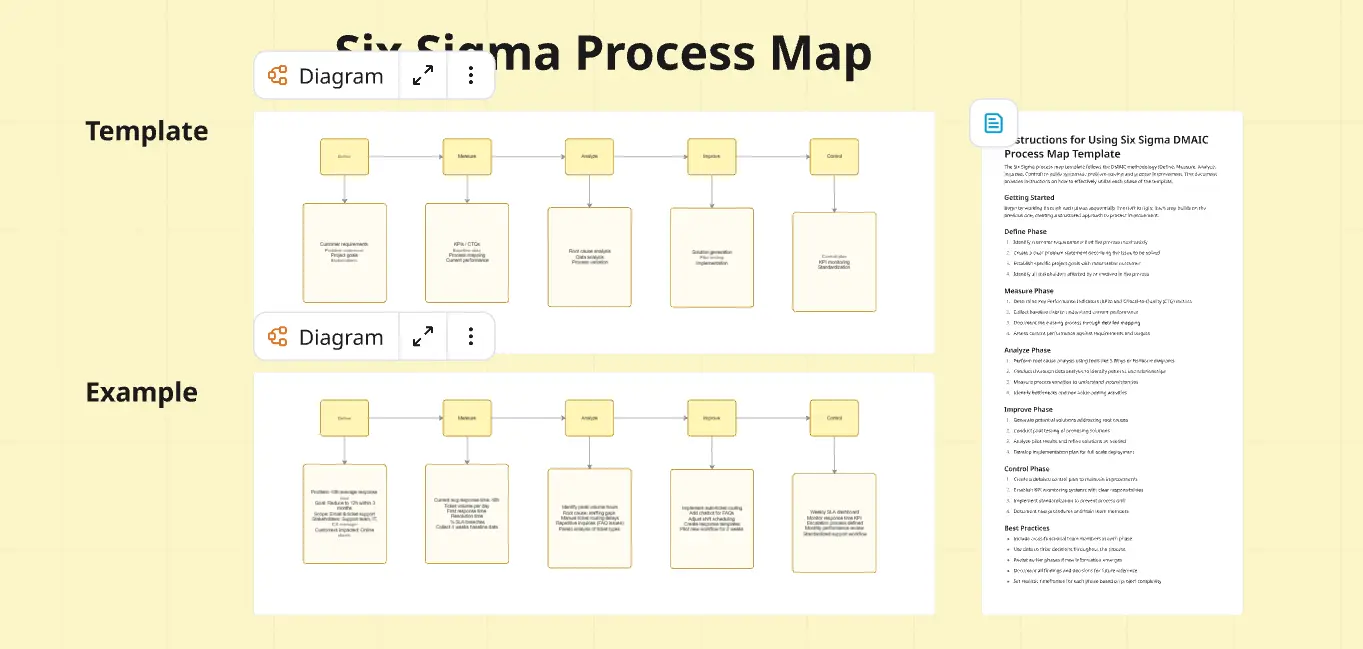
Analyze and improve: Use the template to conduct thorough analyses. For example, use the DMAIC template to define, measure, analyze, improve, and control your processes.
Document and share results: Once your analysis is complete, document and share your findings with stakeholders. Use Miro’s export features to create reports or presentations.