20 likes
132 uses
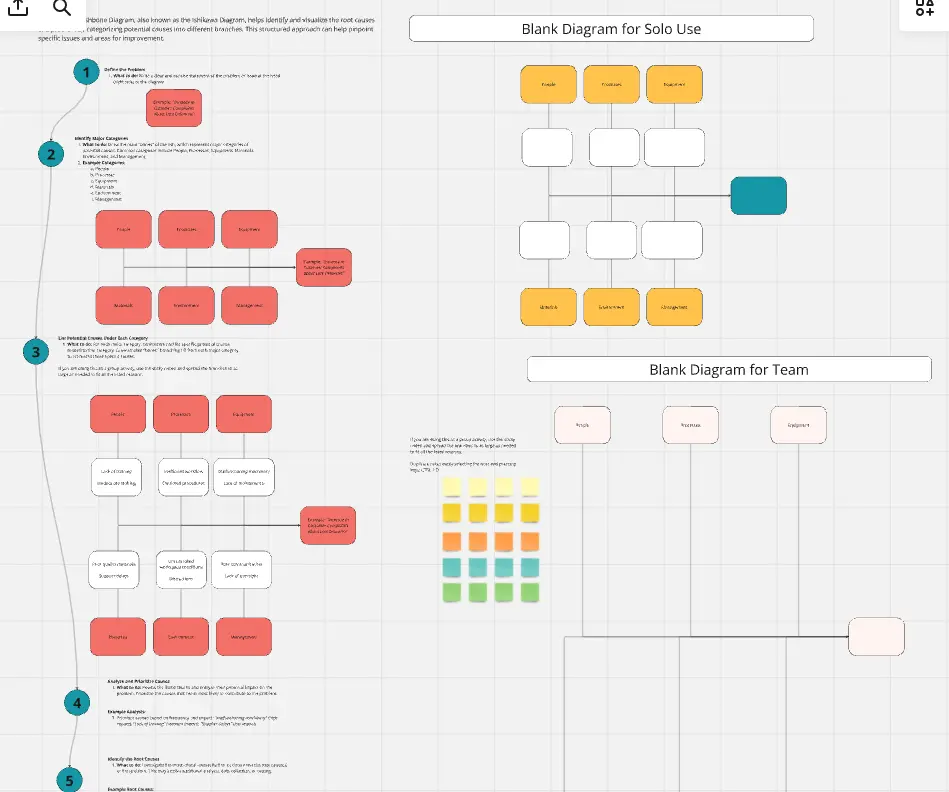
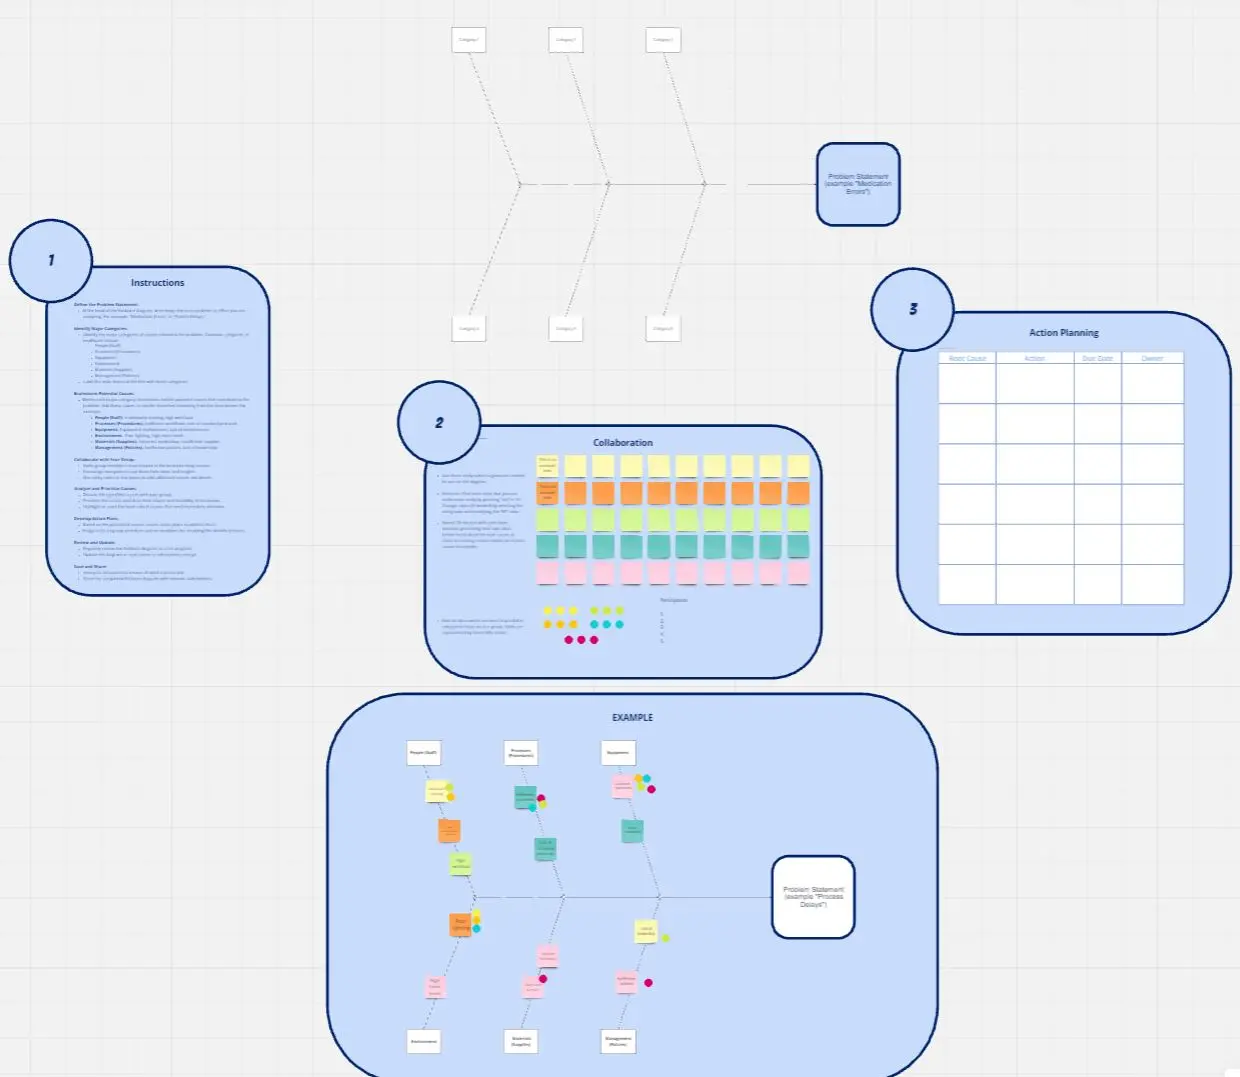
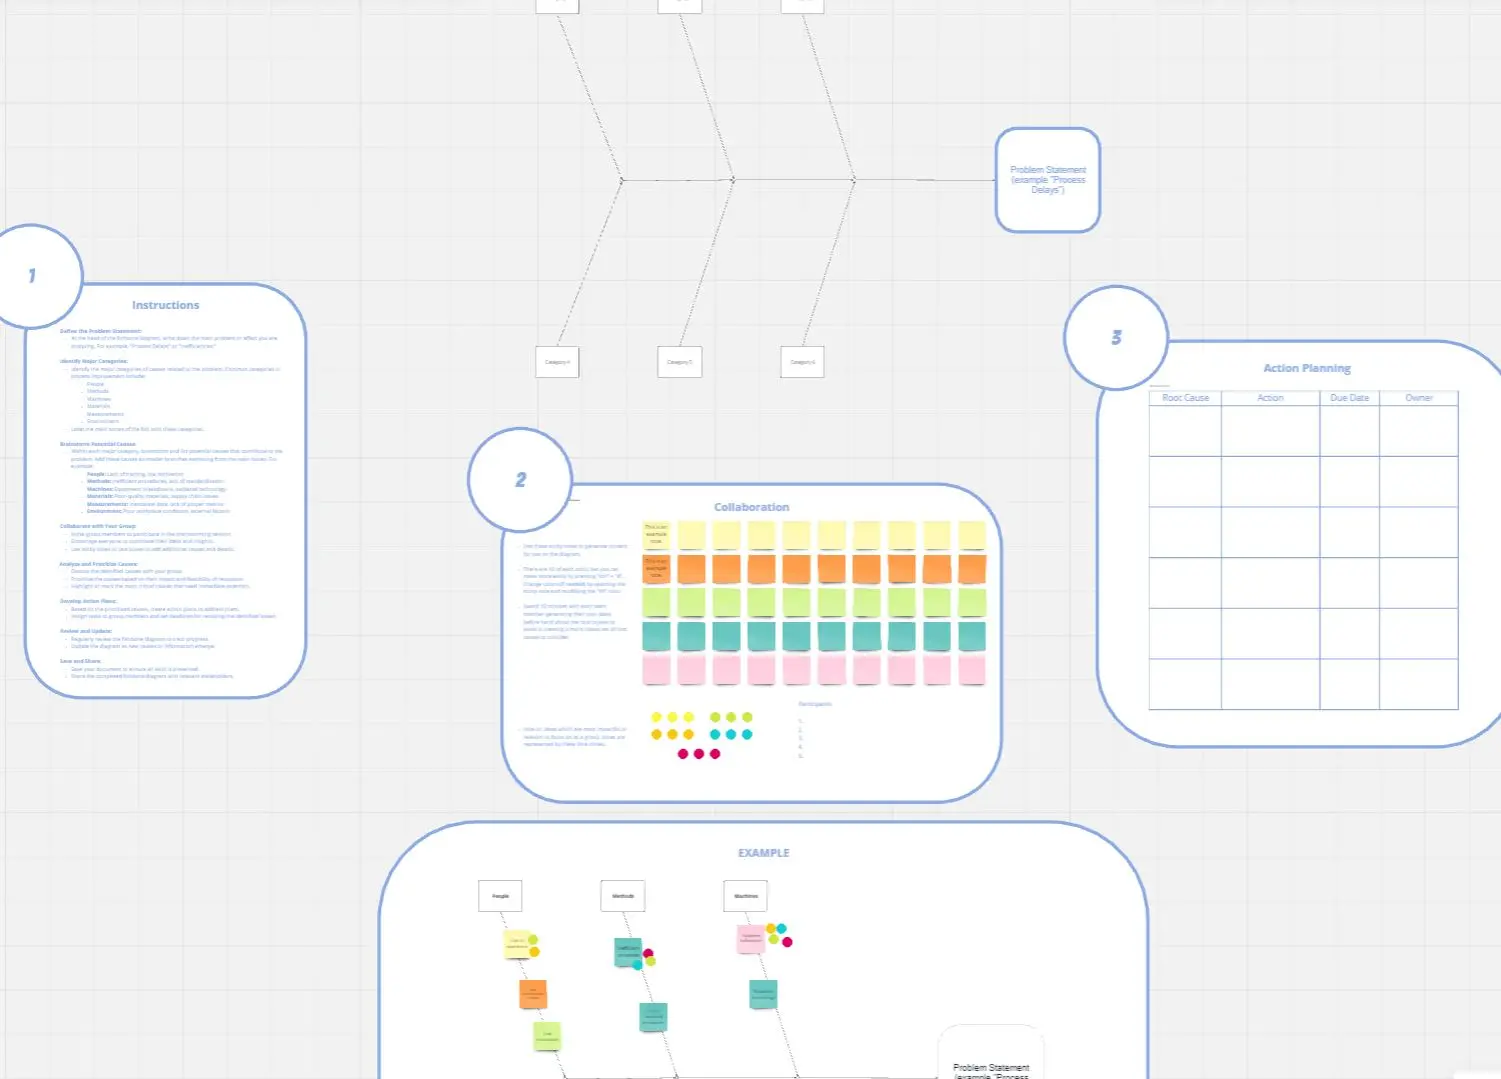
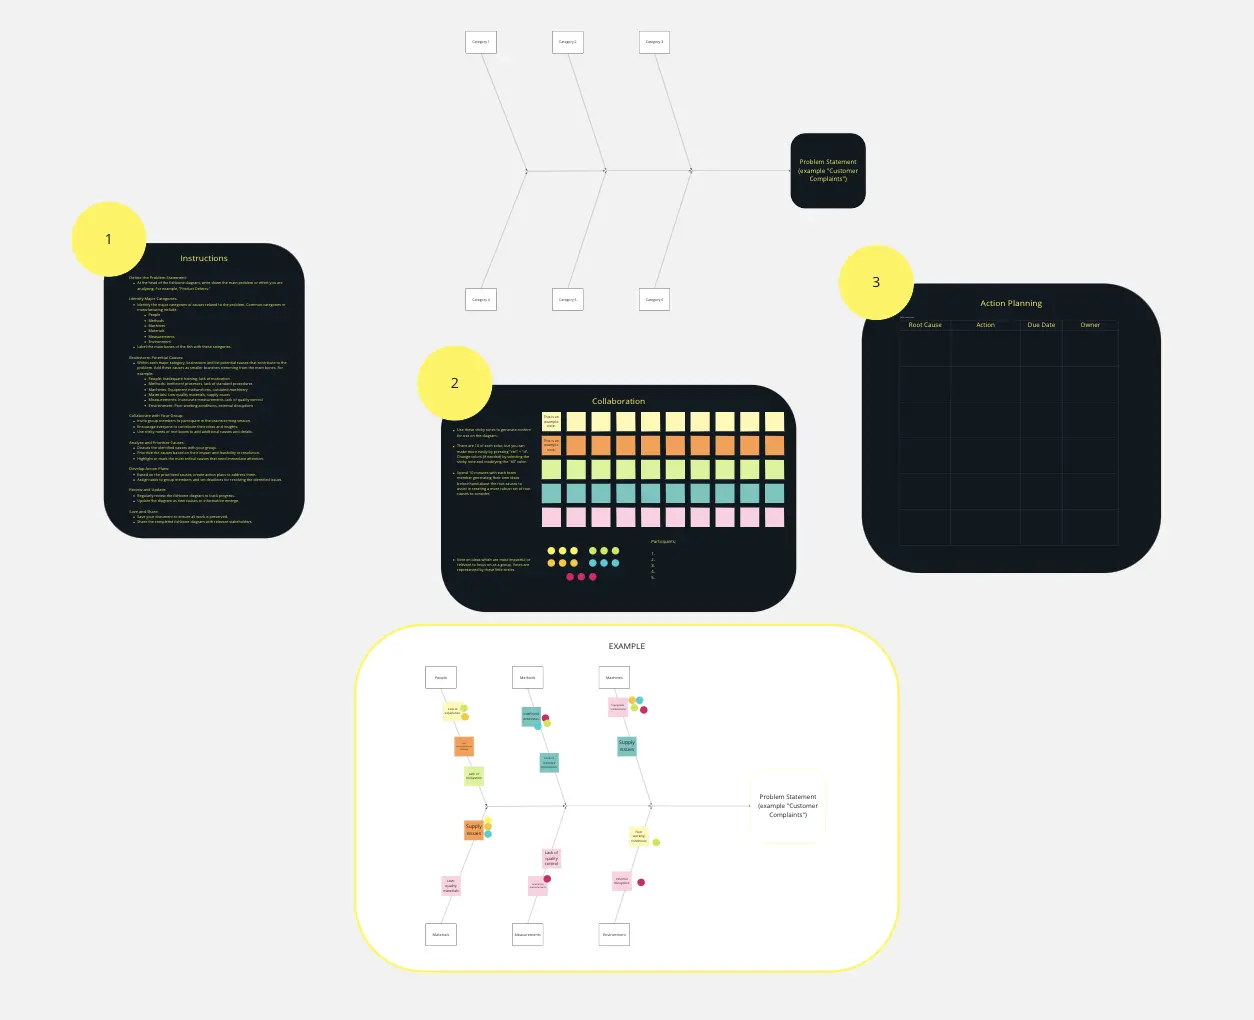
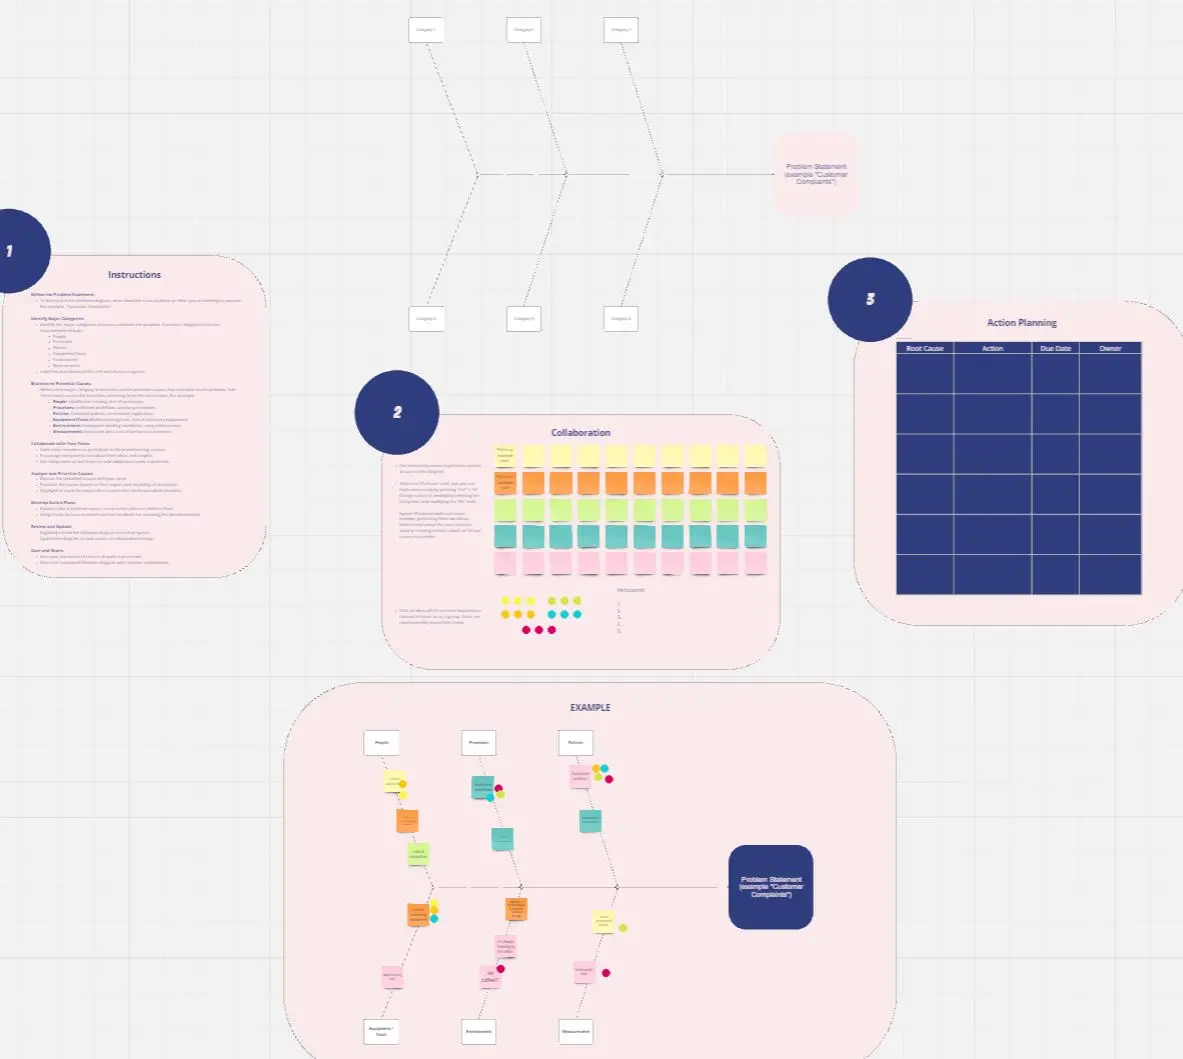
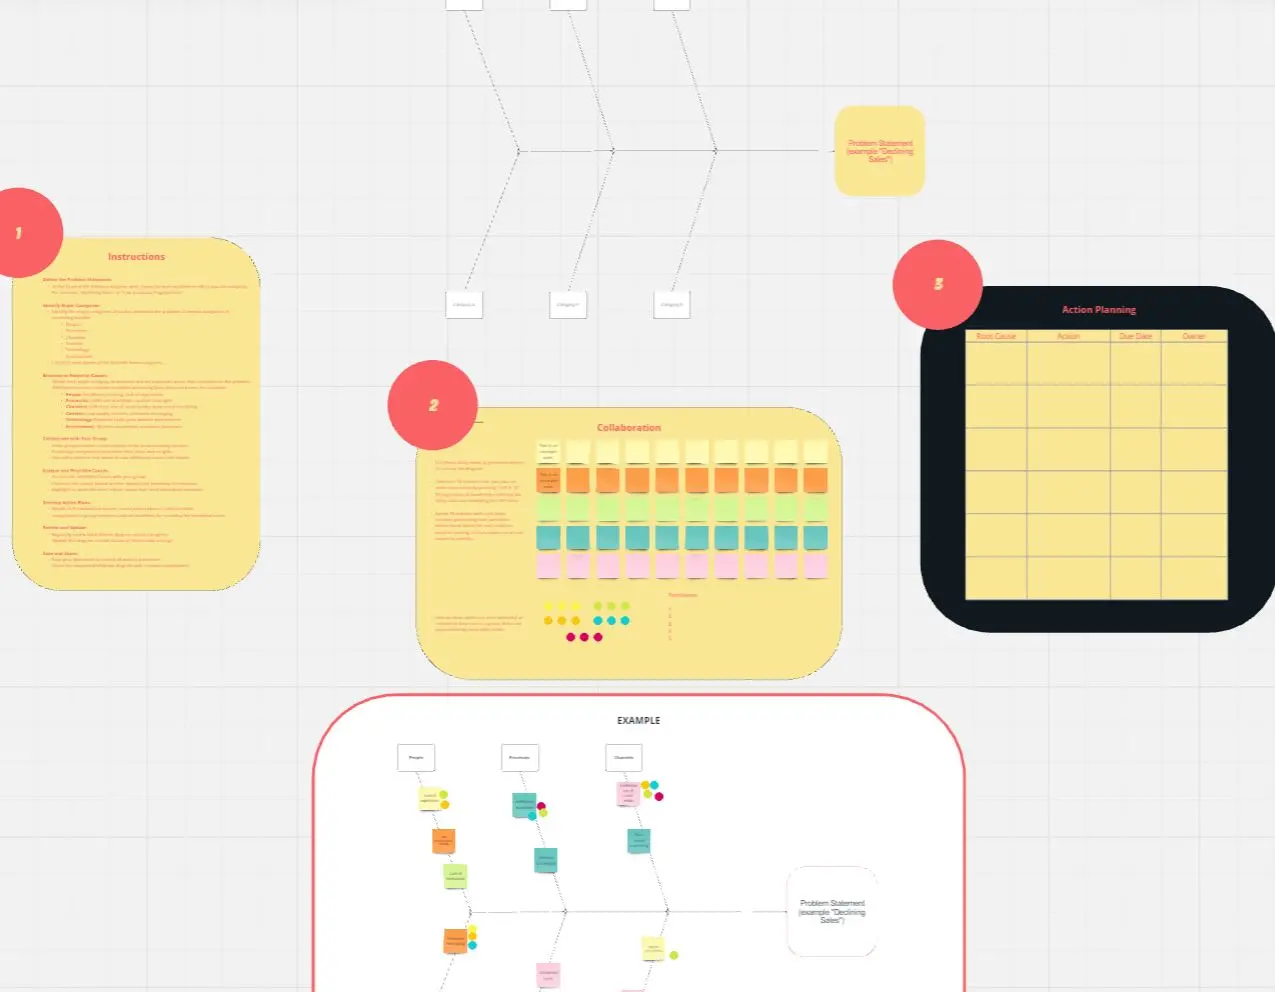
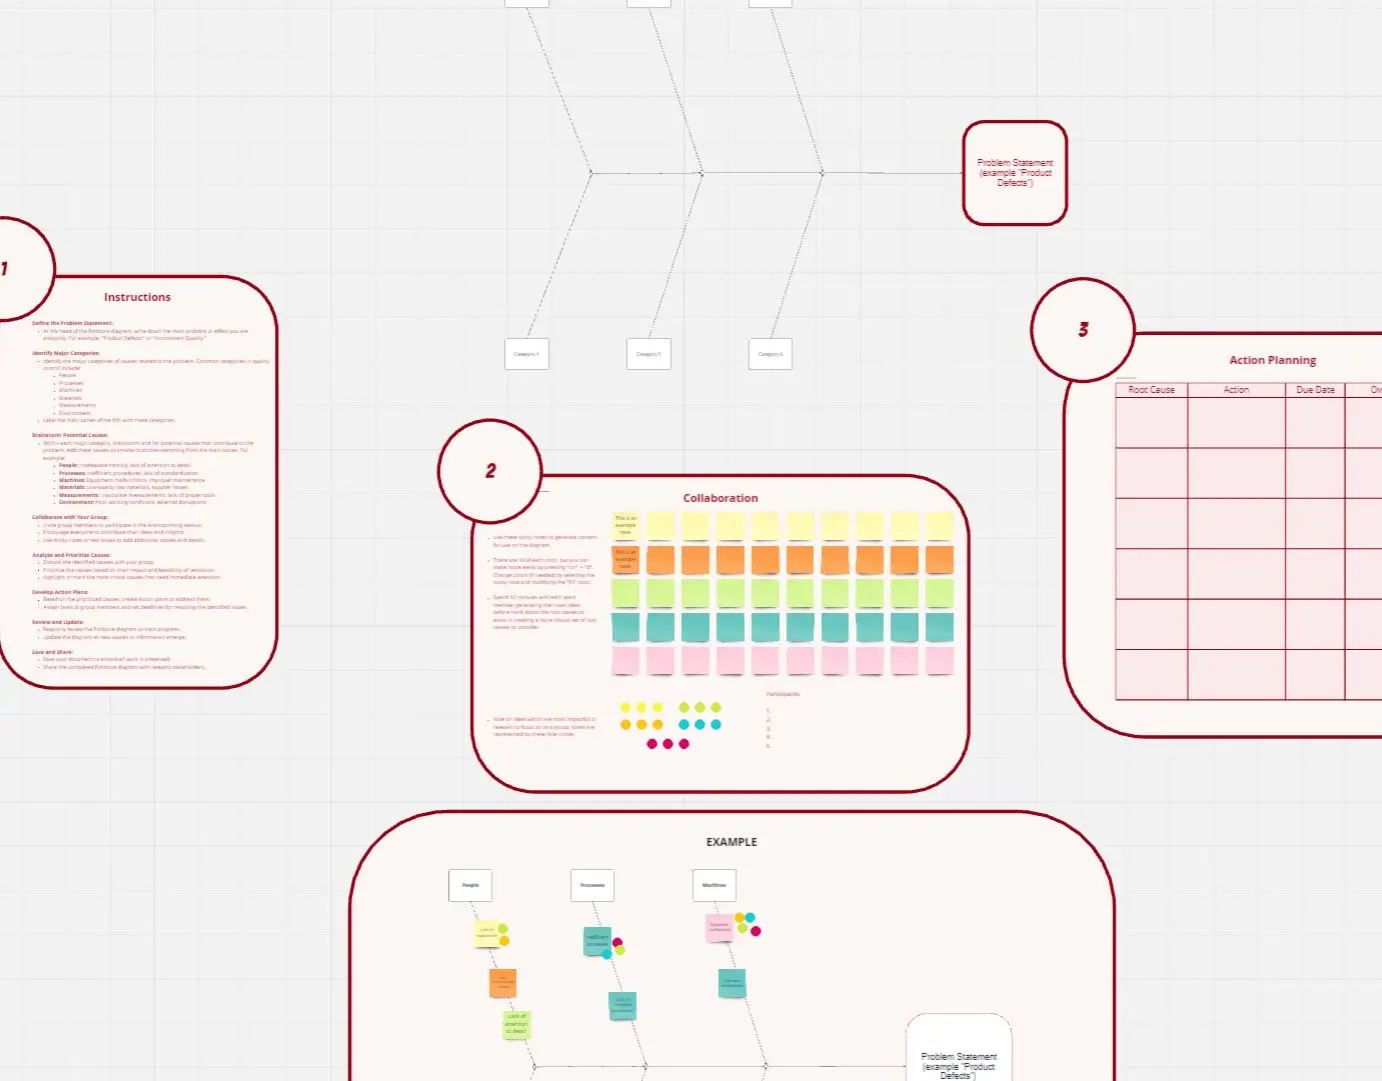
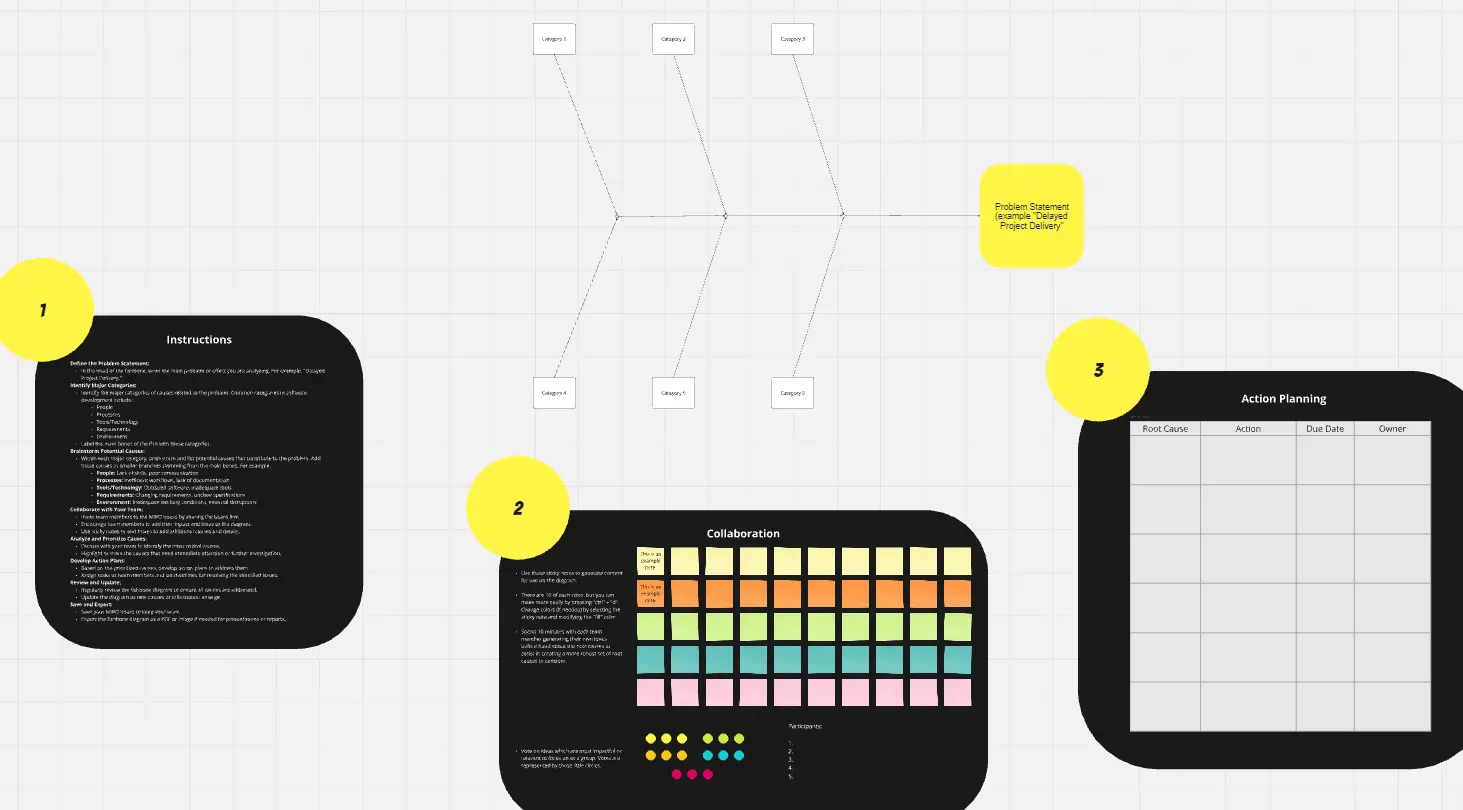
Fishbone Diagram for Root Cause Analysis
The Fishbone Diagram for Root Cause Analysis template helps identify and analyze the underlying causes of a problem. It visually breaks down issues into categories, such as people, processes, and equipment, to uncover root causes. Perfect for teams aiming to solve problems systematically, enhance processes, and prevent future occurrences. Ideal for brainstorming and collaborative analysis sessions.