72 likes
332 uses
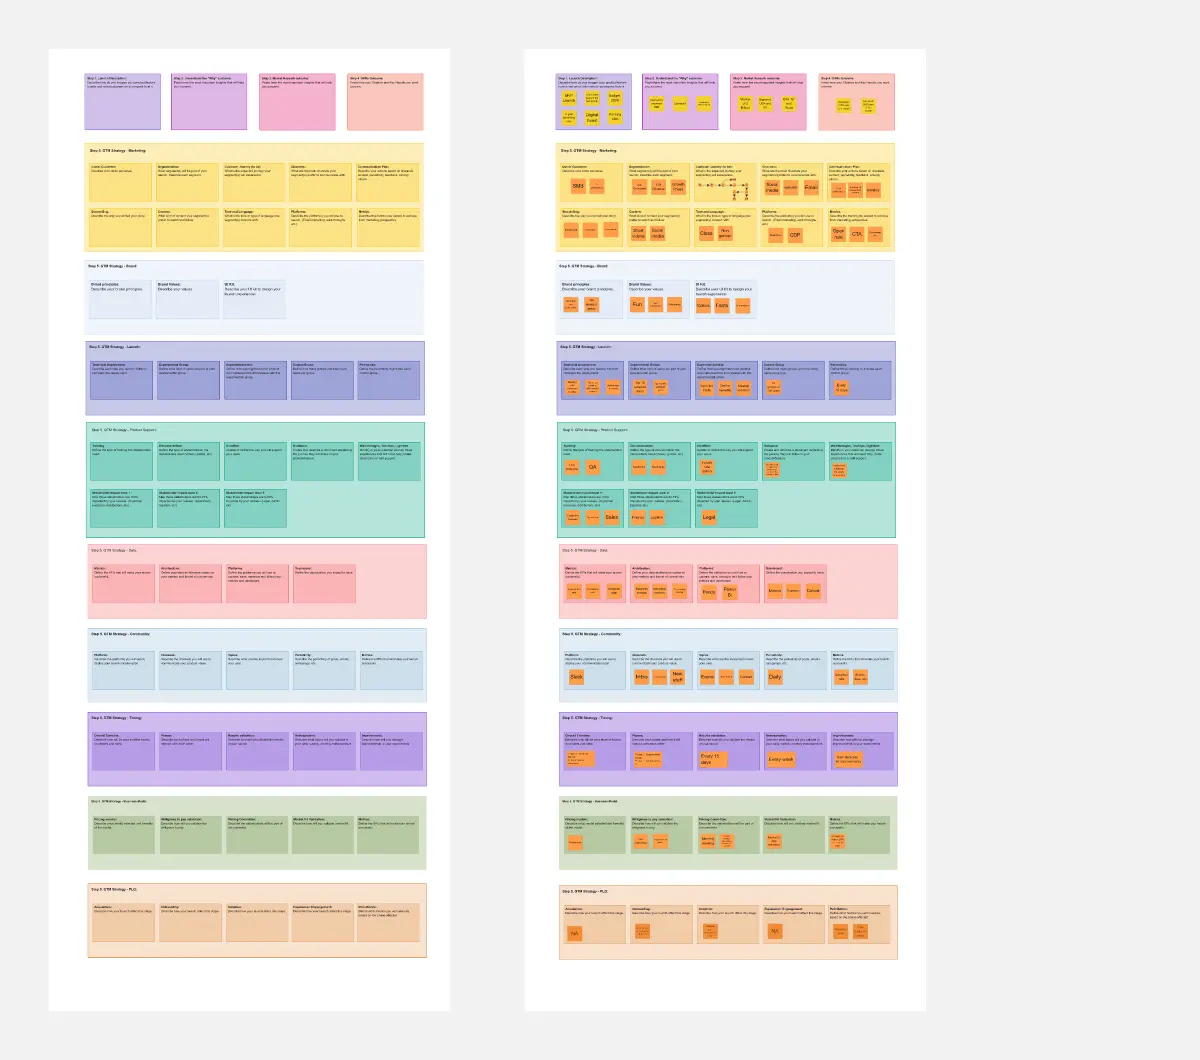
This comprehensive matrix enables organizations to evaluate and compare six distinct go-to-market strategies: Product-Led Growth, Community-Led, Hybrid Product+Sales, Marketing-Led, Sales-Led Enterprise, and Channel/Partner-Led. The template organizes critical decision-making factors into three interconnected sections, allowing leadership teams to assess which motion(s) best align with their company stage, product characteristics, and target market positioning.
This section establishes the financial foundation and customer targeting parameters for each GTM motion.
Ideal Customer Profile defines your target market by company size (employee count), market segment classification (SMB/Mid-Market/Enterprise), industry-specific characteristics, and organizational digital maturity. This shapes every downstream decision about sales approach and resource allocation.
Deal Economics captures Annual Contract Value (ACV) ranges, Customer Acquisition Cost (CAC) investment levels, and LTV:CAC ratios. These metrics determine unit economics viability and guide investment decisions across marketing, sales, and product resources.
Sales Cycle Length indicates realistic timelines from initial contact to closed deals, ranging from 14 days for product-led motions to 180+ days for enterprise sales. Understanding cycle length impacts cash flow planning and capacity modeling.
Primary Buyer Persona identifies decision-maker profiles, including titles, functional roles, and involvement levels in the buying process—from individual end-users to C-level executives with procurement teams.
Example Companies provides real-world validation by listing 4-5 recognizable organizations successfully executing each motion.
Begin by defining your ideal customer segment and typical deal size, then work backward to establish appropriate CAC targets and sales cycle expectations. Map buyer personas to your actual customer base, validating assumptions through customer interviews and win/loss analysis. Benchmark your metrics against comparable companies to ensure realistic targets.
This section translates strategy into operational execution through team design and performance measurement.
Team Structure & Headcount provides specific role breakdowns including SDRs, Account Executives, Customer Success Managers, Marketing specialists, Product personnel, and Operations support. It includes recommended ratios (e.g., SDRs per segment, AEs per Sales Manager) to ensure proper leverage and coverage.
Time to First Value defines when customers experience meaningful initial value, ranging from under 24 hours for product-led experiences to 60-120 days for complex enterprise implementations. This metric drives onboarding design and customer success prioritization.
Primary Channels lists the 4-6 most effective customer acquisition and engagement channels for each motion—whether product virality, outbound prospecting, content marketing, community forums, or partner networks.
Key Success Metrics identifies 4-5 critical KPIs with specific targets: conversion rates at each funnel stage, pipeline generation capacity, win rates, growth percentages, and efficiency metrics like CAC payback periods.
Design team structure based on revenue targets and individual sales capacity models. Calculate required headcount by working backward from revenue goals through conversion rates and average deal sizes. Select metrics that directly align with your motion's success drivers—PLG focuses on activation and viral coefficients, while enterprise sales prioritizes pipeline coverage and win rates. Ensure all metrics are measurable, trackable, and actionable.
This section addresses tactical execution and strategic risk management.
Onboarding Approach describes customer implementation methodology—from fully self-serve with in-app guidance to white-glove enterprise deployments with dedicated resources. It specifies touchpoint frequency, support levels, and enablement resources.
Pricing Model outlines monetization structure (freemium, tiered packaging, usage-based, custom enterprise pricing), contract terms (monthly/annual/multi-year), discount strategies, and add-on opportunities.
Expansion Strategy details how revenue grows within existing accounts: seat expansion through viral adoption, feature-based upsells, cross-selling to additional departments, or strategic enterprise-wide rollouts.
Risk Factors honestly identifies 4-5 key challenges specific to each motion: churn risks from poor activation, scaling challenges, channel conflicts, procurement complexity, or community management difficulties.
Align onboarding complexity and resource intensity with your customer segment and deal size—enterprise buyers expect high-touch while SMB requires scaled approaches. Design pricing to match your target persona's buying behavior and budget authority levels. Map expansion plays to natural customer usage patterns and organizational structure. Proactively assess risks to build mitigation strategies before they become critical problems.
Cheers!
Khawaja Rizwan

Rizwan Khawaja
ICT Solution Architect @ NUST
I hold master's degrees in computer science and project management along with trainings and certifications in various technologies. All this is coupled with 25+ years of industry experience.