A Simple Process Gantt Chart for project managers streamlines timeline visualization, enabling teams to track deliverables, dependencies and milestones across project lifecycles. This template simplifies scheduling complexity into actionable visual roadmaps.
What Is a Simple Process Gantt Chart for Project Managers?
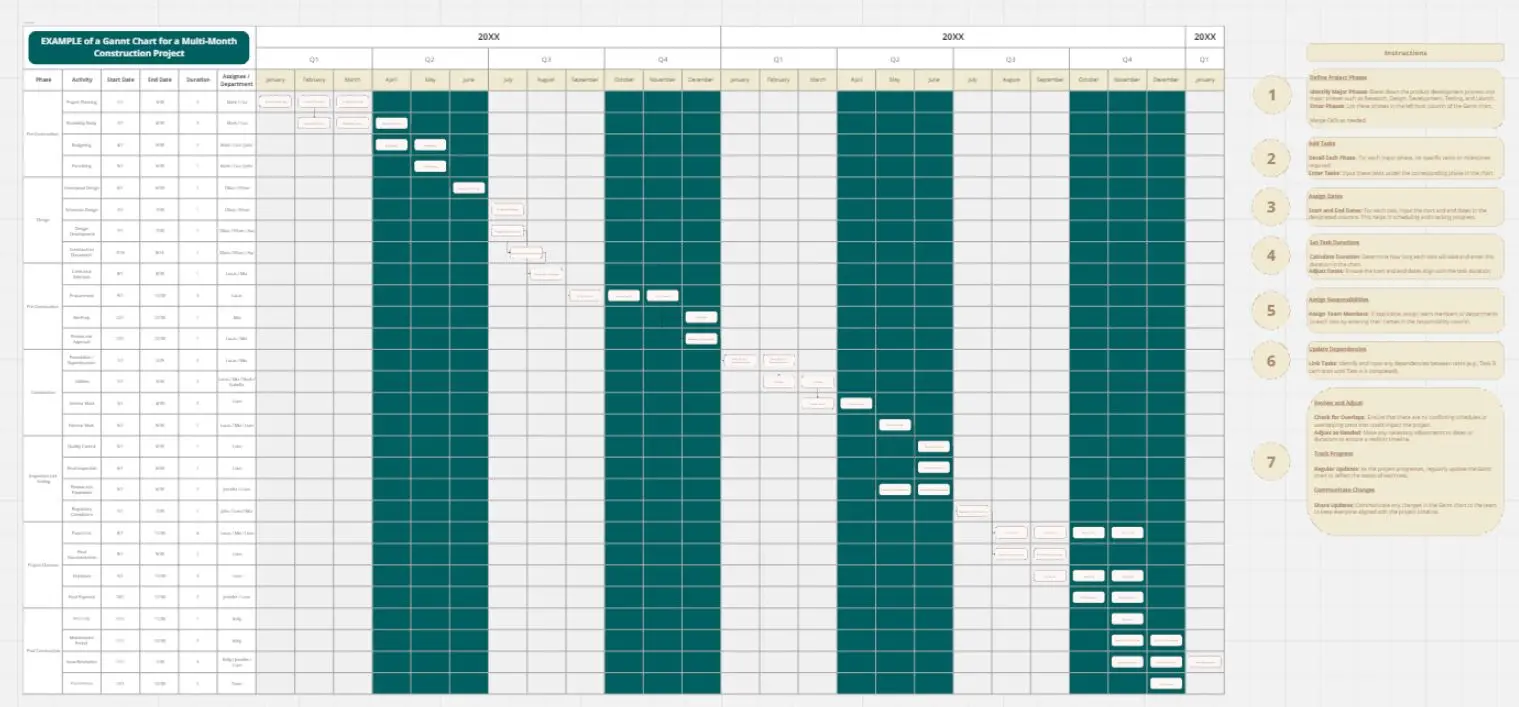
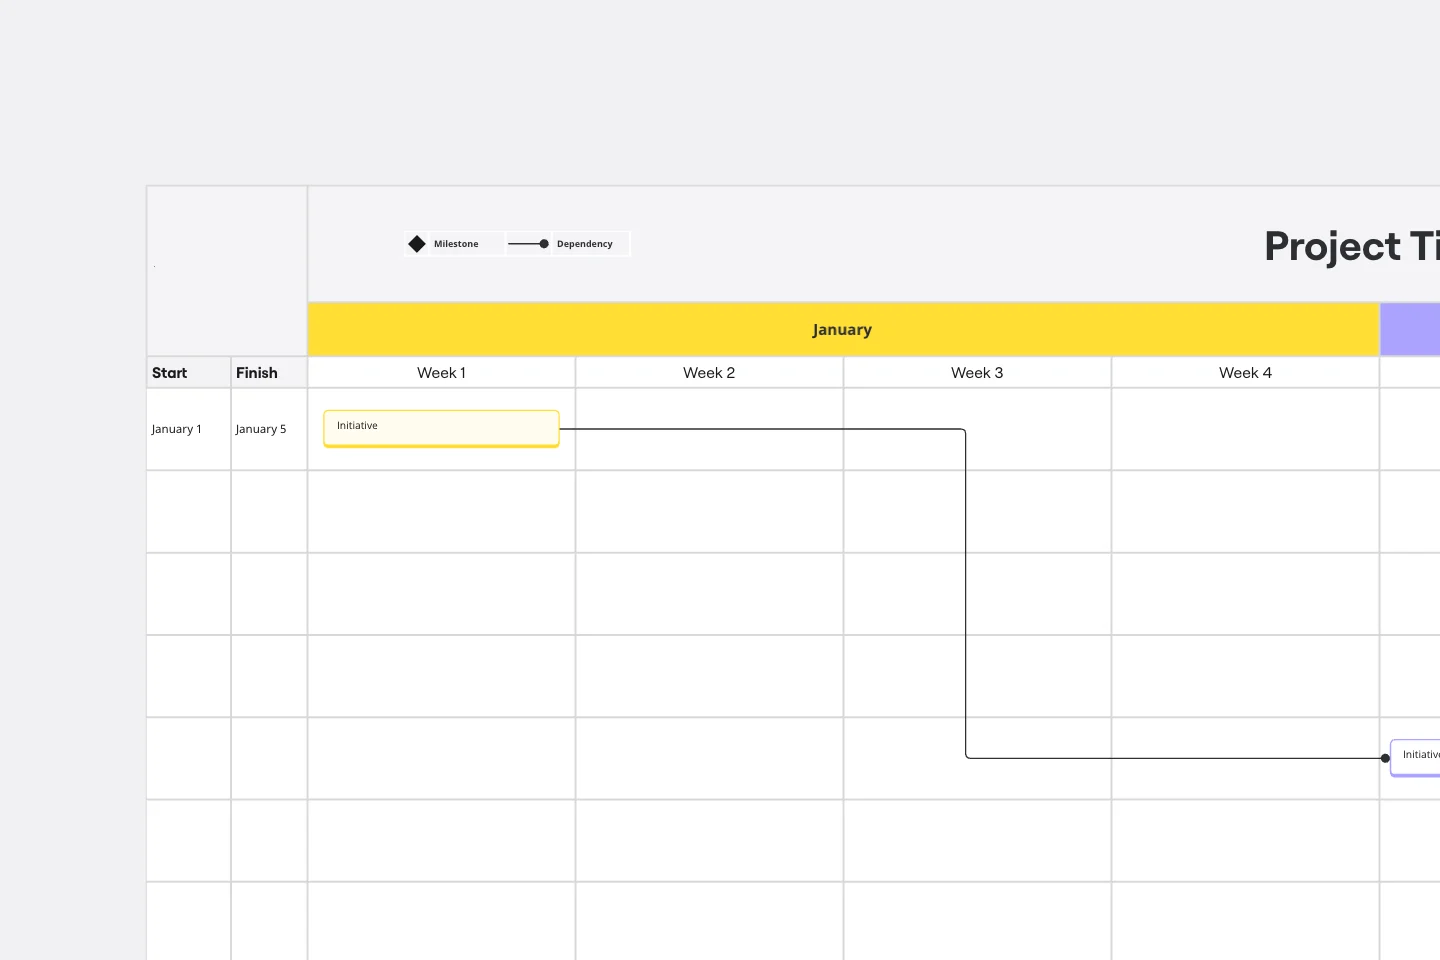
A Simple Process Gantt Chart is a visual project planning tool that displays tasks, timelines and dependencies in a horizontal bar format. Project managers use this template to map workflows, allocate resources and communicate schedules to stakeholders without overwhelming technical complexity.
What Problems Does a Simple Process Gantt Chart Solve for Project Teams?
This template addresses critical project management challenges:
Timeline confusion: Eliminates ambiguity around task sequencing and deadlines
Resource conflicts: Identifies overlapping commitments before they become bottlenecks
Stakeholder alignment: Provides at-a-glance progress visibility for executives and clients
Scope creep: Establishes clear boundaries for deliverable timing and dependencies
How to Use the Simple Process Gantt Chart Template
Define project phases: Break your initiative into major milestones
List tasks: Document all activities required to complete each phase
Set durations: Assign realistic timeframes based on team capacity
Map dependencies: Connect tasks that must occur sequentially
Assign owners: Designate responsible team members for accountability
Update regularly: Review weekly to reflect actual progress and adjust forecasts
Simple Process Gantt Chart Template FAQs
When should project managers use this Simple Process Gantt Chart?
Deploy this template during project kickoff, sprint planning or when communicating timelines to non-technical stakeholders.
Can I customize the Simple Process Gantt Chart for agile workflows?
Yes—adapt the template by using shorter time increments and incorporating sprint cycles.