About the Semantic Map Template
The Semantic Map Template is an adaptable and useful tool that helps comprehend complex concepts. A structured framework breaks down ideas into interconnected components, promoting clarity and understanding.
The template is a foundation for creating semantic maps and visual representations of categories, concepts, and relationships within a domain. Each template section helps break down broad topics into subtopics, attributes, and examples, allowing for a thorough exploration of each element.
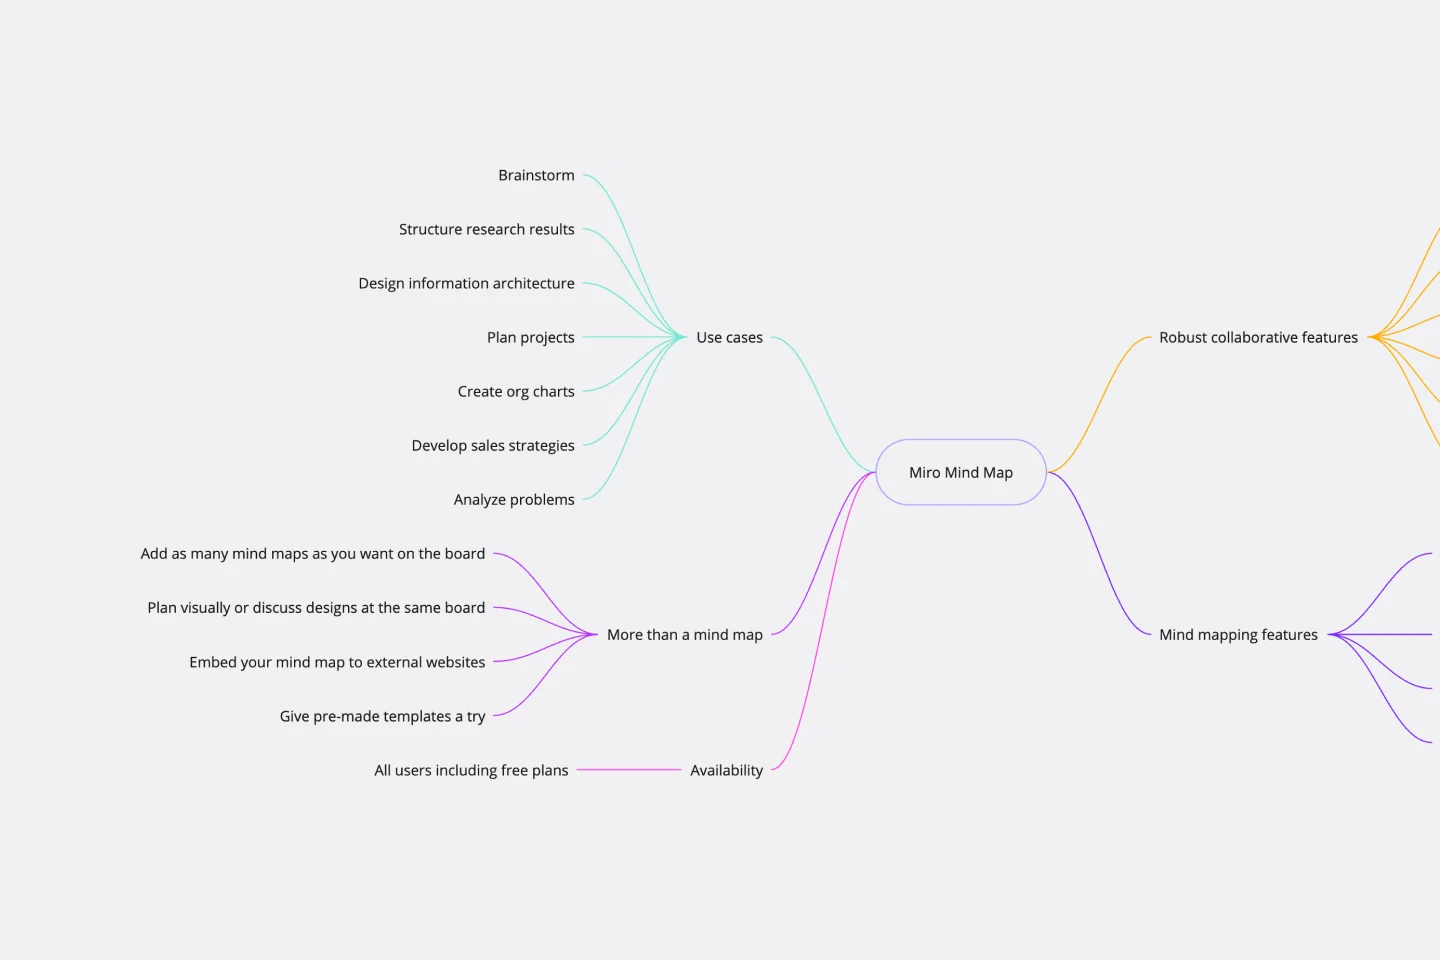
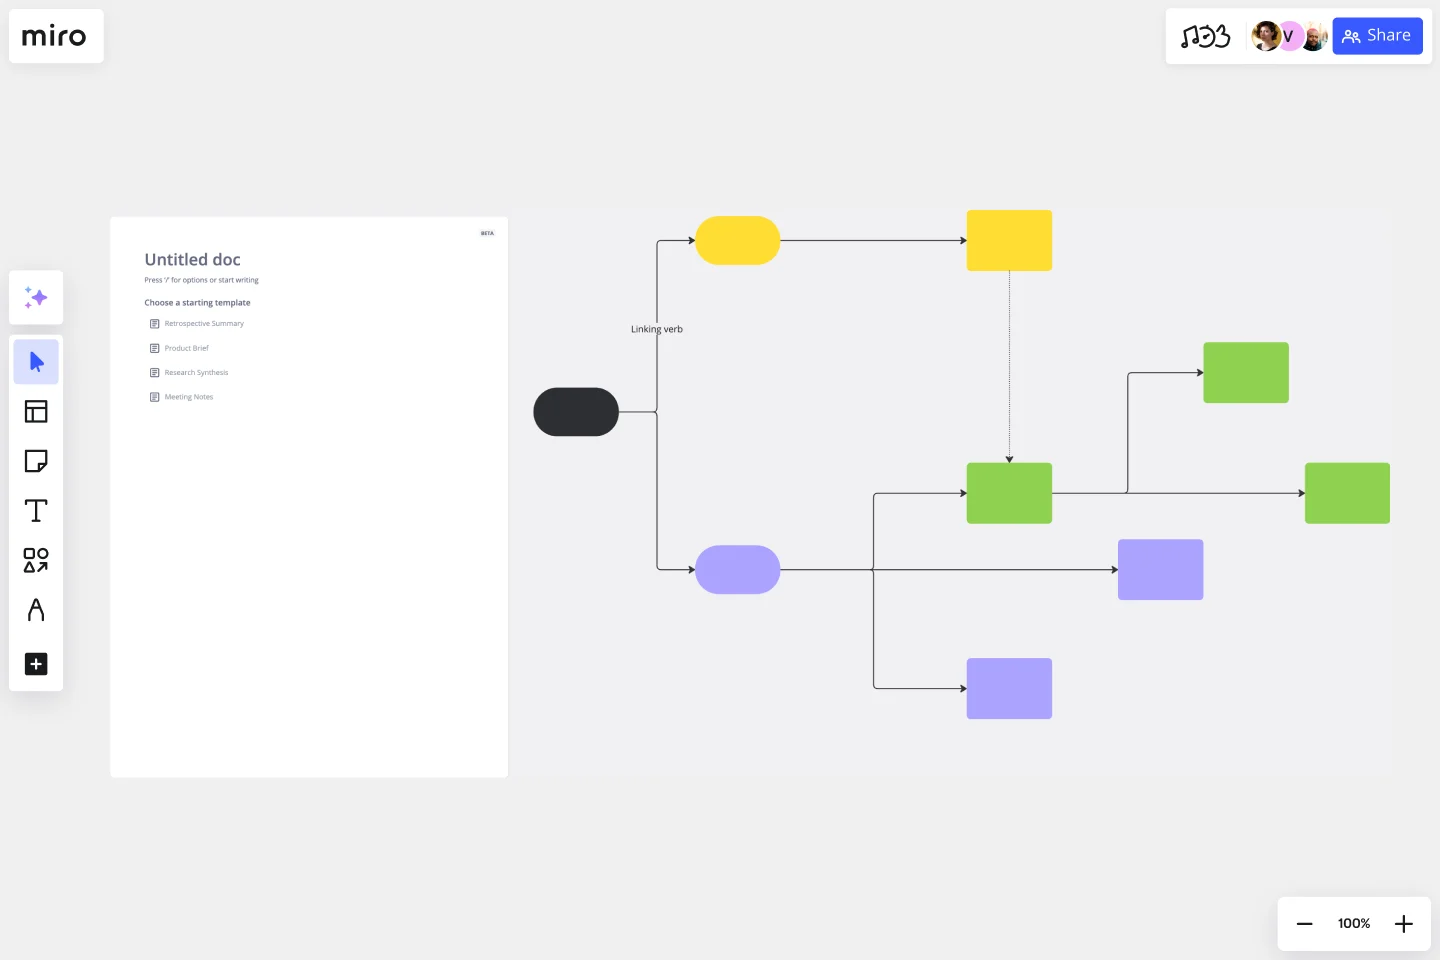
The semantic map template has the primary concept placed in the central area, and related ideas and nuances are added in the surrounding layers. The template is designed to guide users through this process quickly and intuitively.
How to use the semantic map template in Miro
Creating a semantic map in Miro is a seamless process that empowers users to organize their thoughts with precision. Follow these simple steps to get started:
Edit the central concept: Click the central node to add the main idea or concept you are exploring.
Expand the map: Easily add more branches to the central concept. Click on a node and select the '+' sign to create new connecting lines and nodes. These automated diagramming features make expanding your map as simple as typing your thoughts.
Customize nodes: Tailor the content of each node with just a few clicks, whether it's to add detailed descriptions, link to external resources, or adjust the visual layout.
Enrich with artifacts: Drag and drop images, documents, or other artifacts onto your board to give more context to any part of your map, enhancing the richness of your visual representation.
The intuitive nature of the Miro board ensures that adjustments and expansions to the Semantic Map Template can be made effortlessly, accommodating continuous development and exploration of ideas.
Why should you use a semantic map template?
Here are five benefits of using visual mapping templates:
Enhanced comprehension: Visual organization of complex information helps users grasp concepts faster.
Streamlined collaboration: The template allows for simultaneous contributions, encouraging a collaborative environment for brainstorming and learning.
Improved retention: The visual nature of the template assists with memory retention, making it a powerful tool for educational purposes.
Flexible structuring: The template's adaptability allows users to expand or contract information as needed, making it appropriate for various topics and discussions.
Clear communication: The template presents ideas in a clear and accessible way, ensuring that everyone has a mutual understanding of the discussed concepts.
Semantic Map Template FAQs
Can the semantic map template handle multiple layers of information?
Absolutely. The template accommodates many layers of related concepts and details, allowing for a comprehensive exploration of the central idea.
Is it possible to link different semantic maps within Miro?
Yes, people can create connections between different semantic maps or other elements within their Miro board to illustrate larger relationships and context.
How many people can collaborate on a semantic map template simultaneously?
There's no set limit to the number of collaborators. Miro's mind map maker supports simultaneous contributions from teams, regardless of size, enabling real-time collaboration.
Are there any customization options for the semantic map template?
The template is fully customizable. Users can change colors, add icons, change text styles, and incorporate various artifacts to personalize their semantic map to their specific needs.


