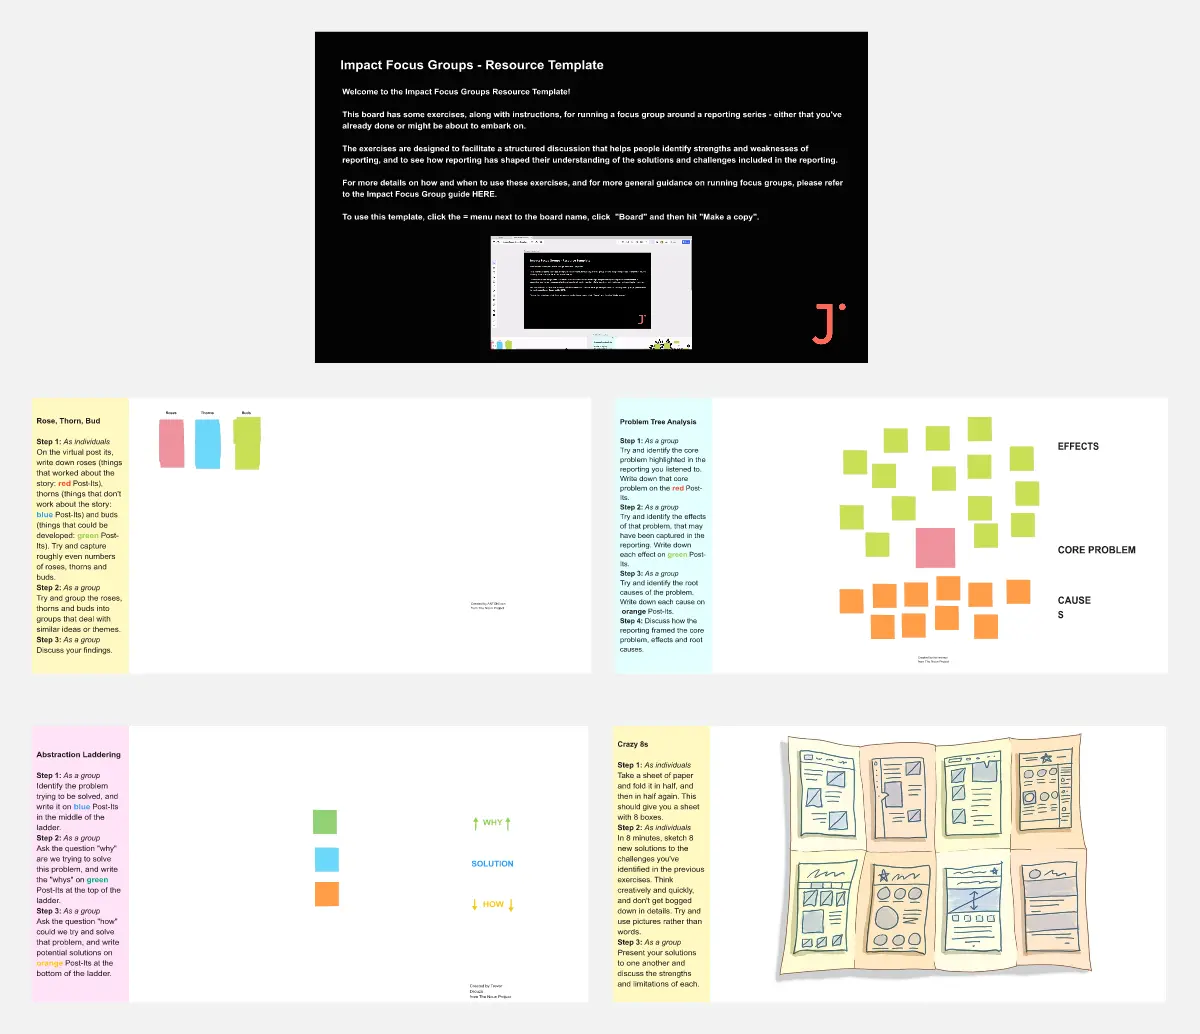
The Root Cause Analysis (RCA) Template is a structured tool that helps teams uncover the underlying reasons behind specific problems or events. By pinpointing and addressing these root causes, rather than just treating the symptoms, organizations can foster long-term solutions and prevent recurring challenges, leading to more efficient and sustainable operations.
Our carefully crafted ICS Org Chart Template is an invaluable tool designed to clearly represent the hierarchical structure of the Incident Command System (ICS). It simplifies the complex web of roles, responsibilities, and chains of command within the ICS, providing a structured blueprint for both experienced professionals and those new to the system. The template's most notable benefit is its ability to foster immediate understanding, bridging the gap between intricate organizational structures and the teams navigating them. Teams that use this template can ensure that everyone is aligned, understands their role, and collaborates efficiently, thereby reducing potential bottlenecks and misunderstandings.
The Circular Org Chart Template is an innovative solution that helps represent and visualize complex organizational structures with ease. The key advantage of this template is its ability to present complex hierarchies in a visually appealing and easy-to-understand format. By adopting a circular arrangement, the template provides a comprehensive and holistic view of the organization, making it effortless for teams to comprehend reporting relationships at a glance. The visual clarity offered by this template fosters efficient communication and decision-making, offering a seamless experience for teams to understand their organizational structure. The template's intuitive design and emphasis on visual representation significantly enhance transparency, promoting a deeper understanding of organizational roles and relationships.
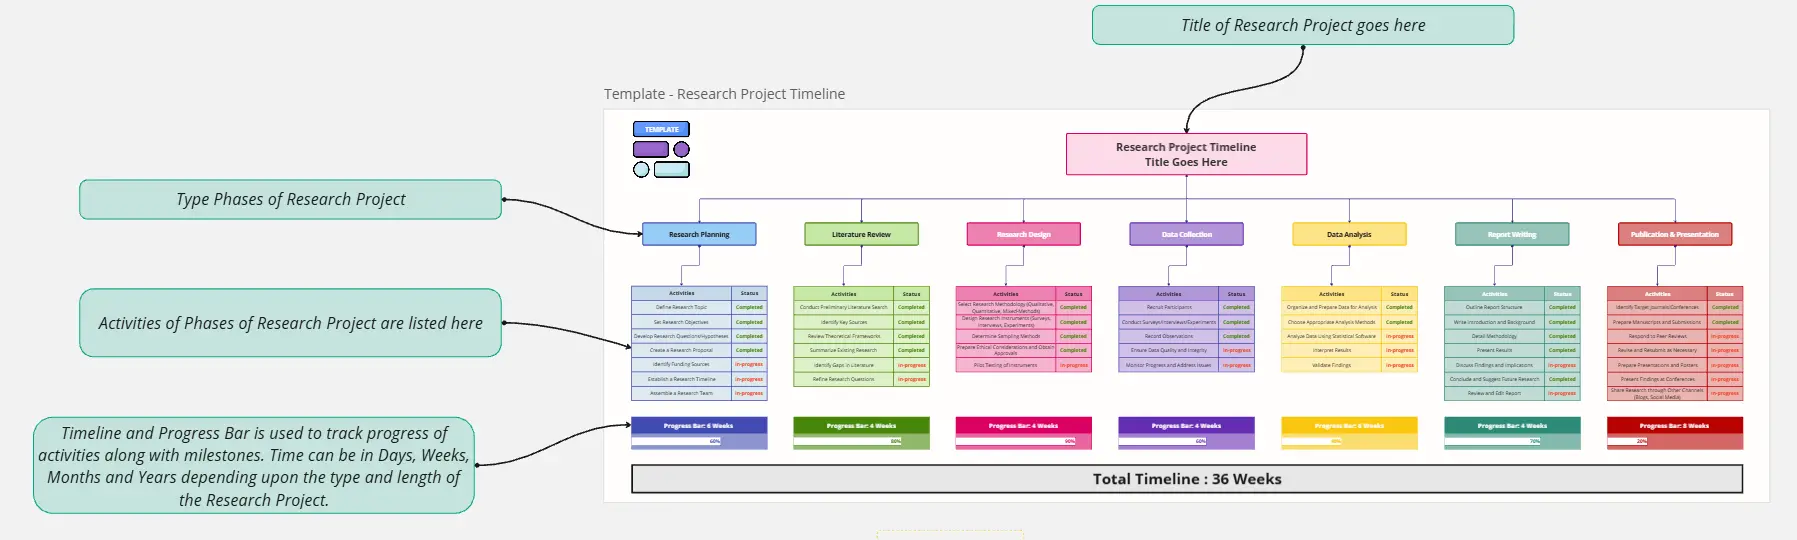
Embarking on a research project? The Research Project Timeline template by Rizwan Khawaja is an essential tool for planning and managing your research activities. It helps you break down your project into manageable phases, set deadlines, and track progress. From literature review and data collection to analysis and reporting, this template ensures you stay organized and on schedule, enhancing your ability to conduct thorough research.
The Business Intelligence Architecture Diagram Template in Miro visually maps the complex landscape of business intelligence systems. With elements encompassing data sources, warehouses, ETL processes, tools, and end-user interfaces, the template enables users to communicate complex concepts with clarity. One standout feature is the template's dynamic adaptability, empowered by Miro's automated diagramming capabilities. This feature ensures that the diagram remains up-to-date with minimal effort, allowing users to effortlessly incorporate changes in data structures and processes, thus maintaining the relevance and accuracy of their visual representations over time.
Balanced scorecards are useful tools for understanding business performance at a glance with regard to customers, employees, business processes, and financial progress. Learn more about BSCs and create your own using Miro’s Balanced Scorecard template.
The entire team meets to review the day before and discuss the day ahead. These daily meetings, also known as “scrums,” are brief but powerful — they identify roadblocks, give each team member a voice, foster collaboration, keep progress on track, and ultimately keep teams working together effectively. This template makes it so easy for you to plan daily standups for your sprint team. It all starts with picking a date and time, creating an agenda, and sticking with the same format throughout the sprint.
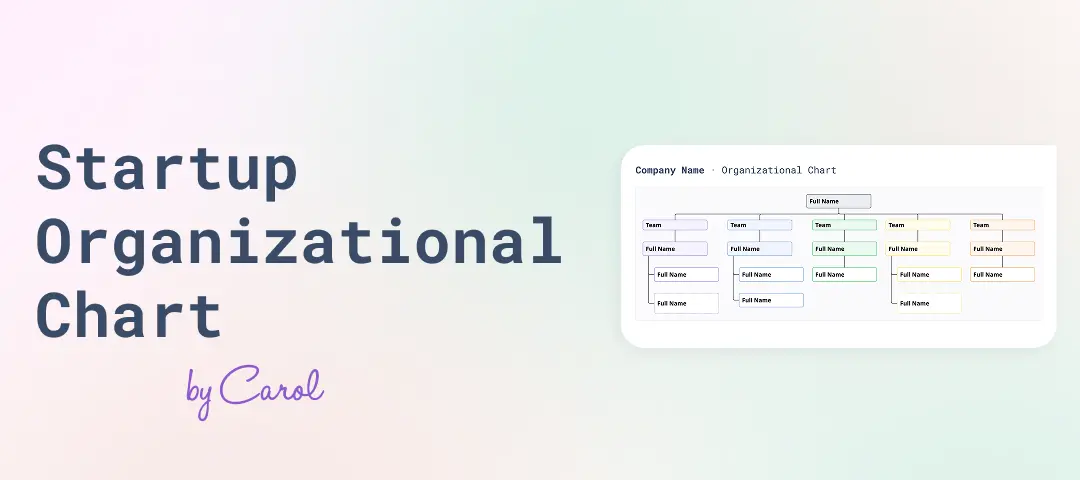
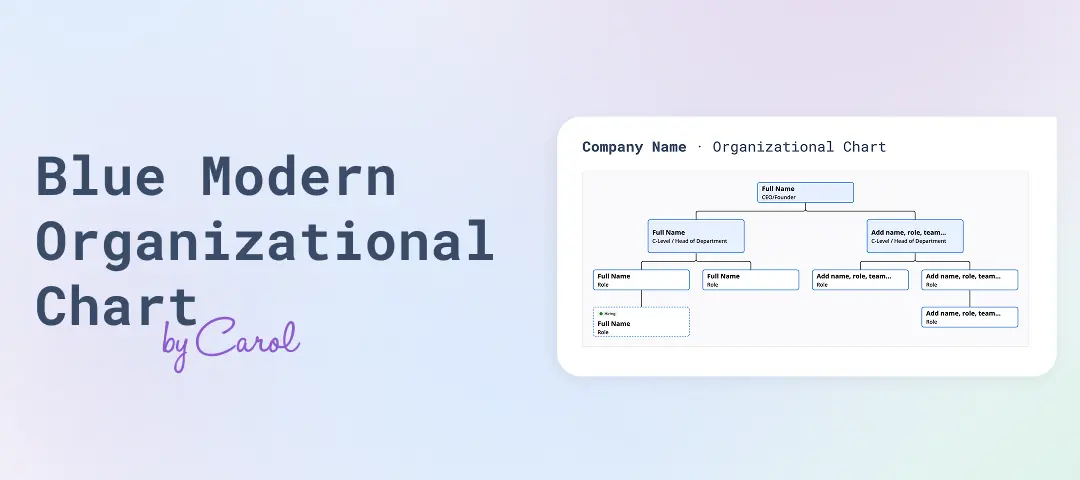
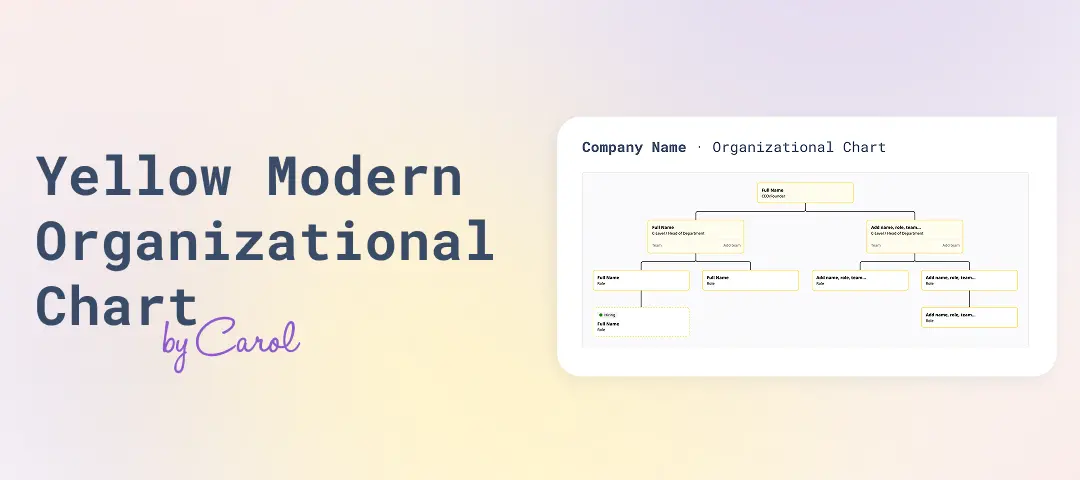
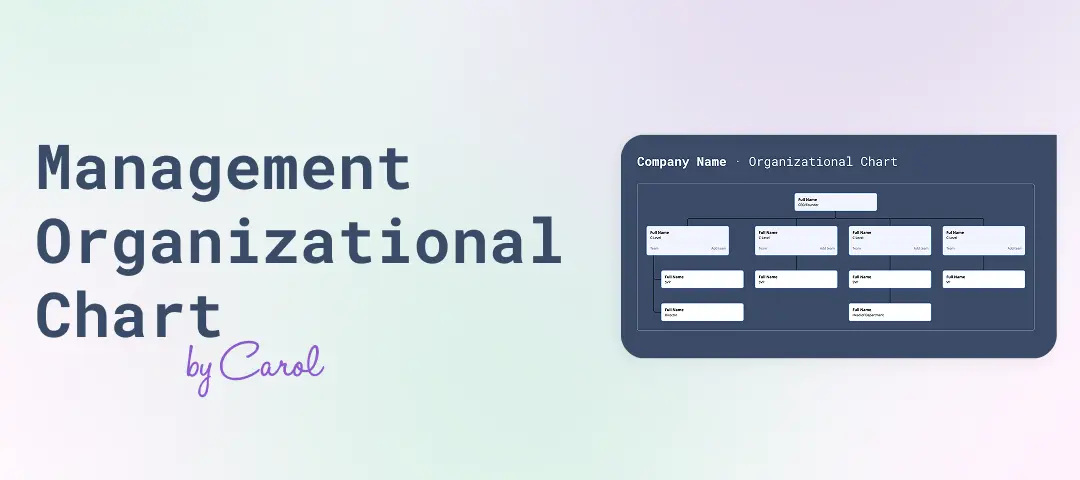
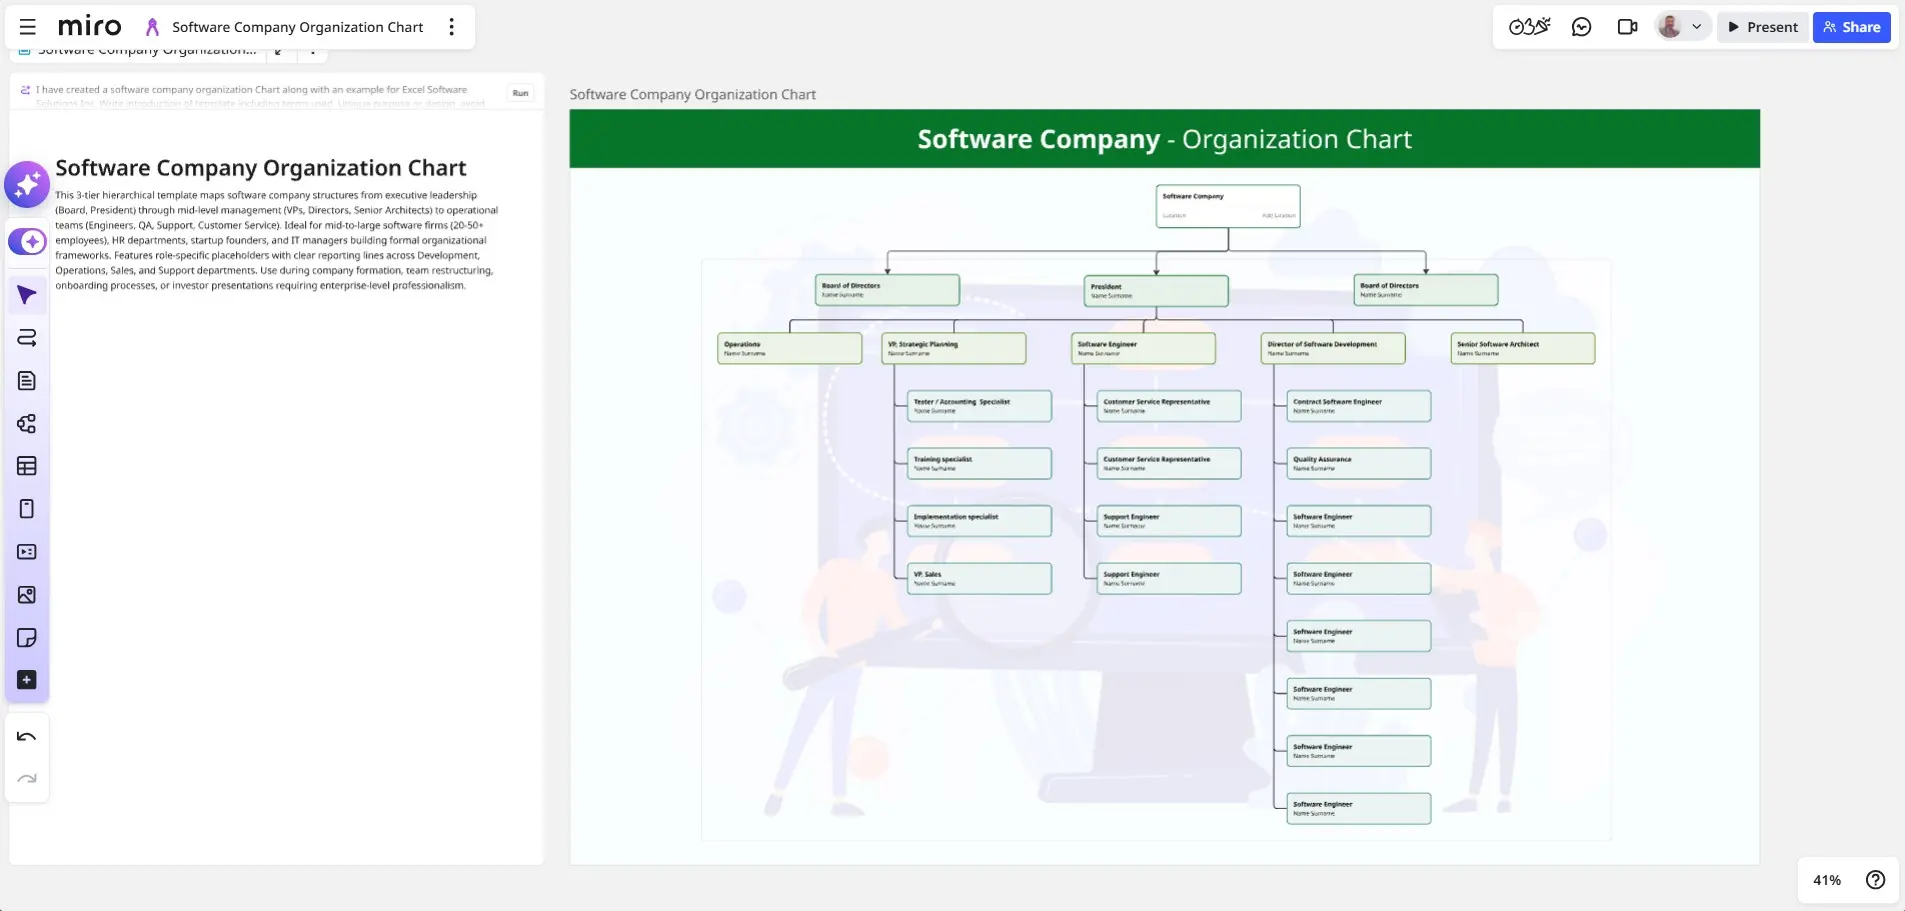
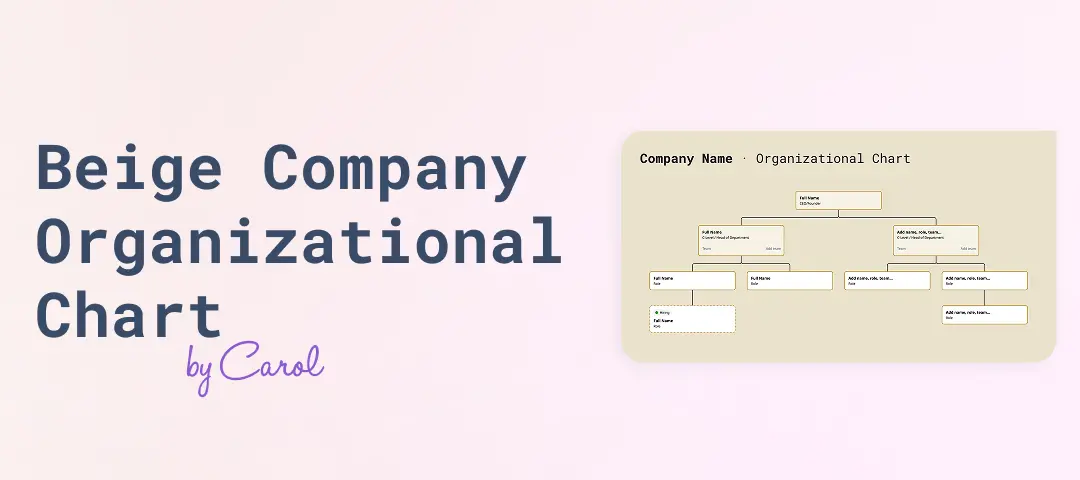
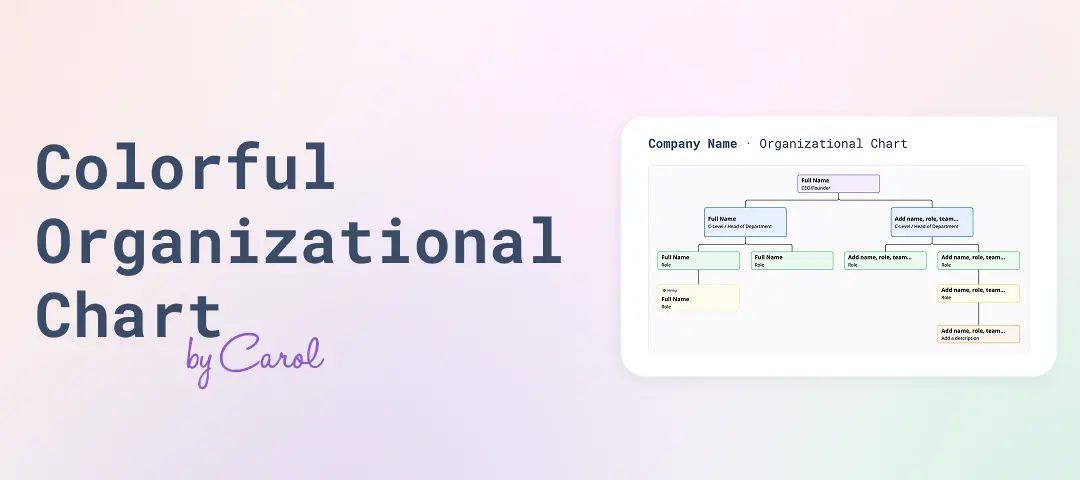
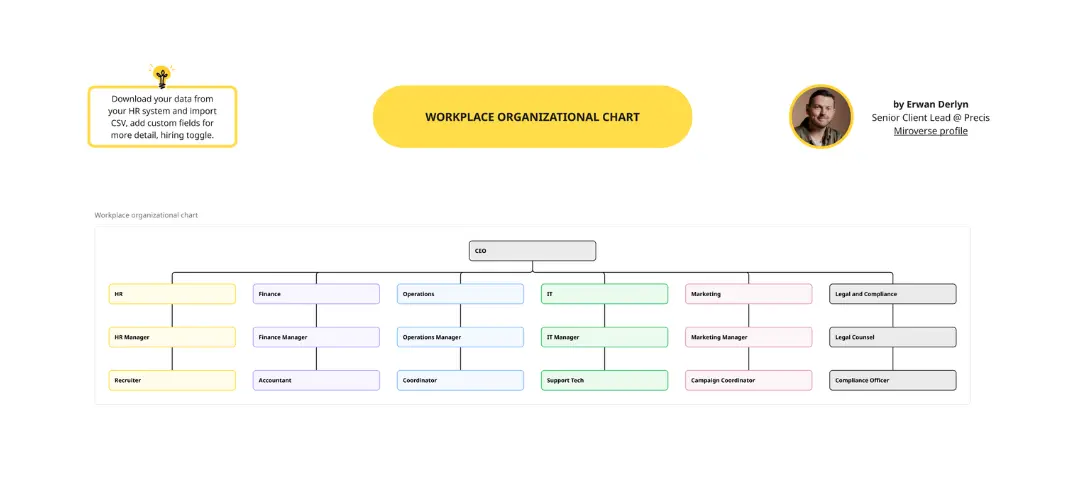
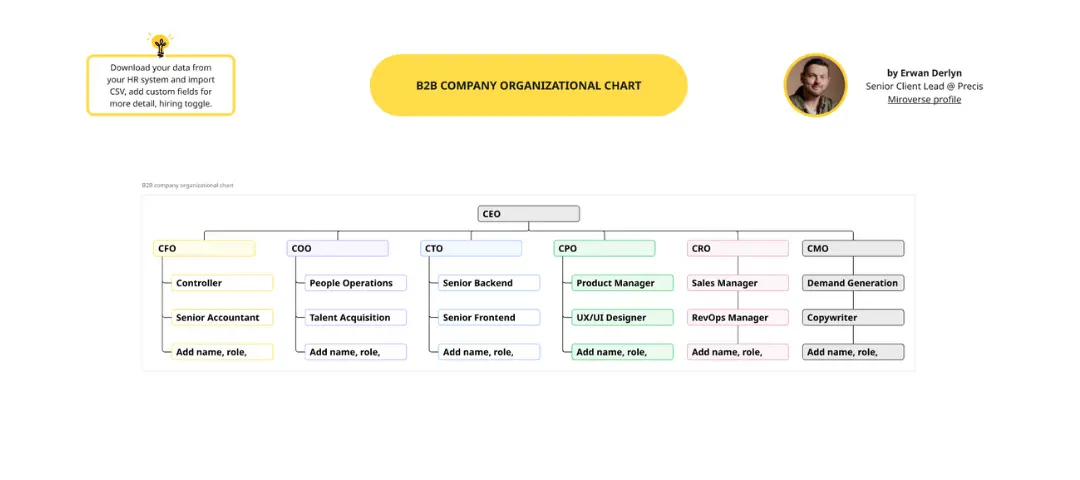
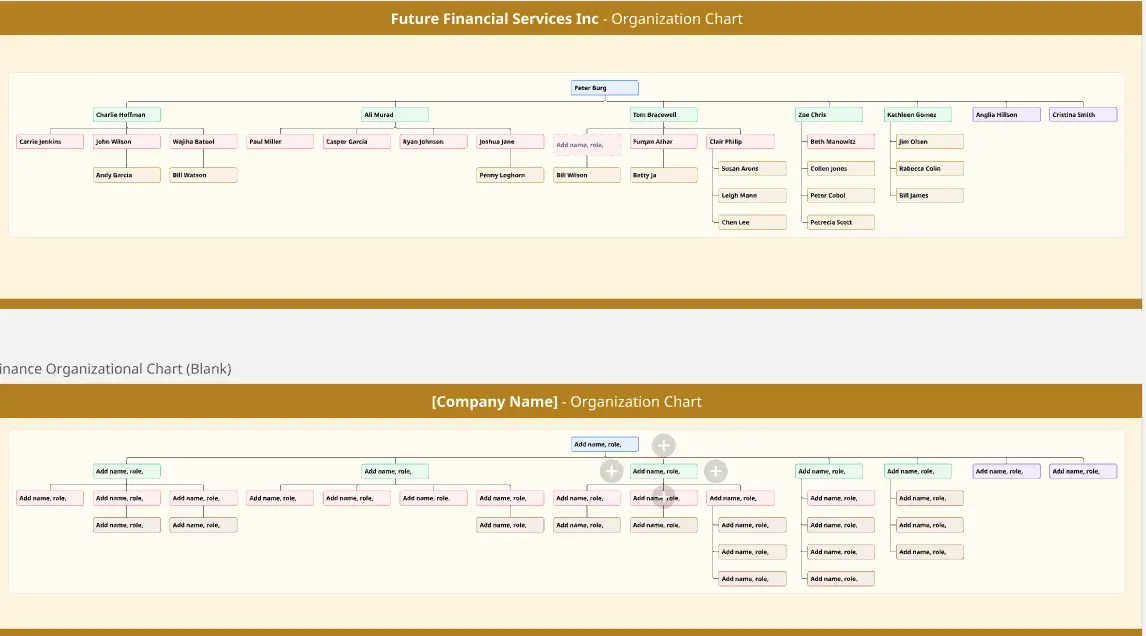
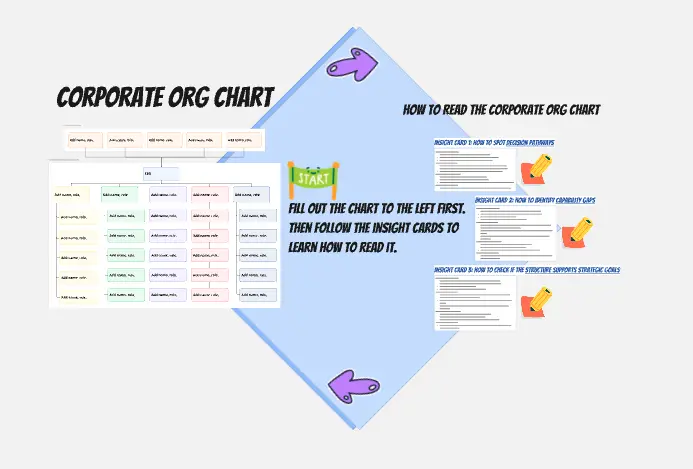
Establishing hierarchy in a business can empower employees—to know their roles and responsibilities, team members, potential cross-functional collaborators, and who to turn to with a specific need. That’s just what a Business Organizational Chart does. And this template makes it simple to build a BOC for your company. The first step is to determine the high-level organizational structure of your company. Then it's easy to create a visual representation of how different employees are interconnected.
The flat org chart template provides a clear and visual representation of modern organizational structures that prioritize collaboration and horizontal relationships over complex hierarchical chains of command. One of the major advantages of using this template is that it promotes clarity and transparency, making it easy for organizations to showcase team configurations and ensure that all team members understand their roles in the larger context. This clarity fosters a more inclusive and collaborative environment, which aligns perfectly with contemporary organizational values. The template is a great tool for promoting effective communication and teamwork.
This AWS Well-Architected Framework Review (WAFR) template provides you and your team with a dedicated space to conduct a Well-Architected Framework Review with a client.
The Troubleshooting Flowchart Template is an easy-to-use and versatile tool that simplifies problem-solving. It provides a step-by-step visual guide to identify, analyze, and fix issues, ensuring a clear and structured approach to troubleshooting. One of the key benefits of utilizing this template is that it helps improve communication among team members. By representing the troubleshooting steps visually, it simplifies complex processes and makes it easier for team members to understand, collaborate, and contribute efficiently.
The BPMN Diagram for IT Processes template maps and optimizes IT workflows, from incident management to service delivery. Ideal for IT teams looking to enhance service management, streamline operations, and boost service quality, this template provides a visual framework for identifying bottlenecks, improving communication, and achieving efficient IT process management.
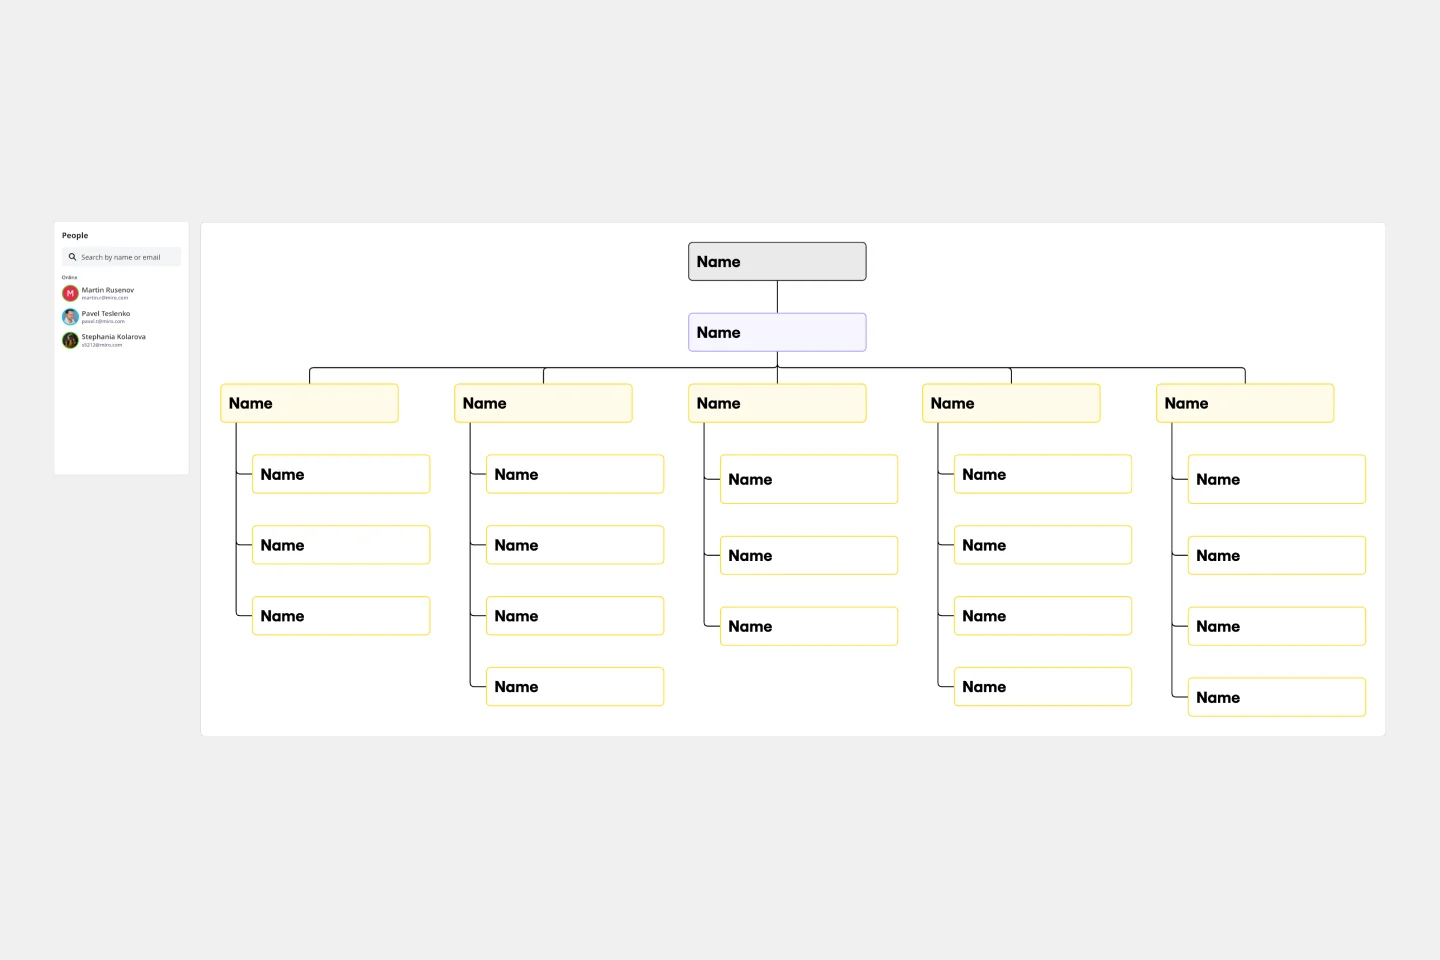
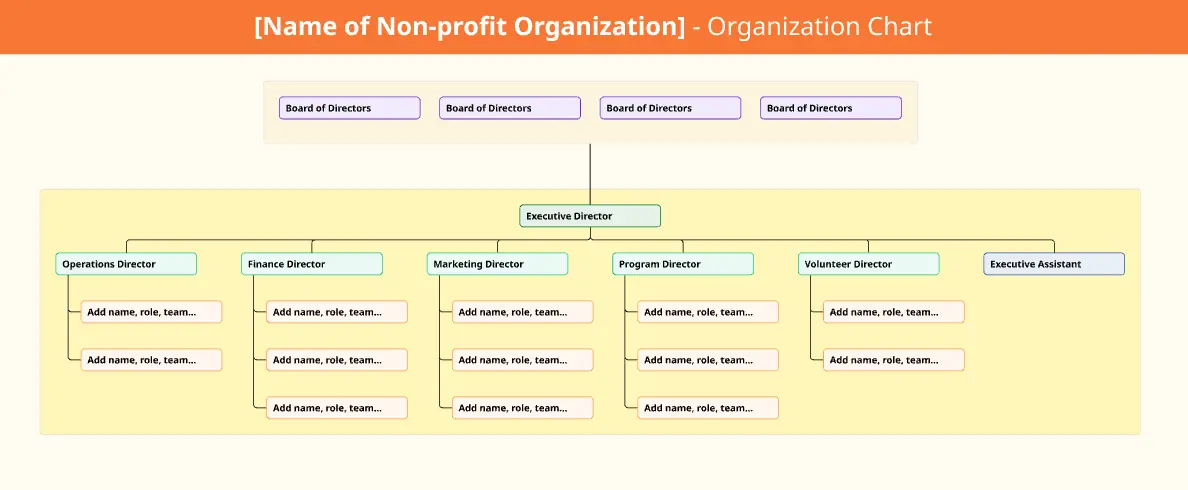
The Vertical Organizational Chart Template is an efficient way to illustrate the hierarchy of an entity in a top-down format. This tool helps represent roles and relationships in a clear manner, starting from the topmost authority and branching downwards. It allows for a better understanding of the flow of responsibilities and communication channels within the organization. One of its most significant advantages is promoting clear communication. Depicting the organization's structure helps avoid misunderstandings and ensures everyone is on the same page regarding the chain of command.