About the ICS Org Chart Template
In today's work environment, having tools that provide flexibility and clarity is crucial, particularly when it comes to coordinating teams and ensuring seamless communication. The ICS Org Chart Template is an excellent solution in this regard. ICS, which stands for Incident Command System, is a standardized all-hazard incident management concept used in the United States. It is a complex system that demands careful organization and structure.
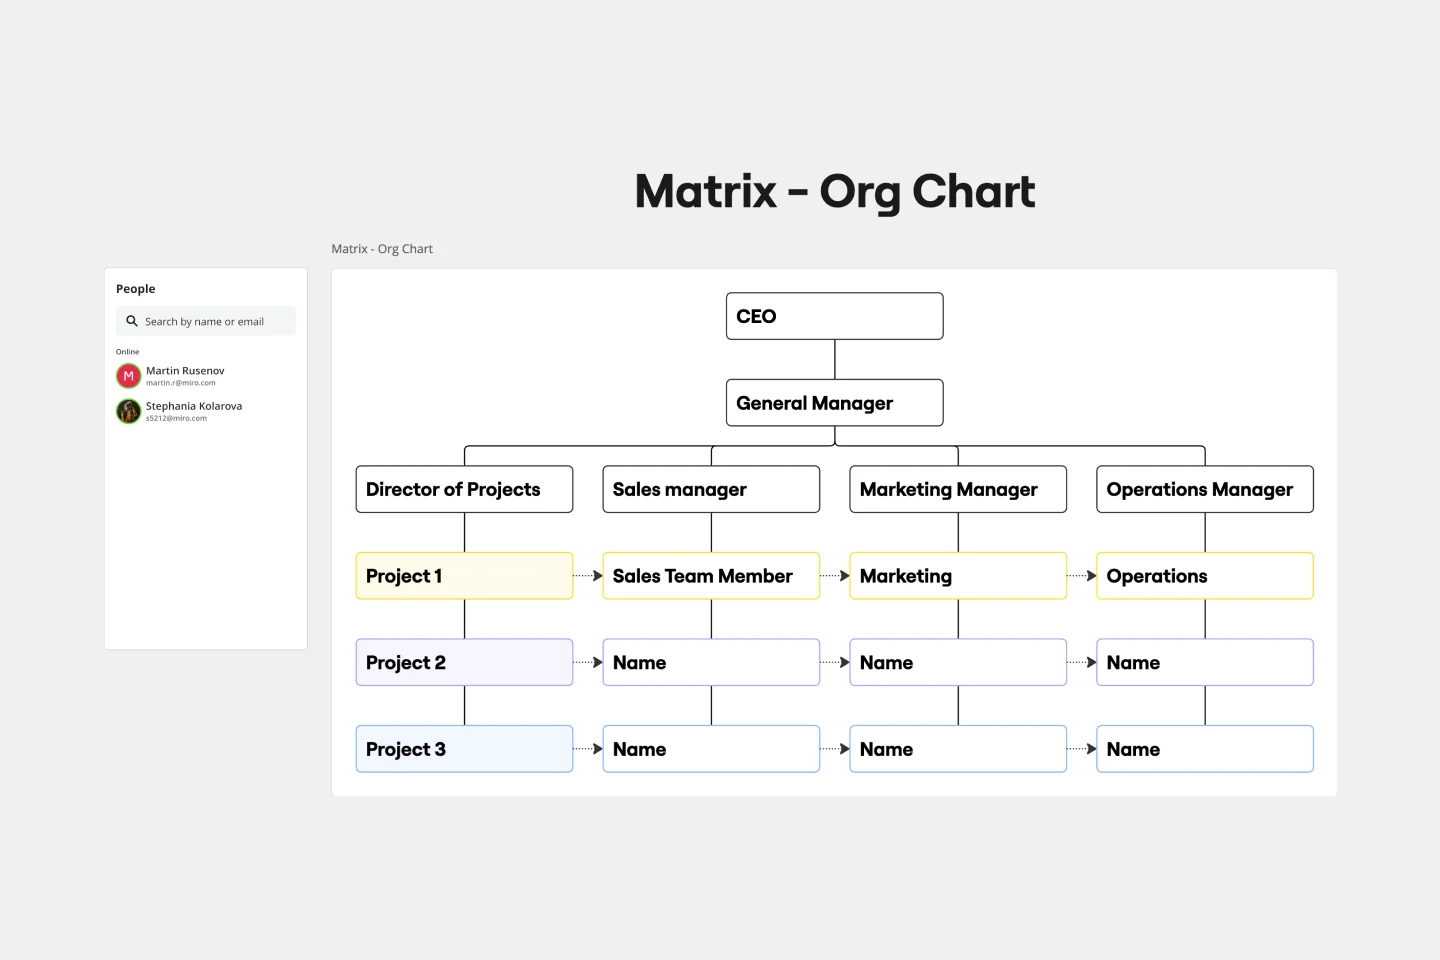
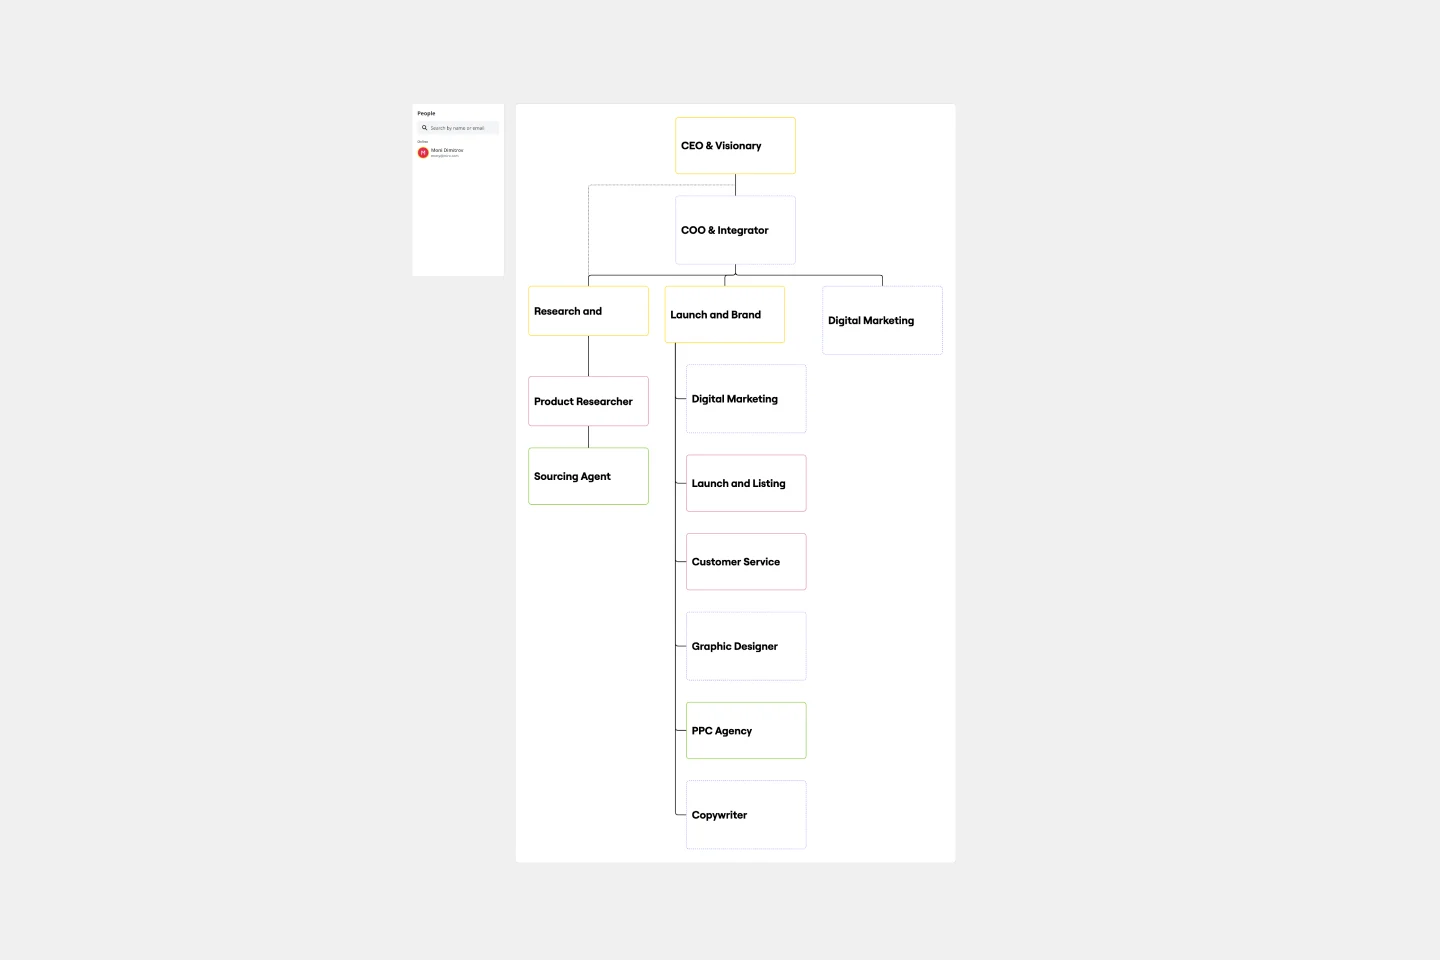
The ICS Org Chart Template is specifically designed to help teams understand the structure of this system. It provides a clear and visual representation of roles, responsibilities, and chains of command, making it an invaluable tool for any organization.
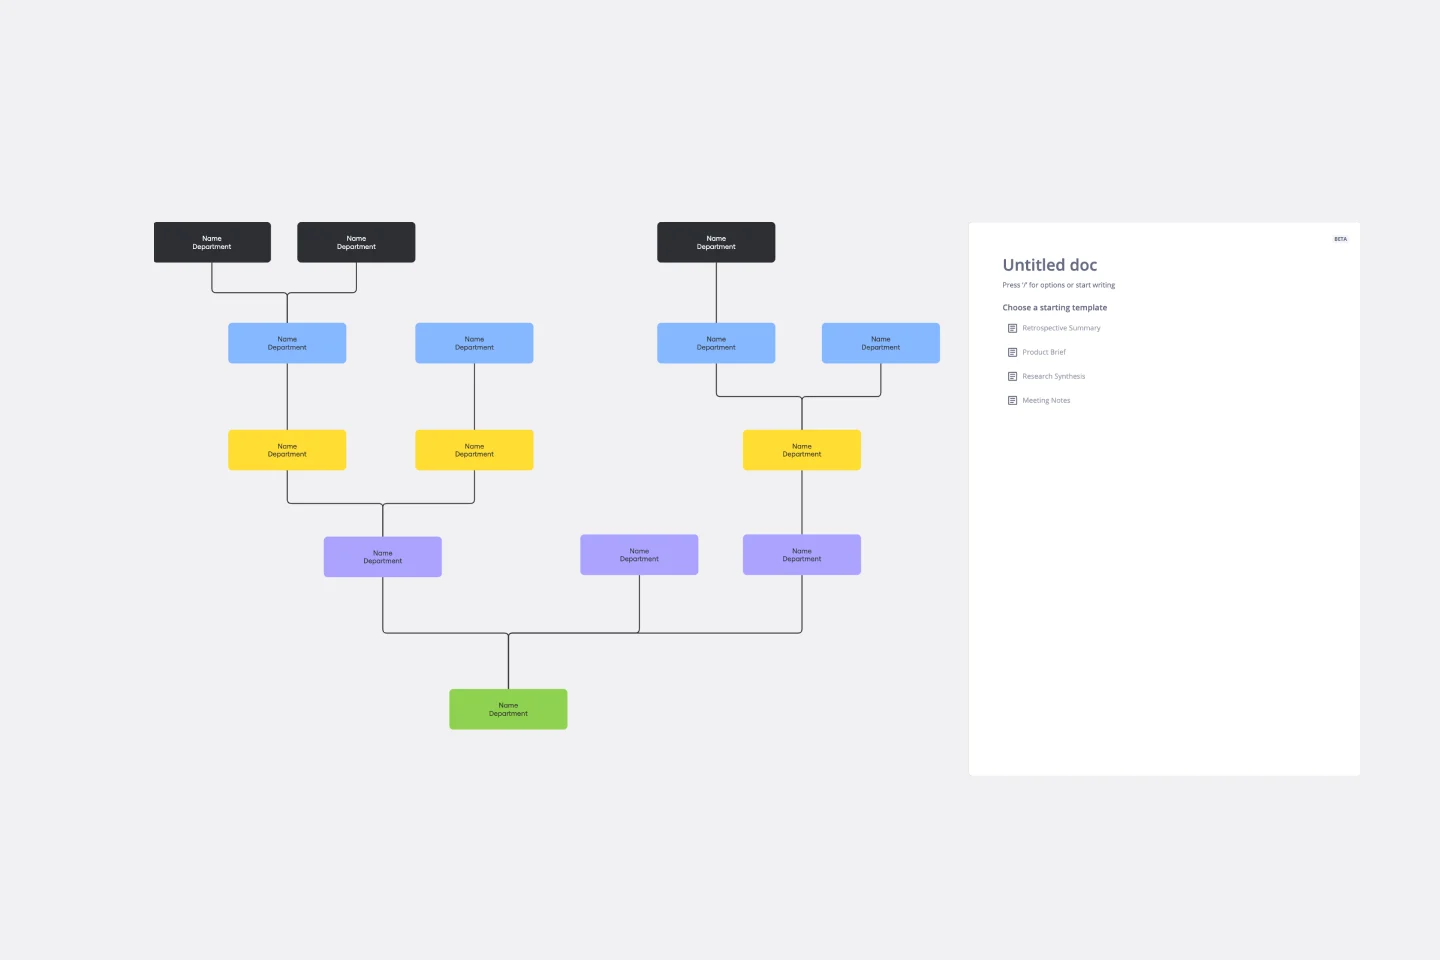
This template offers a structured blueprint of the ICS hierarchy, which can be easily customized per the user's requirements. Each section of the template represents a specific area of responsibility within the ICS, and the sections are connected via connector lines to show the flow of command and reporting lines. With clearly defined roles for each position, from the Incident Commander to the various branches and units, users can navigate the complex ICS web with ease and make necessary modifications according to their specific needs.
How to use the ICS Org Chart Template
Customize the template: Click on any shape or connector line. You'll notice that editing them is straightforward—resize, relabel, or reposition as needed.
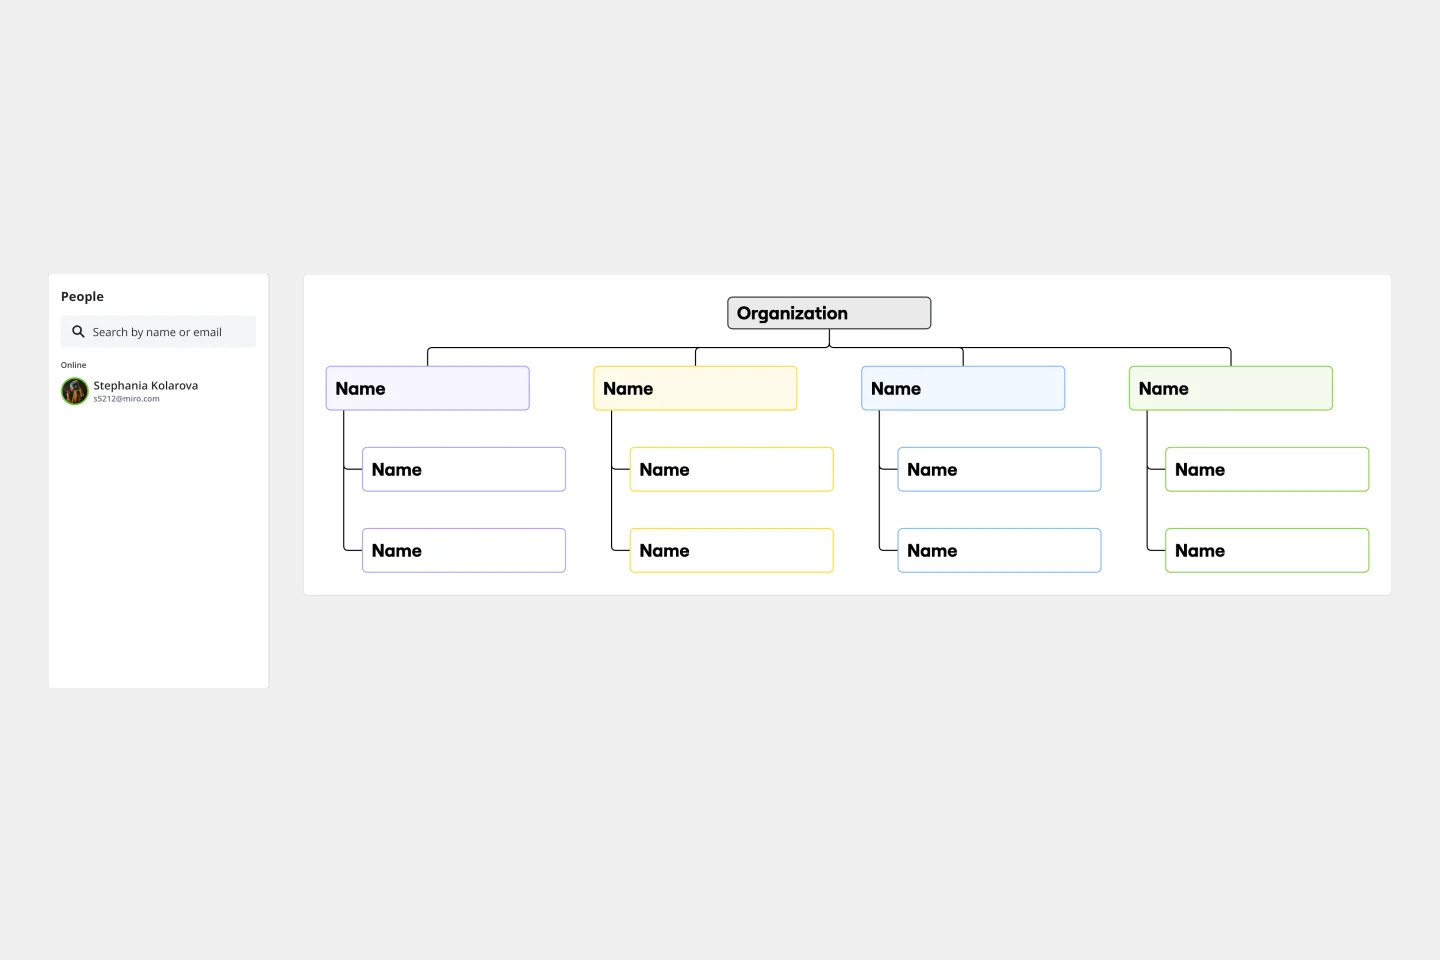
Expand: If your organizational structure requires more layers or units, add more shapes and connect them using the automated diagramming features. This ensures consistency in design and flow.
Add context: To provide more detailed information, you can effortlessly drag and drop any artifact onto the board. Whether it's a document, image, or link, it integrates seamlessly, enriching the context.
Why should you use an ICS Org Chart Template?
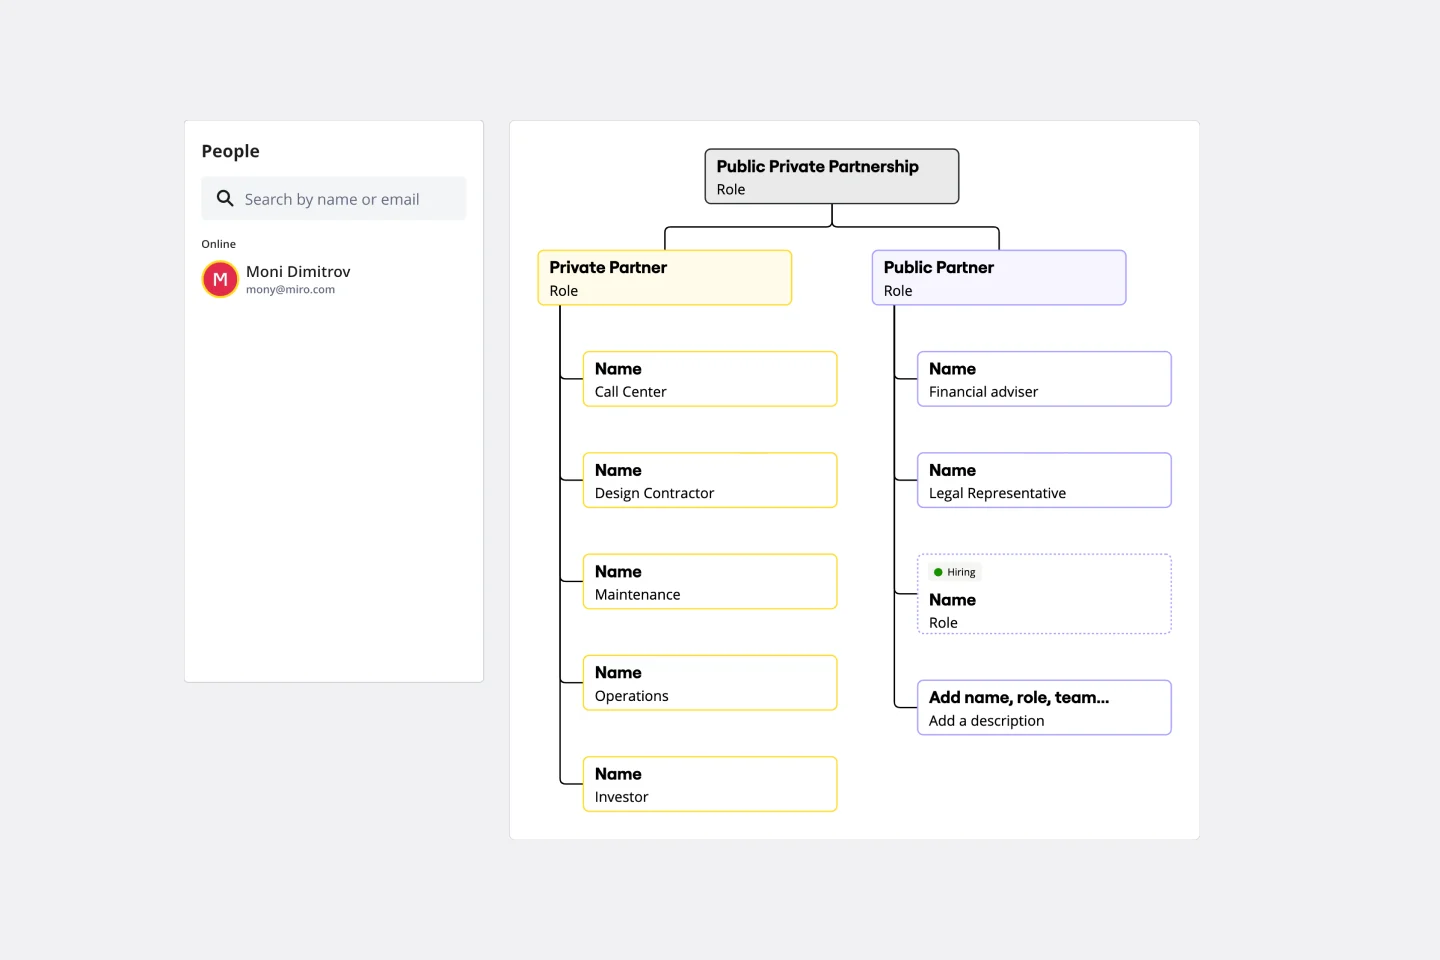
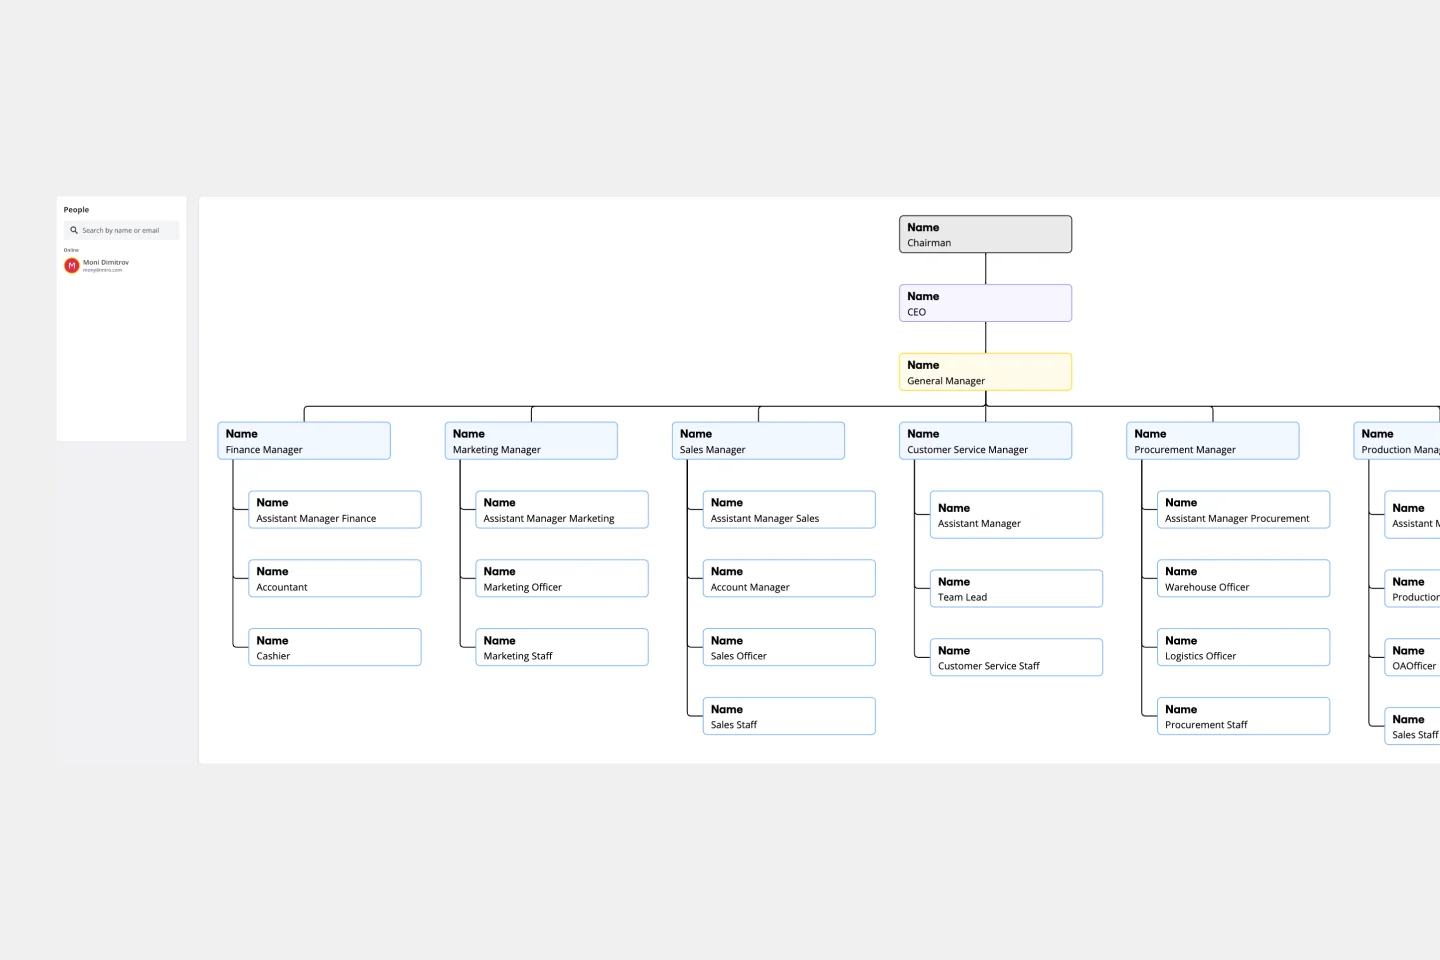
Clarity and visualization: It provides a clear and visual representation of roles and reporting lines, ensuring that everyone understands their responsibilities and who they should report to.
Standardization: It maintains consistency in the representation of the ICS structure, which is essential for effective communication.
Flexibility: Although it offers a standardized view, the template is highly customizable to cater to various organizational needs.
Efficiency: It reduces the time spent on creating an organizational chart from scratch and ensures rapid onboarding of team members for efficient task execution.
Integration: It allows easy addition of external resources, ensuring a comprehensive view of processes and responsibilities.
Miro is the perfect organizational chart builder to help visualize and understand your organization's hierarchical structure and reporting lines between roles. If you're interested in learning more about organizational charts you can read our in-depth guide.
ICS Org Chart FAQs
Can I integrate external links and resources into the chart?
The template allows seamless integration of external artifacts, providing a richer context.
How many levels can I add to the chart?
The template is flexible, allowing you to add as many levels as required by your organizational structure.
Is the template suitable for organizations outside the U.S.?
While the ICS system originates from the U.S., the principles of organization and structure are universal. The template can be adapted and used by organizations globally.
Do I need prior knowledge of ICS to use this template?
While prior knowledge is helpful, the template is intuitive enough for those unfamiliar with ICS, serving as both a learning tool and an organizational asset.