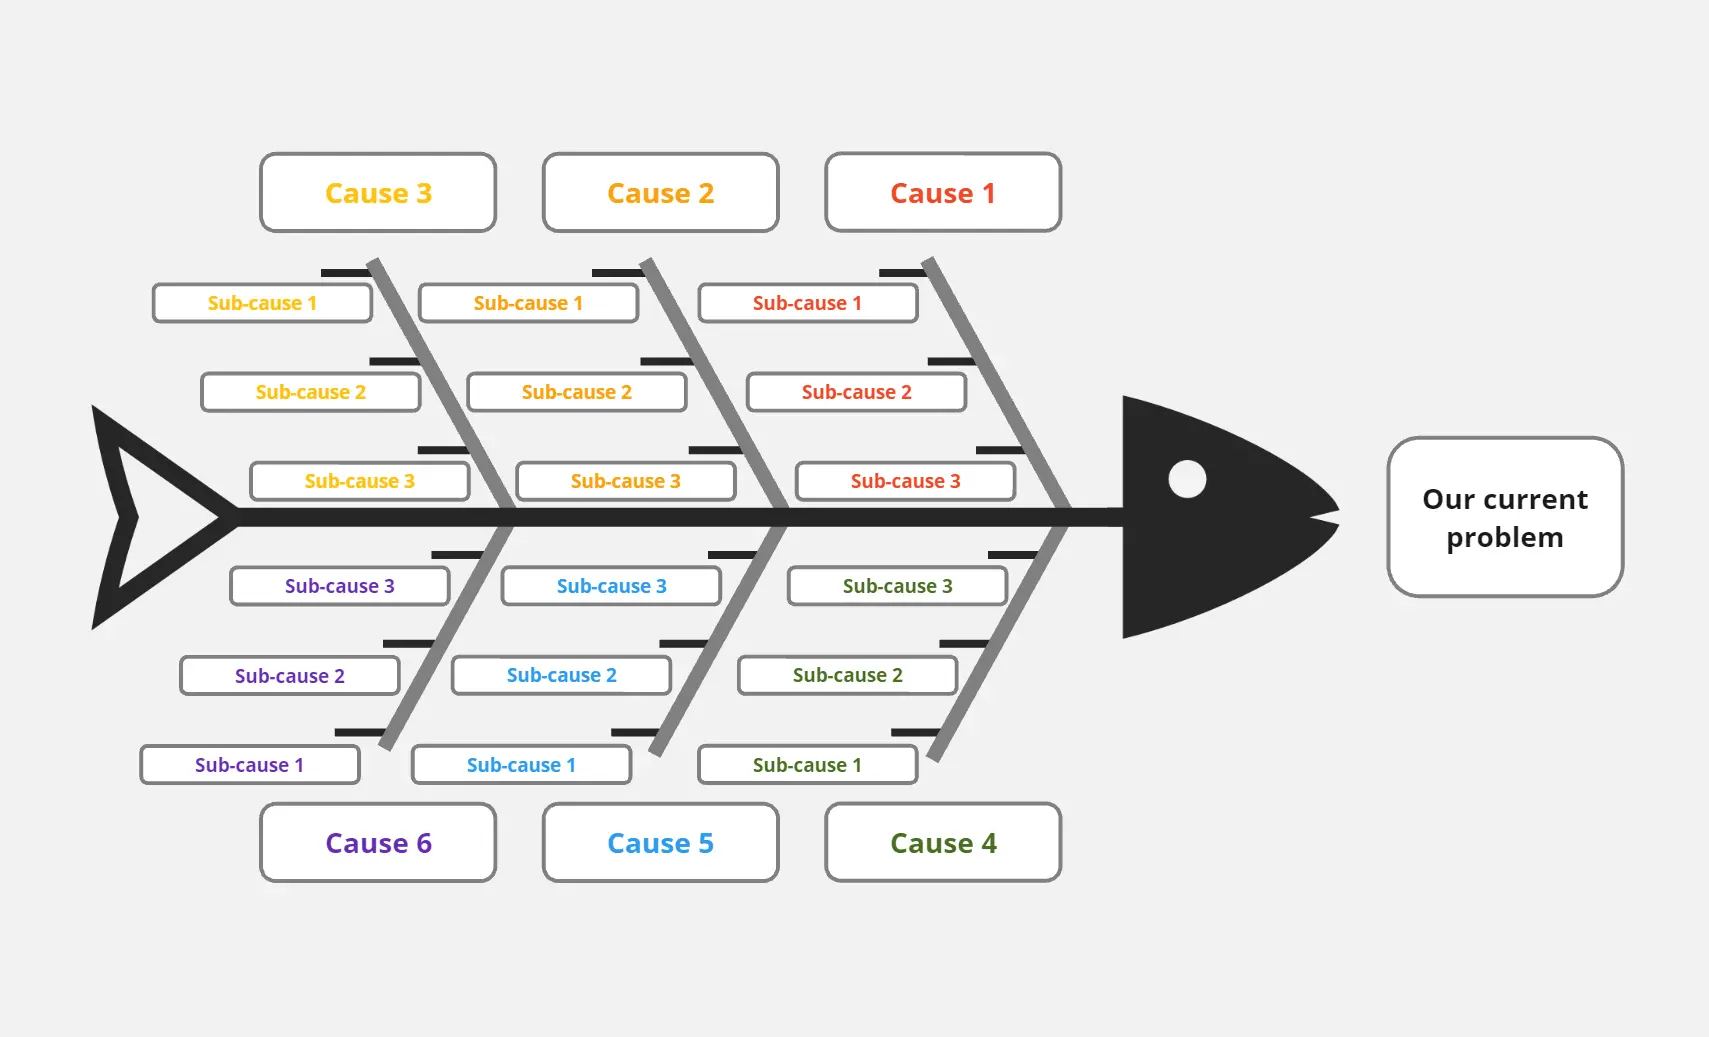
What Is a Fishbone Diagram for Workflow Improvement?
A Fishbone Diagram for Workflow Improvement (also known as an Ishikawa or Cause-and-Effect Diagram) is a visual blueprint that categorizes the potential causes of a specific problem, such as low productivity or high lead times. By breaking down issues into Methods, Machines, Manpower, Measurement, Materials, and Environment, it provides teams with a structured way to identify the root source of workflow inefficiency.
What Problem Does the Fishbone Diagram for Workflow Improvement Solve?
This template addresses common operational pain points:
Identifies Hidden Bottlenecks: Uncovers the real reasons behind project delays beyond surface-level symptoms.
Eliminates Guesswork: Moves teams from "guessing" to "analyzing" by organizing causes into logical categories.
Reduces Process Waste: Targets specific areas (like excessive handoffs or manual tasks) to lean out the workflow.
Standardizes Problem Solving: Provides a repeatable framework for retrospectives and continuous improvement cycles.
Facilitates Team Alignment: Visualizes complex interdependencies so all stakeholders understand the "why" behind process changes.
How to Use the Fishbone Diagram for Workflow Improvement Template
Define the Problem: Place your main workflow issue (e.g., "High Lead Time") at the "head" of the fish.
Brainstorm Categories
Perform Deep Dives: For each major bone, list specific factors or "ribs" contributing to the problem.
Apply the 5 Whys: Drill down into specific causes to reach the ultimate root cause.
Workflow Improvement Fishbone Diagram FAQs
When should I use this diagram instead of a simple list?
Use it when a problem is complex, recurring, or involves multiple departments where the root cause isn't immediately obvious.
Can this template be used for Agile or DevOps workflows?
Absolutely. It is highly effective for Sprint Retrospectives or Post-Mortems to analyze why a release or sprint didn't meet its goals.