Fishbone Diagram for Sales
Template Description
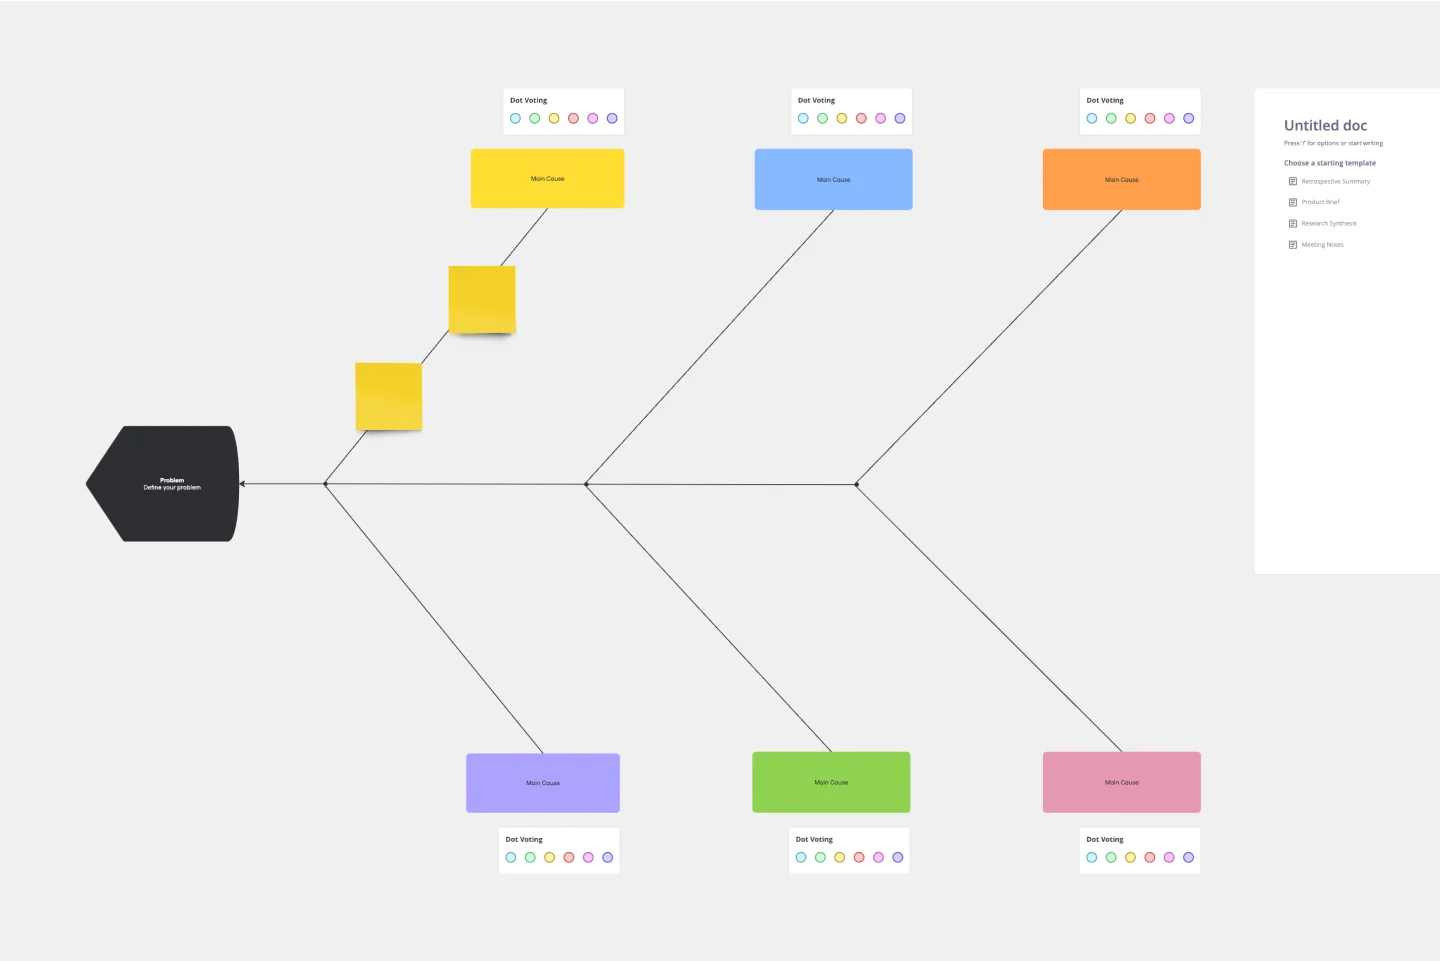
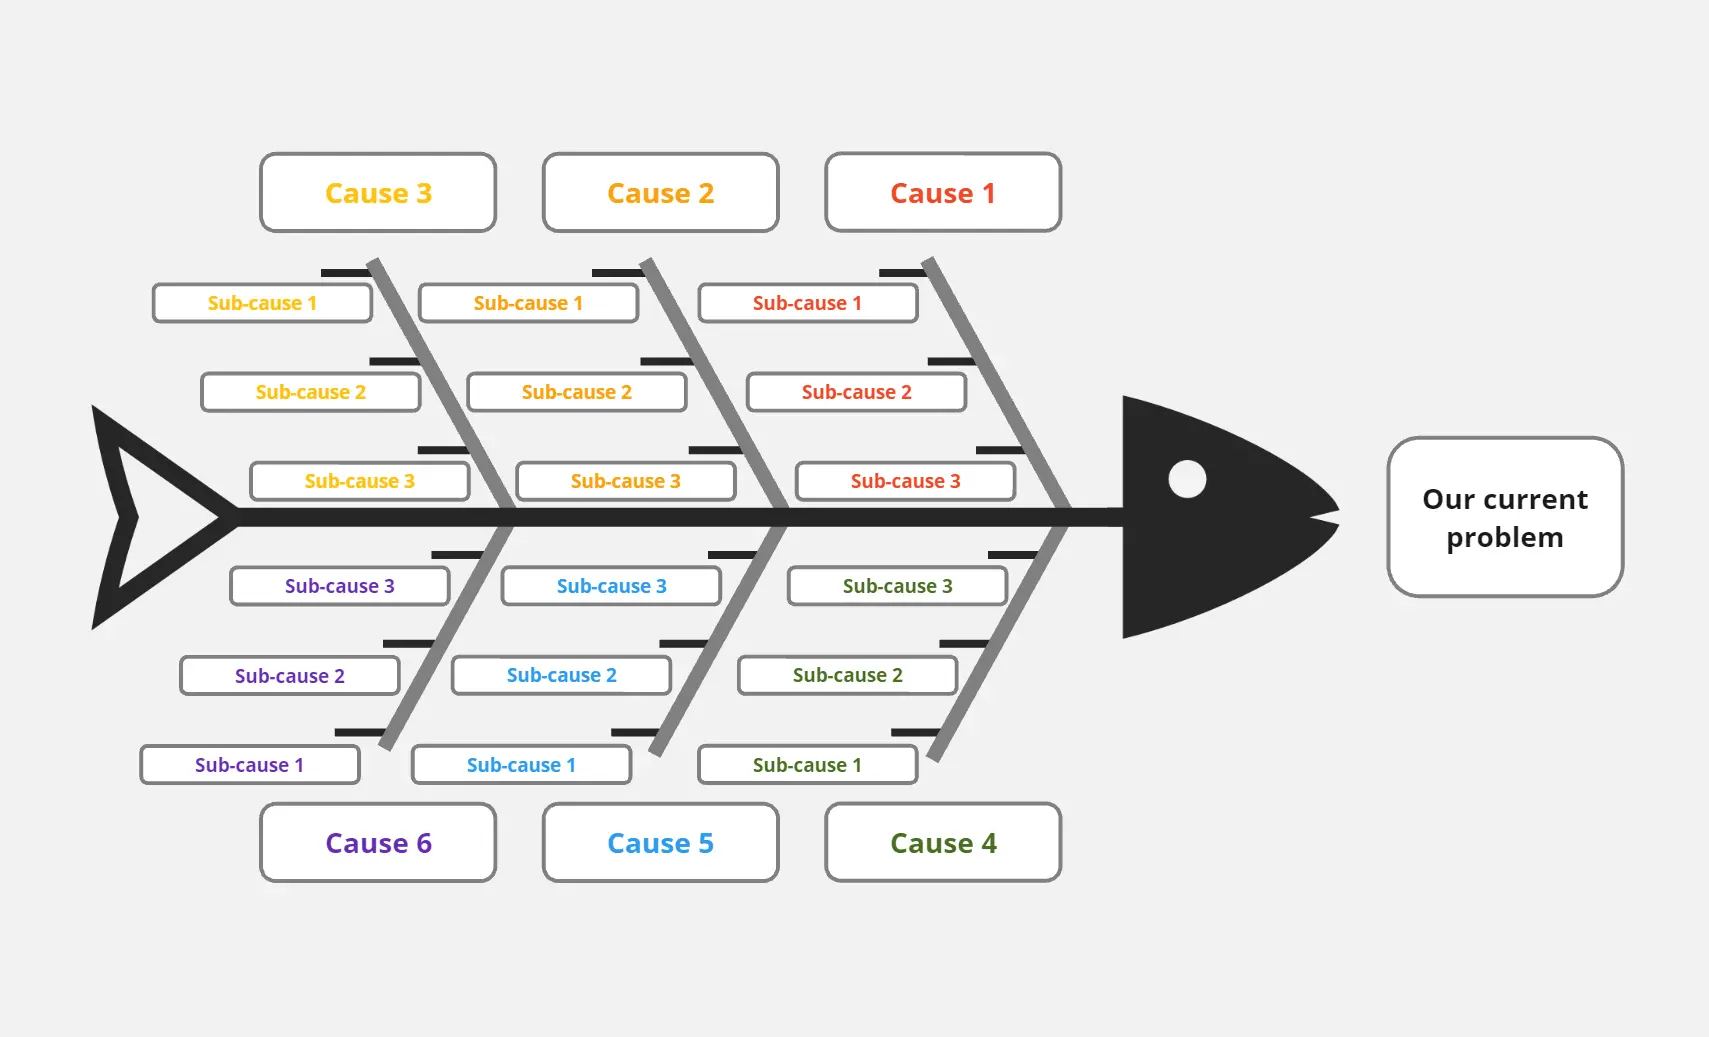
A fishbone (Ishikawa) diagram for root cause analysis with five main category branches (Samples, Schemes, Synchronous, Skin, Search) extending from a central spine. Each main category has three sub-branches for specific contributing factors. The spine leads to a triangle representing the problem or outcome being analyzed. Users replace "Write Text" placeholders with relevant causes specific to their problem statement.
Example
A completed fishbone diagram analyzing "Low Q4 Conversion Rate" in sales. Categories include: Samples (limited demo inventory, outdated products, long turnaround), Schemes (complex pricing, unclear discounts, commission confusion), Synchronous (excessive meetings, time zone conflicts, no prep time), Skin (inconsistent branding, outdated collateral, poor visuals), and Search (weak SEO, hard-to-find info, poor knowledge base).
Cheers!
Khawaja Rizwan