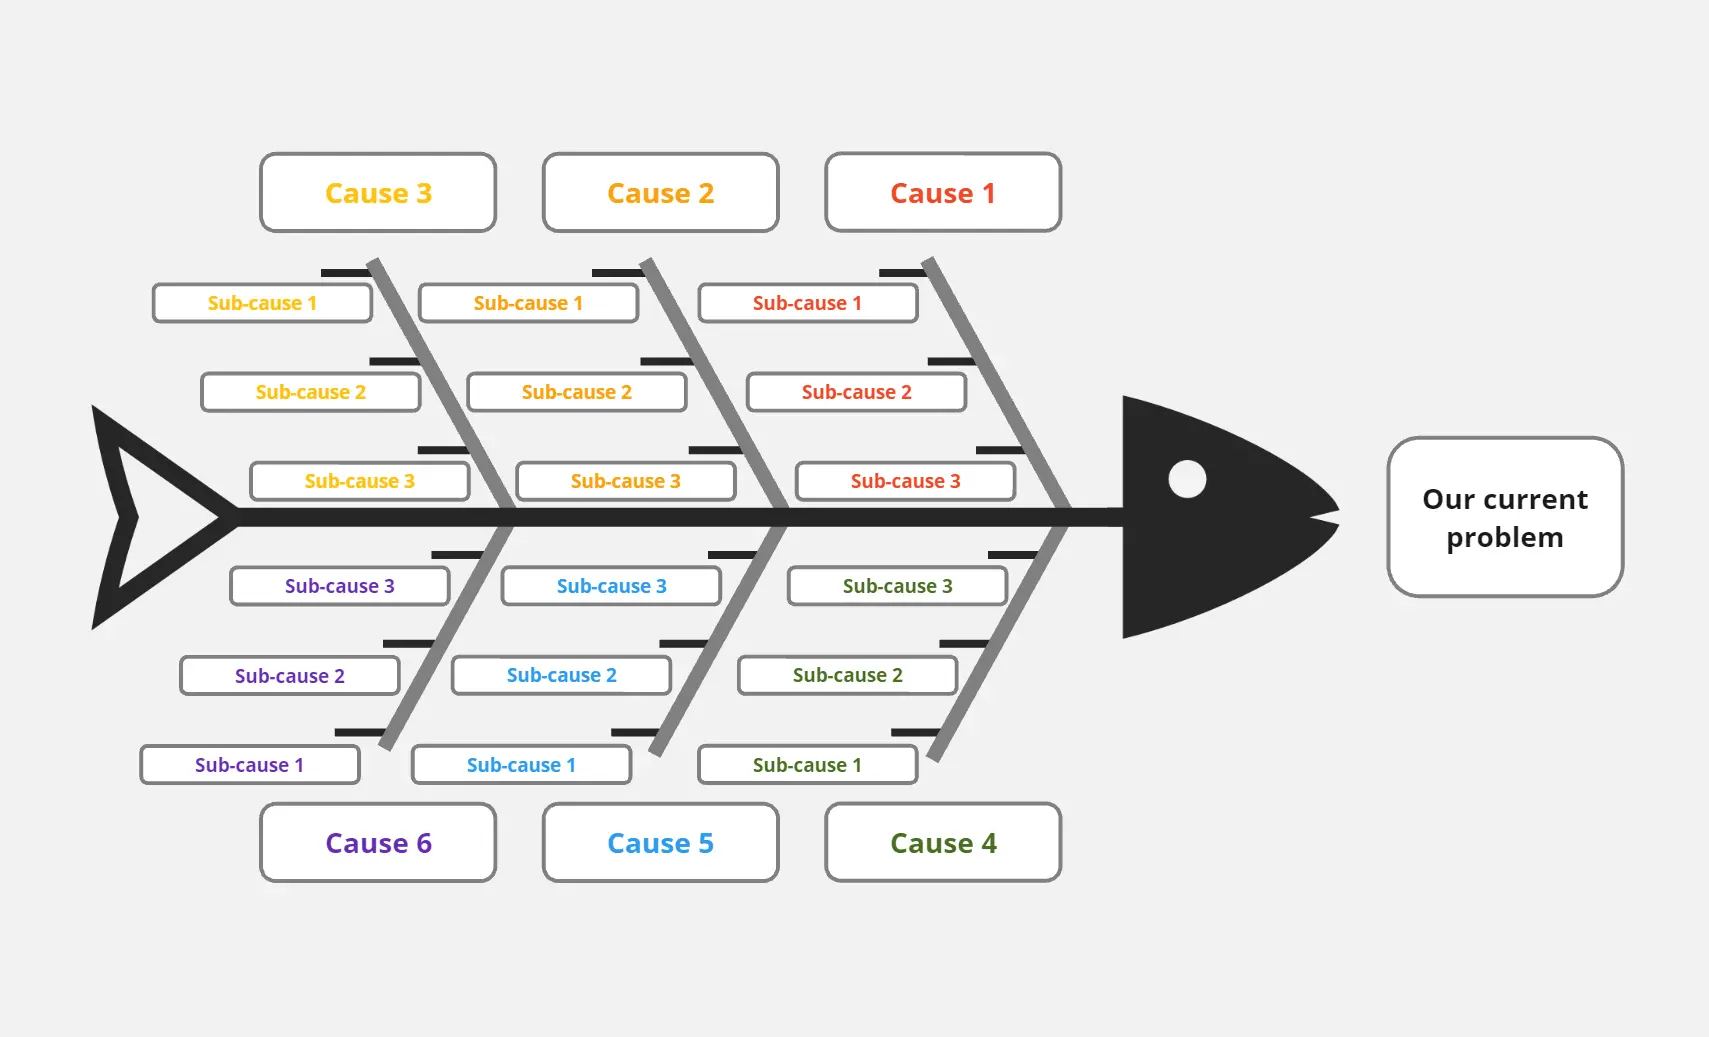
This fishbone diagram helps teams work through a problem by identifying possible causes. In the shape of a fish, this visual tool can be used to track defects and points of improvement through the bones feeding into the spine and towards the head of the fish, which contains the problem being analyzed. The following elements make up the diagram:
Problem: The matter or item that is being analyzed
Materials: Objects or tools that contribute to the problem
Measurement: Techniques or tools to measure performance or quality
Methods: Support processes that create the problem as a byproduct of their implementation
Environment: External factors that may have a direct or indirect effect on the problem
Machines: Equipments used in a specific process
People: Certain teams or individuals whose actions are contributing to the problem
While the above are the basic categories in a fishbone diagram, they can be customized and tweaked to have the categories that you need to cover different aspects of the problem.