What is a Chain Analysis Template?
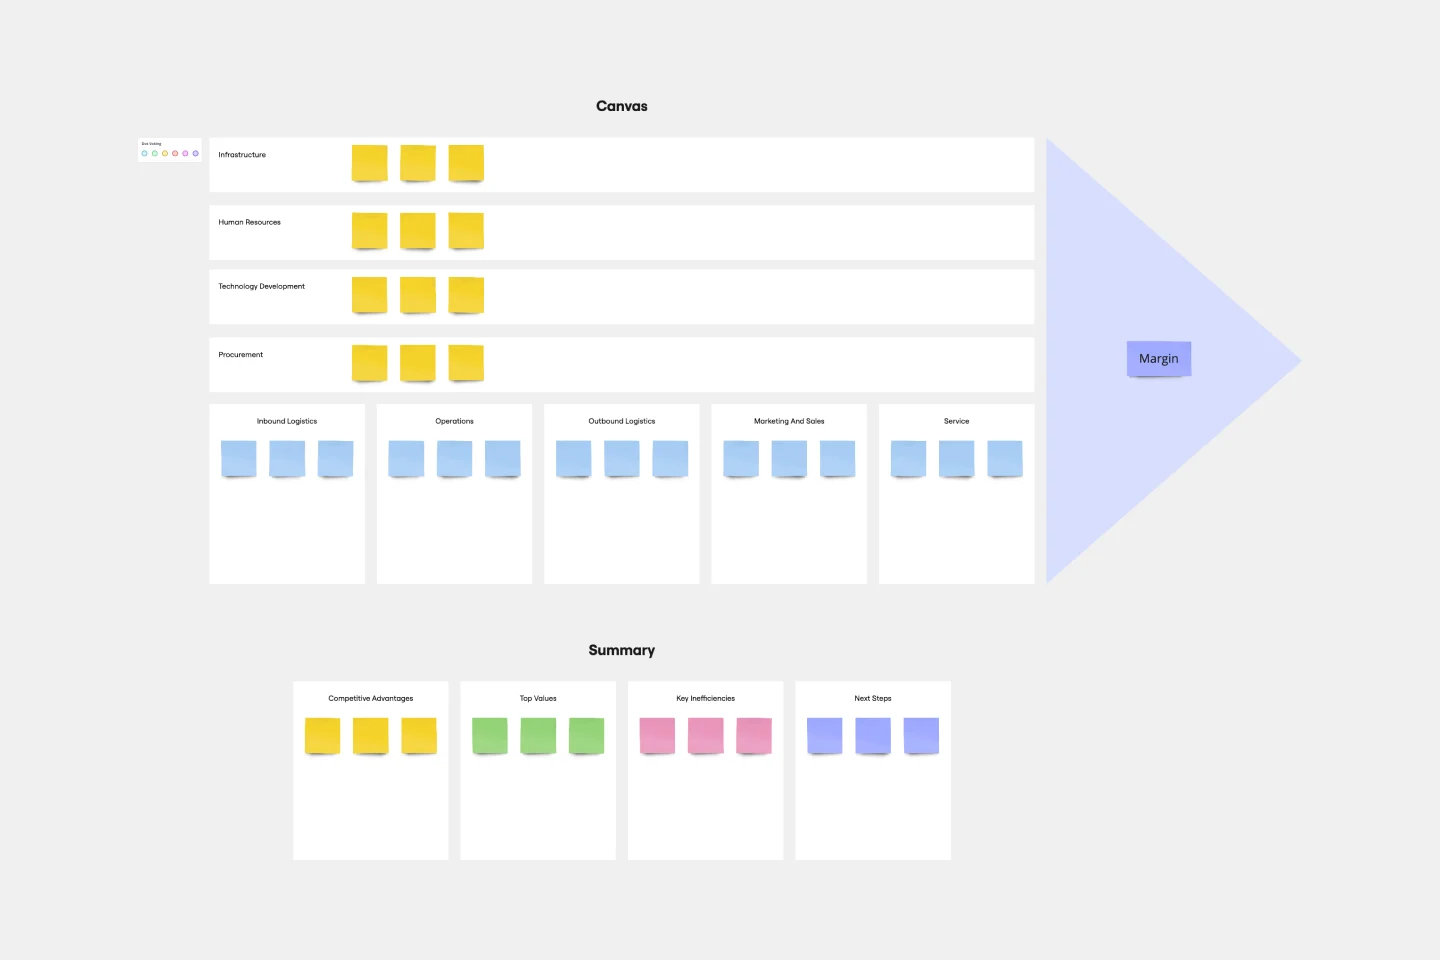
A chain analysis template is a visual model of the end-to-end process of delivering a product or service. It segments a business into Primary Activities (the physical creation and sale) and Support Activities (the infrastructure that allows it to happen). By analyzing each link, leadership can determine if they should Outsource, Automate, or Innovate specific sections of the chain to outperform competitors.
The "Value-Added" Audit: 3 Ways to Identify Profit Leaks
A chain is only as valuable as the margin it protects. Before finalizing your strategic board, apply these three expert "health checks":
1. The "Support Activity" Transparency Audit
The Audit: Are you treating "Human Resources" or "Procurement" as mere costs rather than value-drivers? The Fix: Audit for Cross-Functional Impact. In a professional value chain, support activities (like Technology Development) are the "force multipliers" for primary activities. If your template doesn't show how your R&D department makes your "Outbound Logistics" cheaper or faster, you are missing the systemic value of your overhead.
2. The "Link Interdependency" Test
The Audit: Are you optimizing one department (e.g., Manufacturing) in a way that hurts another (e.g., Marketing)? The Fix: Audit for Sequence Friction. A high-level business chain analysis identifies the "Handshakes" between links. For example, if "Inbound Logistics" buys cheaper raw materials to save money, it might increase "Operations" costs due to higher defect rates. Your template must track the Total Cost of Ownership, not just departmental budgets.
3. The "Competitive Benchmarking" Guardrail
The Audit: Is your chain analysis based on internal data only? The Fix: Audit for Strategic Positioning. Use your template to compare your "Value Curve" against the industry leader. Do you have a "Link" they don't have? Or are you spending 20% more on "Service" than the market average? A business chain analysis is a diagnostic tool to find your Sustainable Competitive Advantage.
Strategic Frameworks: The Business Chain Toolkit
Select the template that matches your specific operational focus:
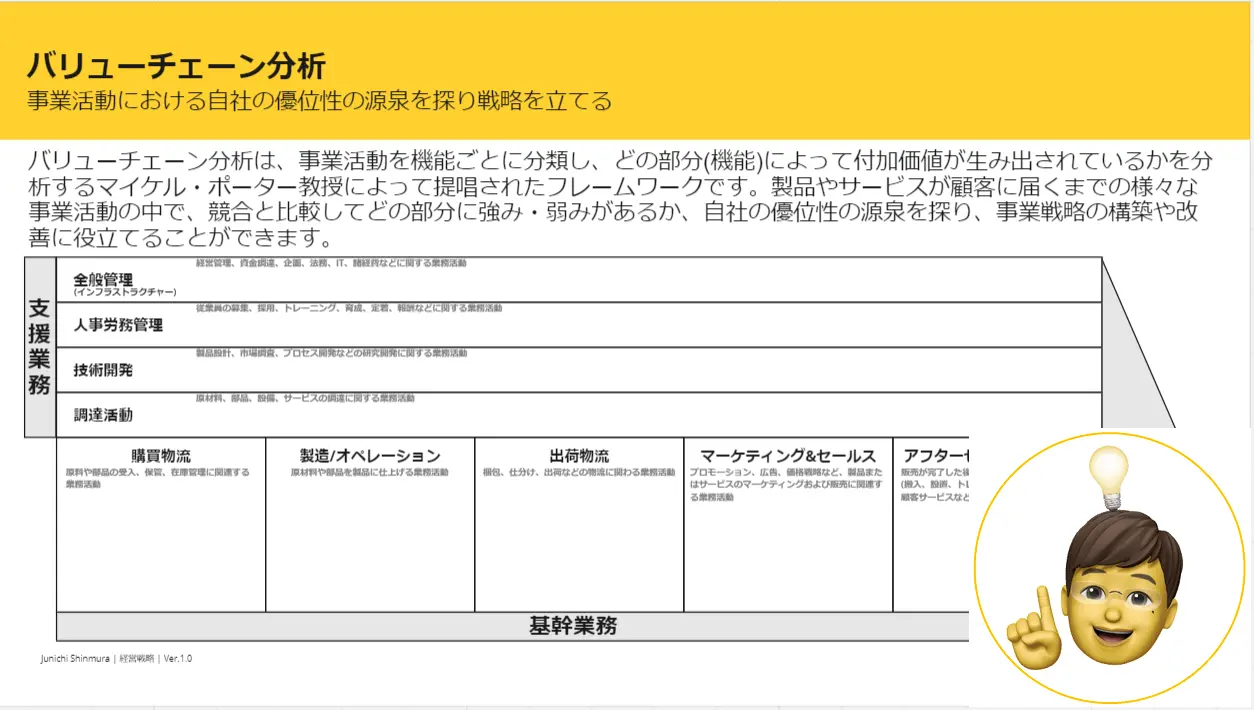
1. Porter’s Value Chain (The Classic)
Best For: Corporate strategy and identifying profit margins.
The Goal: To map the five primary activities (Inbound, Ops, Outbound, Marketing, Service) against the four support activities (Infrastructure, HR, Tech, Procurement).
2. The Supply Chain "Spider" Map
Best For: Logistics and Risk Management.
The Goal: To visualize the Tier 1, Tier 2, and Tier 3 suppliers to identify Geopolitical Risks or Single-Source Vulnerabilities.
3. The Customer Value Chain (CVC)
Best For: Product-led growth and B2C companies.
The Goal: To map the customer’s journey—from Evaluating and Buying to Using and Disposing—to find where the customer "pays" with time, effort, or money.
Key Components of a Business Chain Template
A high-performance Business Chain Board requires these five core elements:
Primary Activity Lanes: Clear categories for the physical flow of goods.
Support Activity Rows: The underlying corporate functions that enable production.
The "Margin" Indicator: A visual representation of the difference between total value created and the collective cost of activities.
The "Waste" Marker: Red zones indicating where a link is consuming more resources than the value it produces.
The "Innovation" Star: Points where a proprietary technology or process gives the company a "Moat" against competitors.