0 likes
50 uses
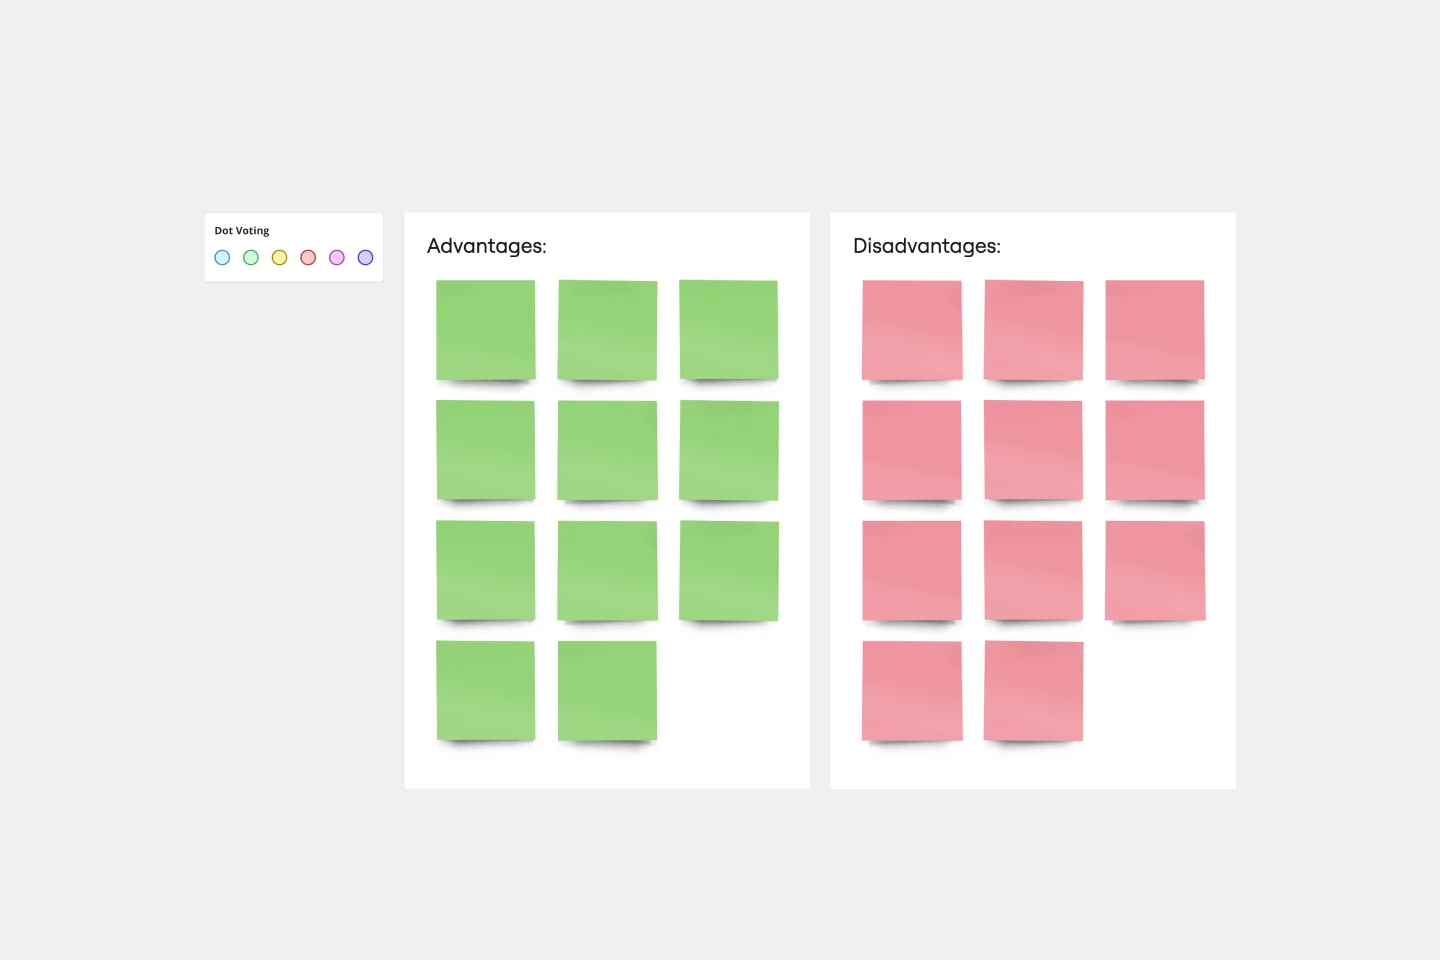
T-Chart Template
T-Charts can help you compare and contrast two different ideas, group information into different categories, and prove a change through “before” and “after” analysis. T-Charts are visual organizational tools that enable you to compare ideas, so you can evaluate pros and cons, facts and opinions, strengths and weaknesses, or big-picture views versus specific details. Designers and content creators can use T-Charts to turn possibilities into actionable ideas. T-Charts are useful for discussing differences and similarities with your team or clients and can help you to reach a decision together.