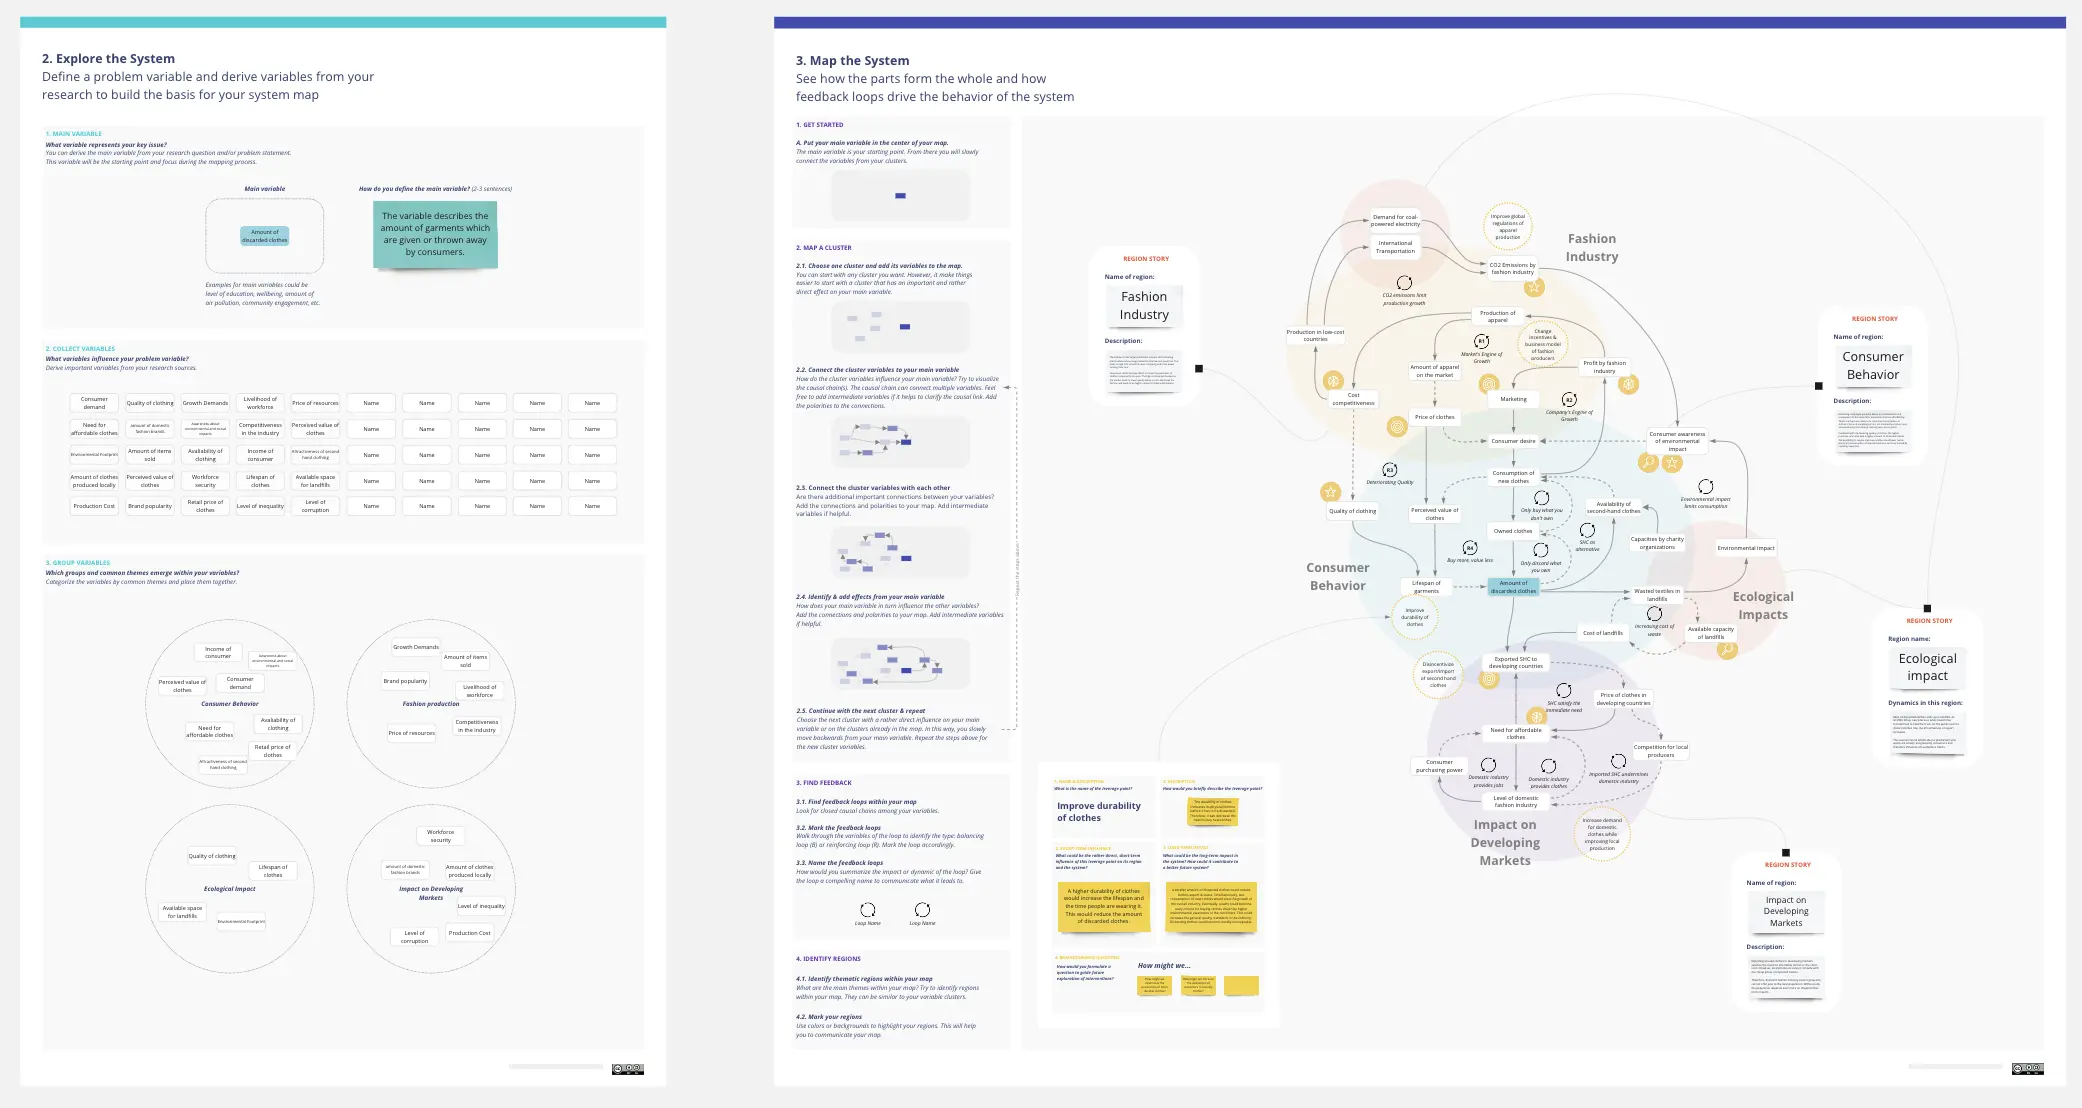
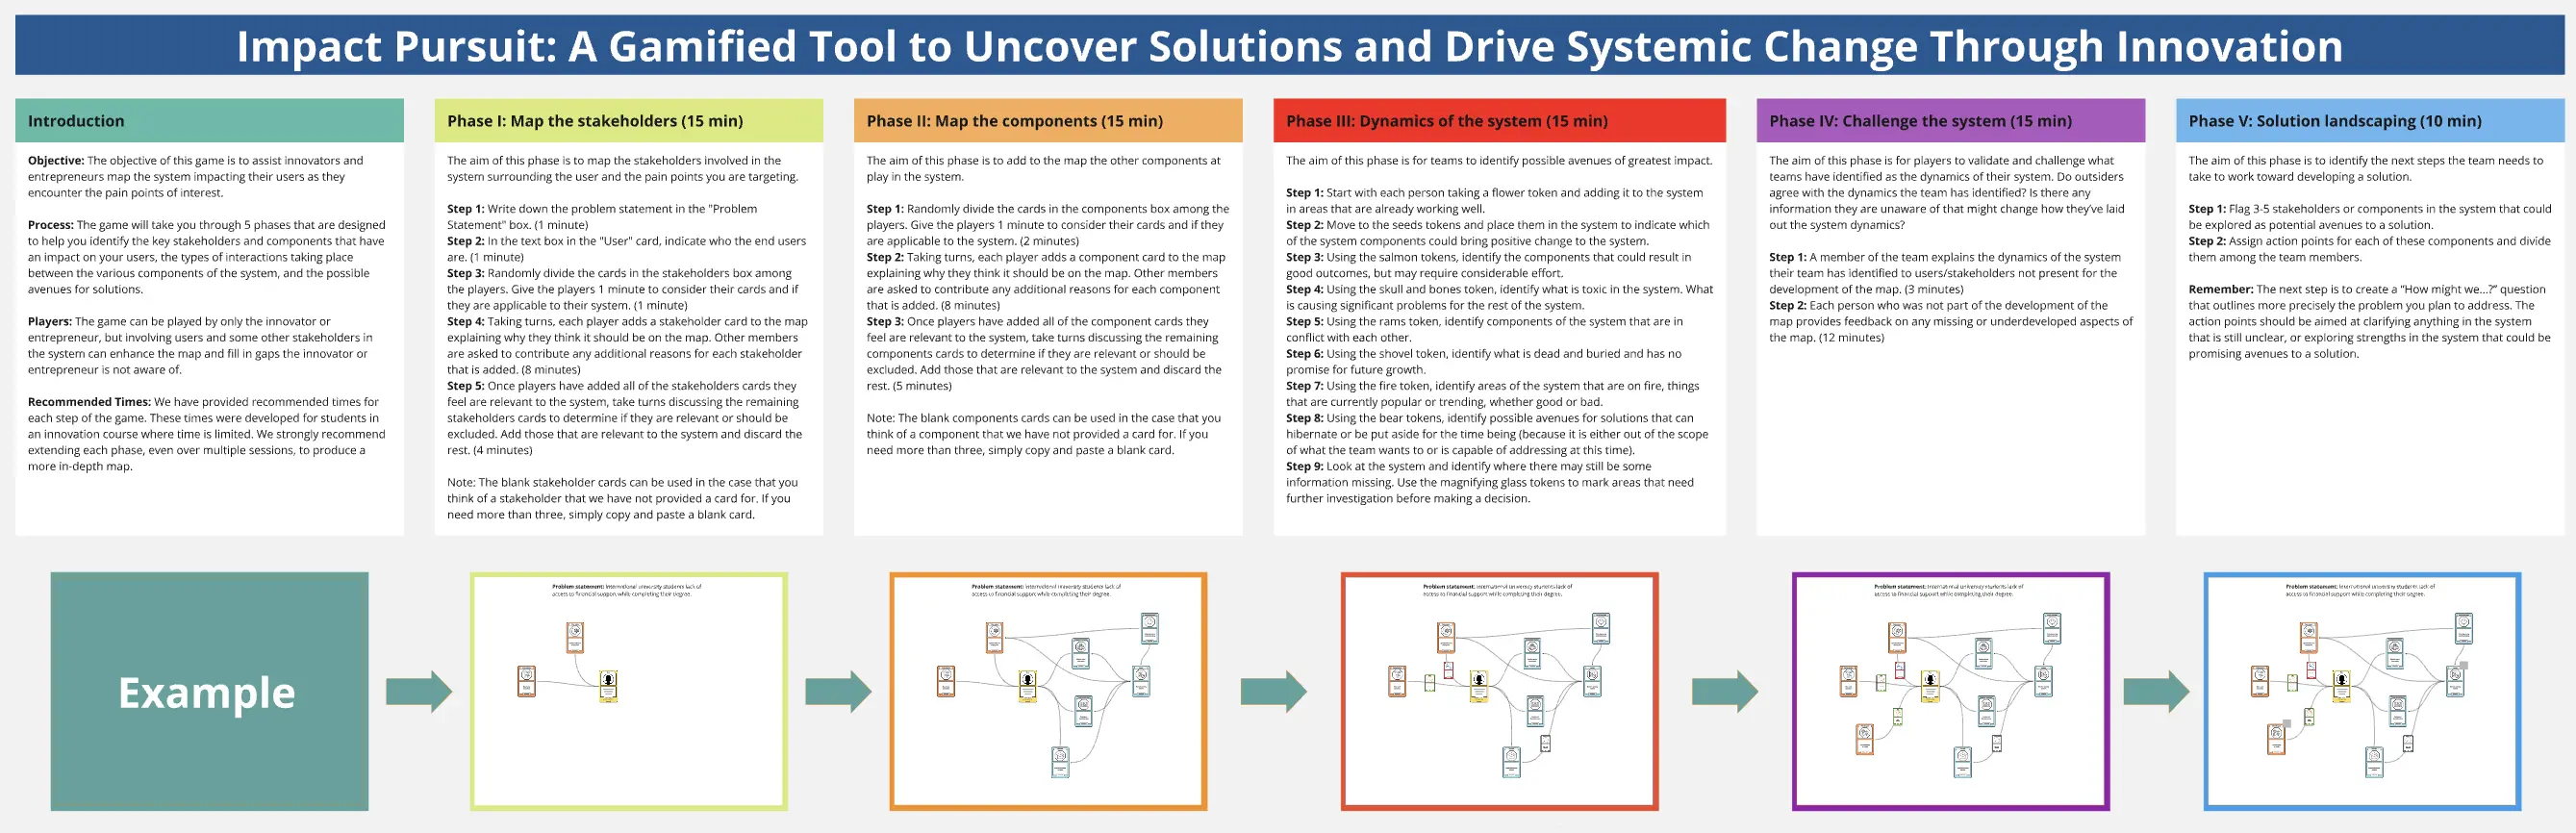
What is a System Mapping Template?
A system mapping template is a visual tool used to represent the "Macro View" of a problem or an organization. Unlike a process map (which is linear), a system map is non-linear; it captures the web of relationships between people, technology, data, and external forces. It is used to identify "Bottlenecks," "Siloes," and "Vicious Cycles" that are often invisible when looking at individual departments or components in isolation.
The "Holistic" Audit: 3 Ways to See the Whole Picture
A system map is only useful if it reveals the "Why" behind a recurring problem. Before finalizing your map on Miro or Kumu, apply these three expert "health checks":
1. The "Feedback Loop" Audit
The Audit: Is your map just a series of "one-way" arrows? The Fix: Audit for Circular Logic. Systems are rarely linear. A professional template must identify:
Reinforcing Loops (R): Changes that build on themselves (e.g., more users leading to more data, leading to a better product).
Balancing Loops (B): Changes that resist movement (e.g., a "burnout" loop where high productivity leads to exhaustion, which lowers productivity). If you don't find the loops, you haven't mapped a system; you've mapped a sequence.
2. The "Unintended Consequence" Test
The Audit: Are you only mapping the "Happy Path" where everything works as intended? The Fix: Audit for Systemic Side Effects. Use your template to ask: "If we optimize this one part, what breaks somewhere else?" For example, increasing sales volume might break the customer support system. A high-level system map identifies the "Delayed Effects" that occur elsewhere in the web.
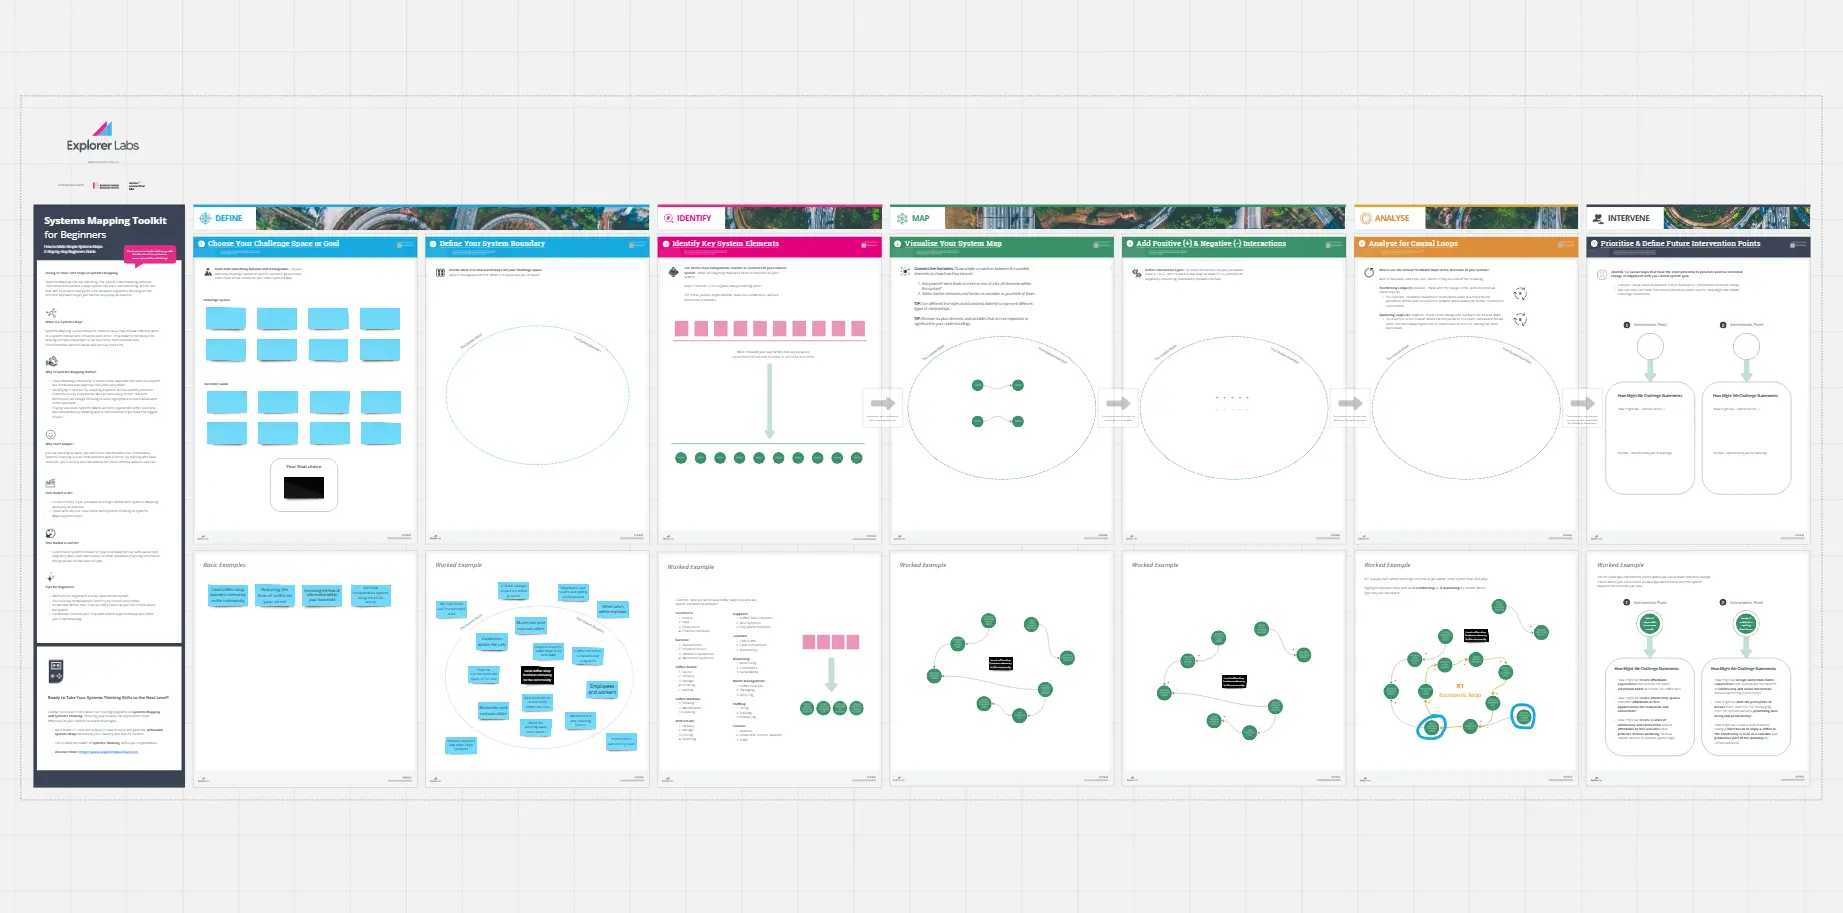
3. The "Boundary" Guardrail
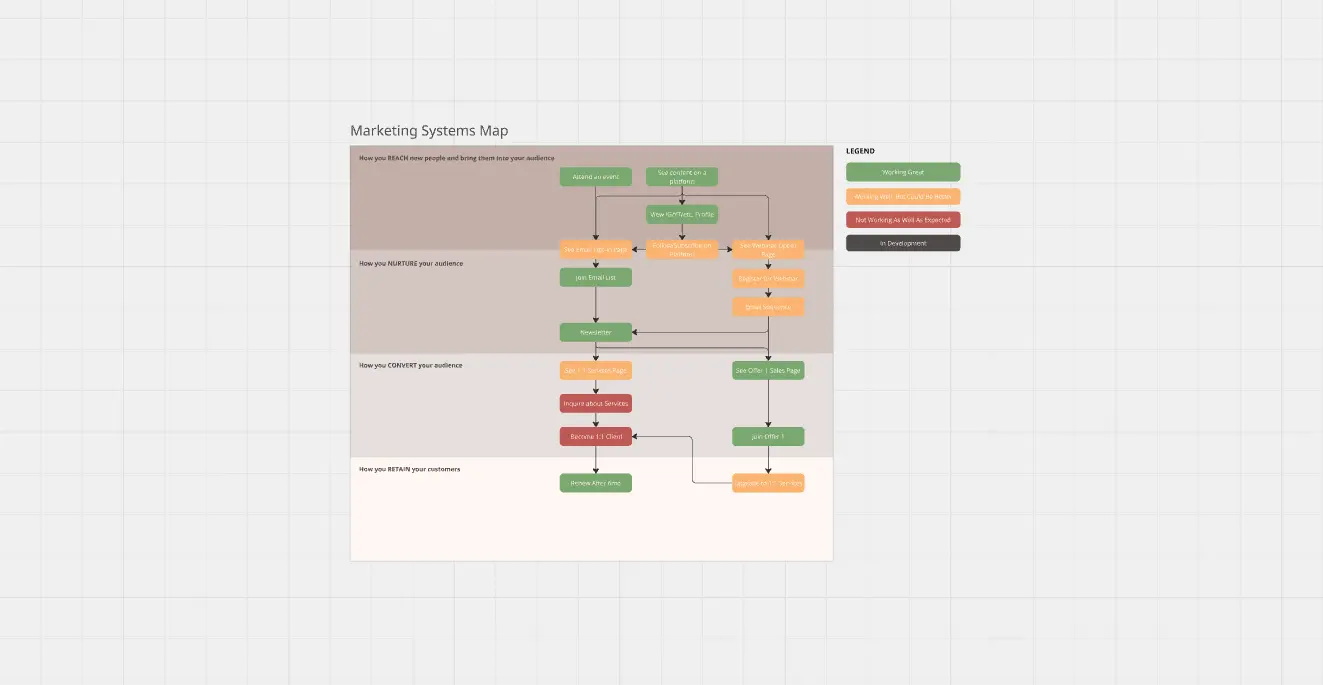
The Audit: Are you trying to map the entire universe in one go? The Fix: Audit for Scope. A professional system map defines its Boundaries. Clearly mark what is "In-System" (things you can control) and what is "Environment" (external forces like regulation or market trends that you can only react to). This prevents the map from becoming too messy to be actionable.
Strategic Frameworks: Which System Map Do You Need?
Select the framework that matches the complexity of your challenge:
The Causal Loop Diagram (CLD):
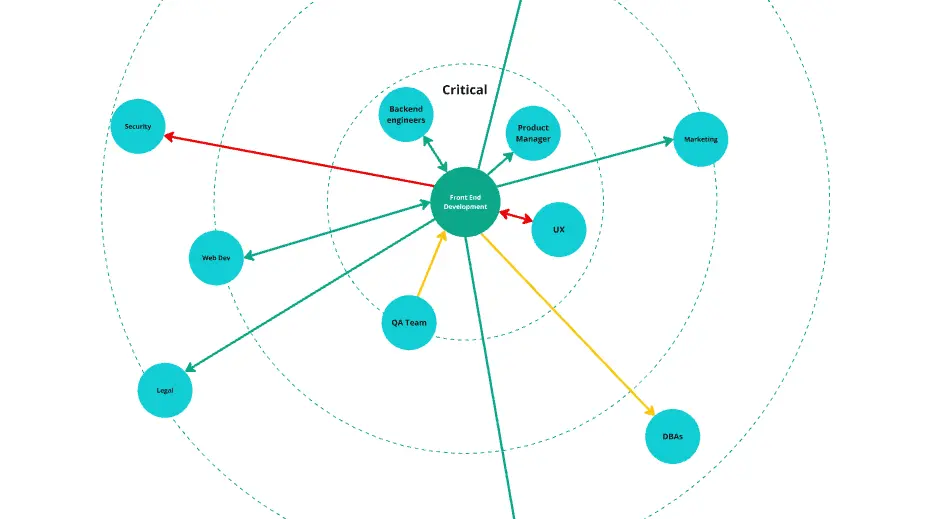
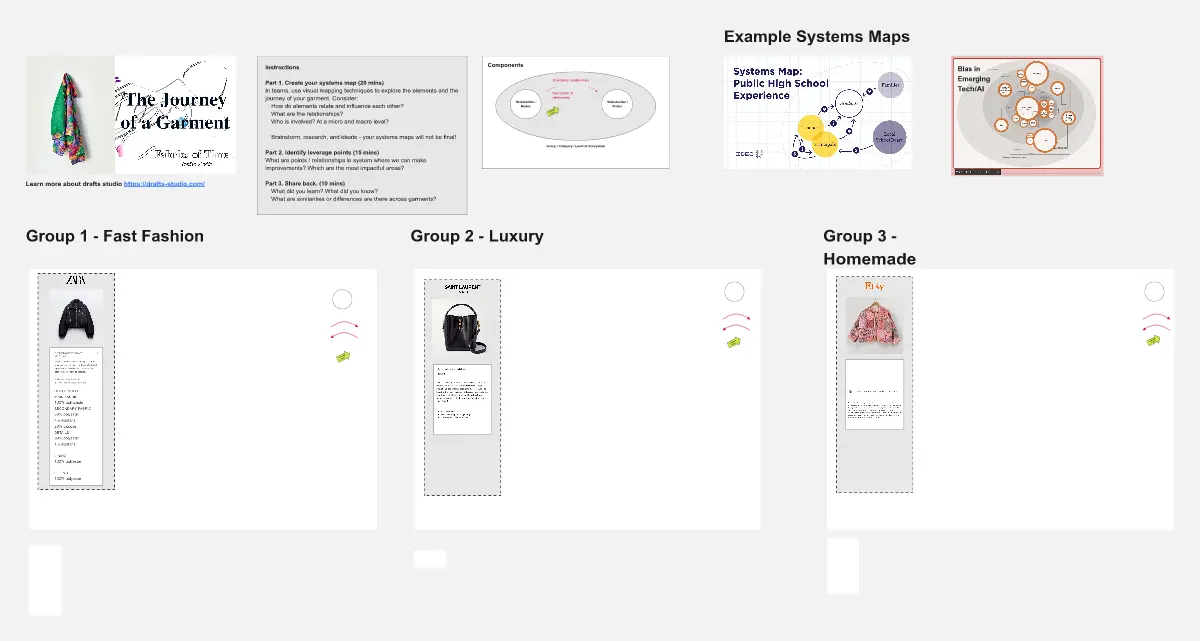
The Stakeholder Map:
The SIPOC Map (Supplier, Input, Process, Output, Customer):
The Ecosystem Map:
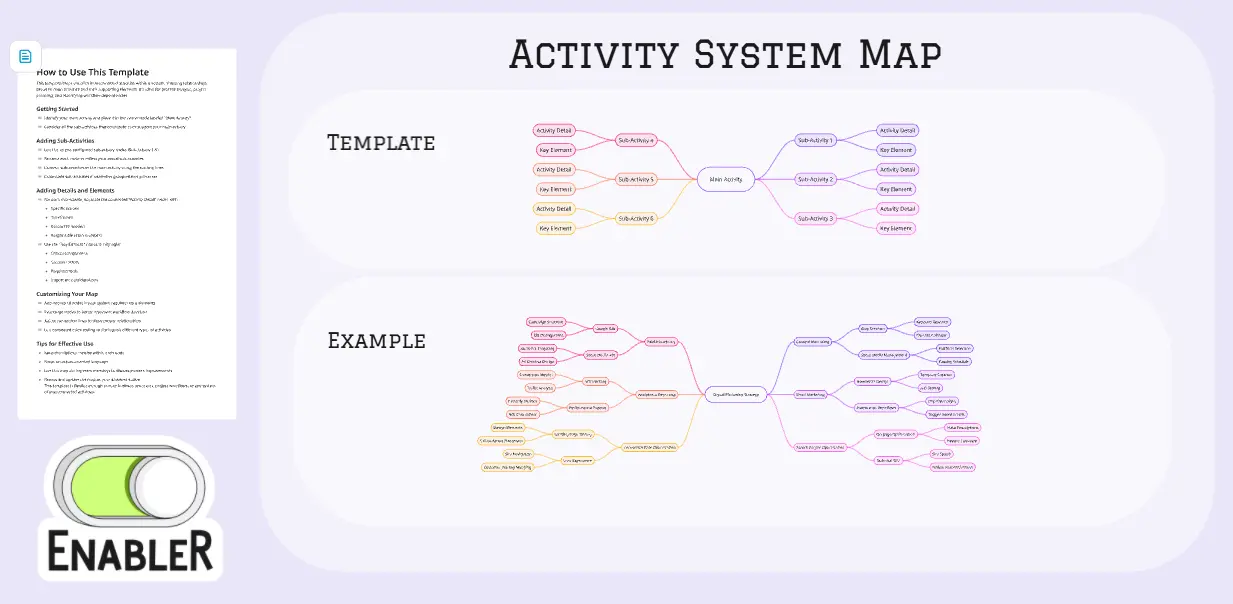
Key Components of a System Mapping Template
A high-performance System Board requires these five core elements:
Nodes (Entities): The "Parts" of the system (e.g., Users, Database, Government, Budget).
Edges (Relationships): The lines connecting nodes, often labeled with "+" (increases) or "-" (decreases) to show the type of influence.
Delays: A visual marker (often a double hash on a line) showing where an effect takes a long time to manifest.
The "Leverage Points": Starred areas where a small change can create a massive positive ripple effect across the whole system.
Mental Models: A section at the bottom explaining the "Beliefs" that keep the current system running the way it does.