A research project Gantt chart helps researchers, designers and product managers visualize study timelines, coordinate team activities and track deliverables from kickoff to final presentation. This template streamlines project planning so you can focus on generating insights rather than managing schedules.
What Is a Research Project Gantt Chart for Researchers and Designers?
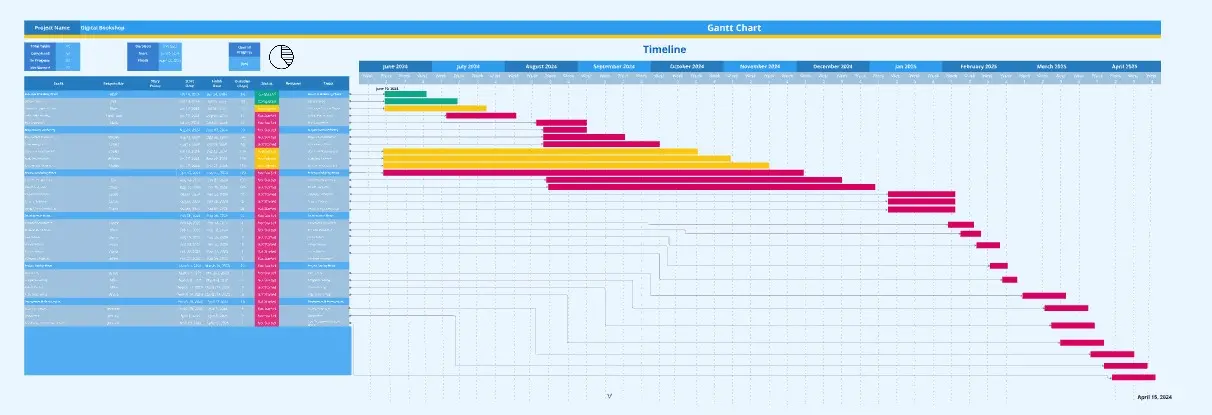
A research project Gantt chart is a visual timeline tool that maps research phases, milestones and dependencies across your study. It displays participant recruitment, data collection, analysis and synthesis activities on a time-based grid, helping research teams stay aligned on deliverables.
What Problems Does a Research Project Gantt Chart Solve?
This template eliminates common research planning challenges:
Unclear timelines causing missed recruitment windows
Overlapping activities that overwhelm research teams
Stakeholder misalignment on deliverable dates
Poor visibility into research progress
How to Use the Research Project Gantt Chart Template
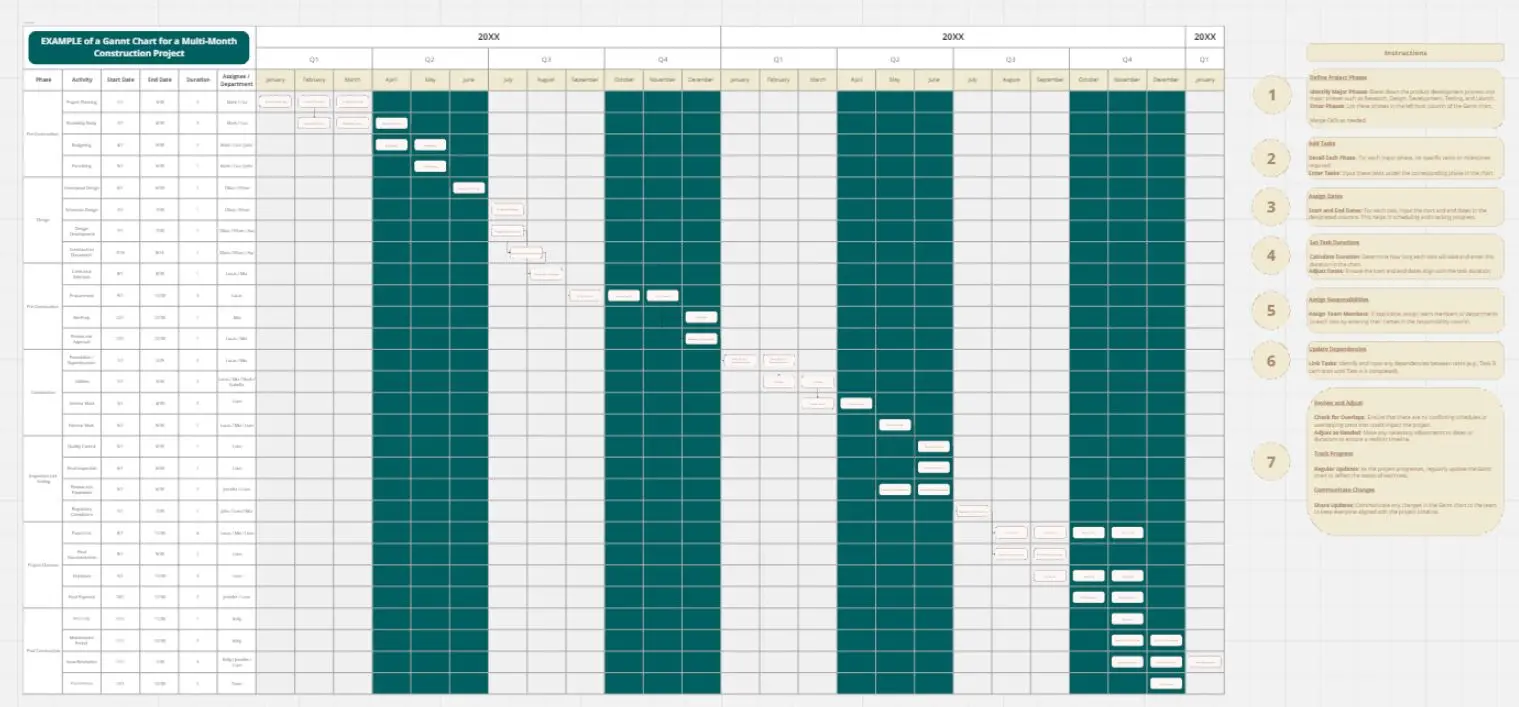
Define your research phases (planning, recruitment, fieldwork, analysis, reporting)
Break down each phase into specific tasks and milestones
Assign duration estimates and team members
Identify task dependencies and critical paths
Share with stakeholders for feedback and alignment
Research Project Gantt Chart FAQs
Who should use this template?
UX researchers, product designers, research operations teams and anyone managing multi-phase studies.
What research methods work best?
This template supports usability testing, ethnographic studies, surveys, diary studies and mixed-methods research projects.