A project planning Gantt chart is a visual timeline tool that helps project managers, product managers, and designers map tasks, dependencies, and milestones across project lifecycles. Track deliverables, allocate resources, and identify bottlenecks at a glance.
What Is a Project Planning Gantt Chart for Project Managers and Designers?
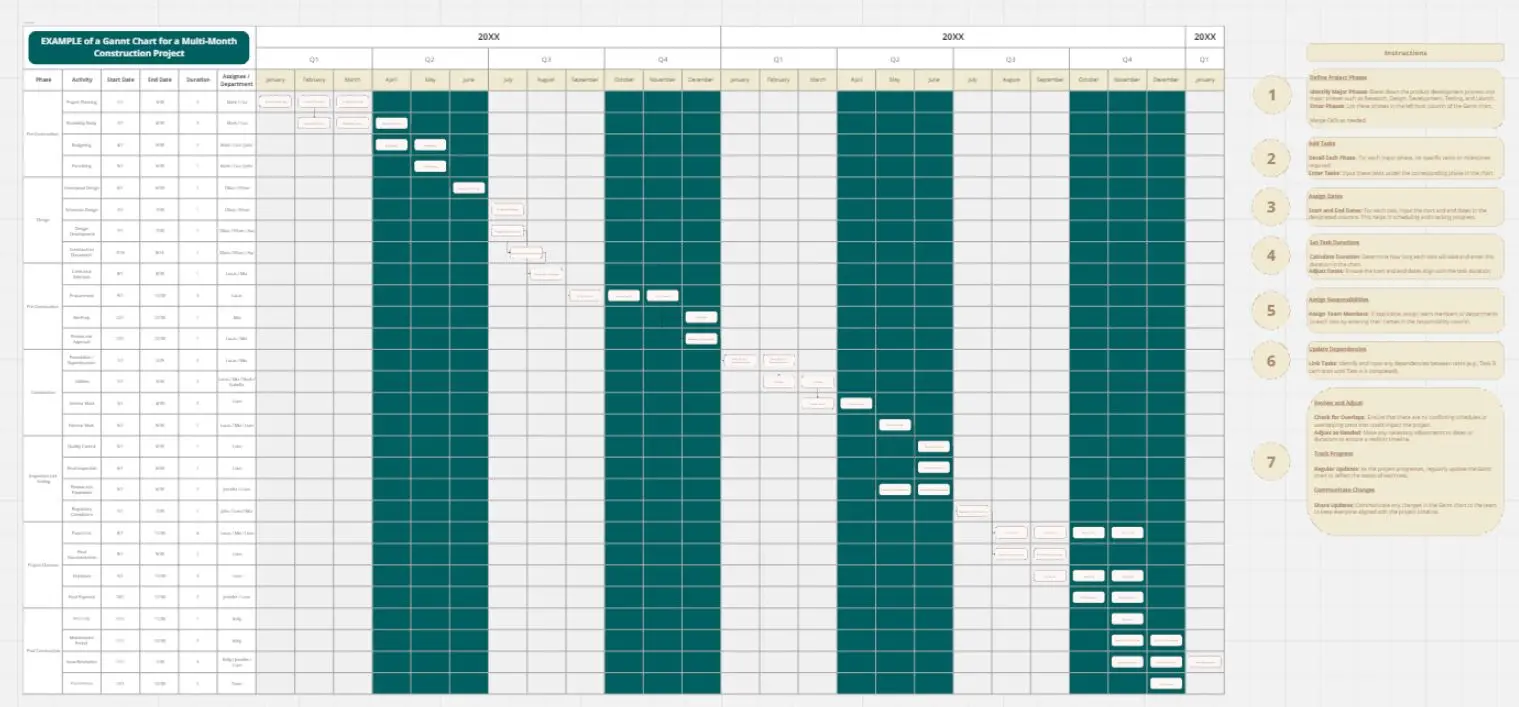
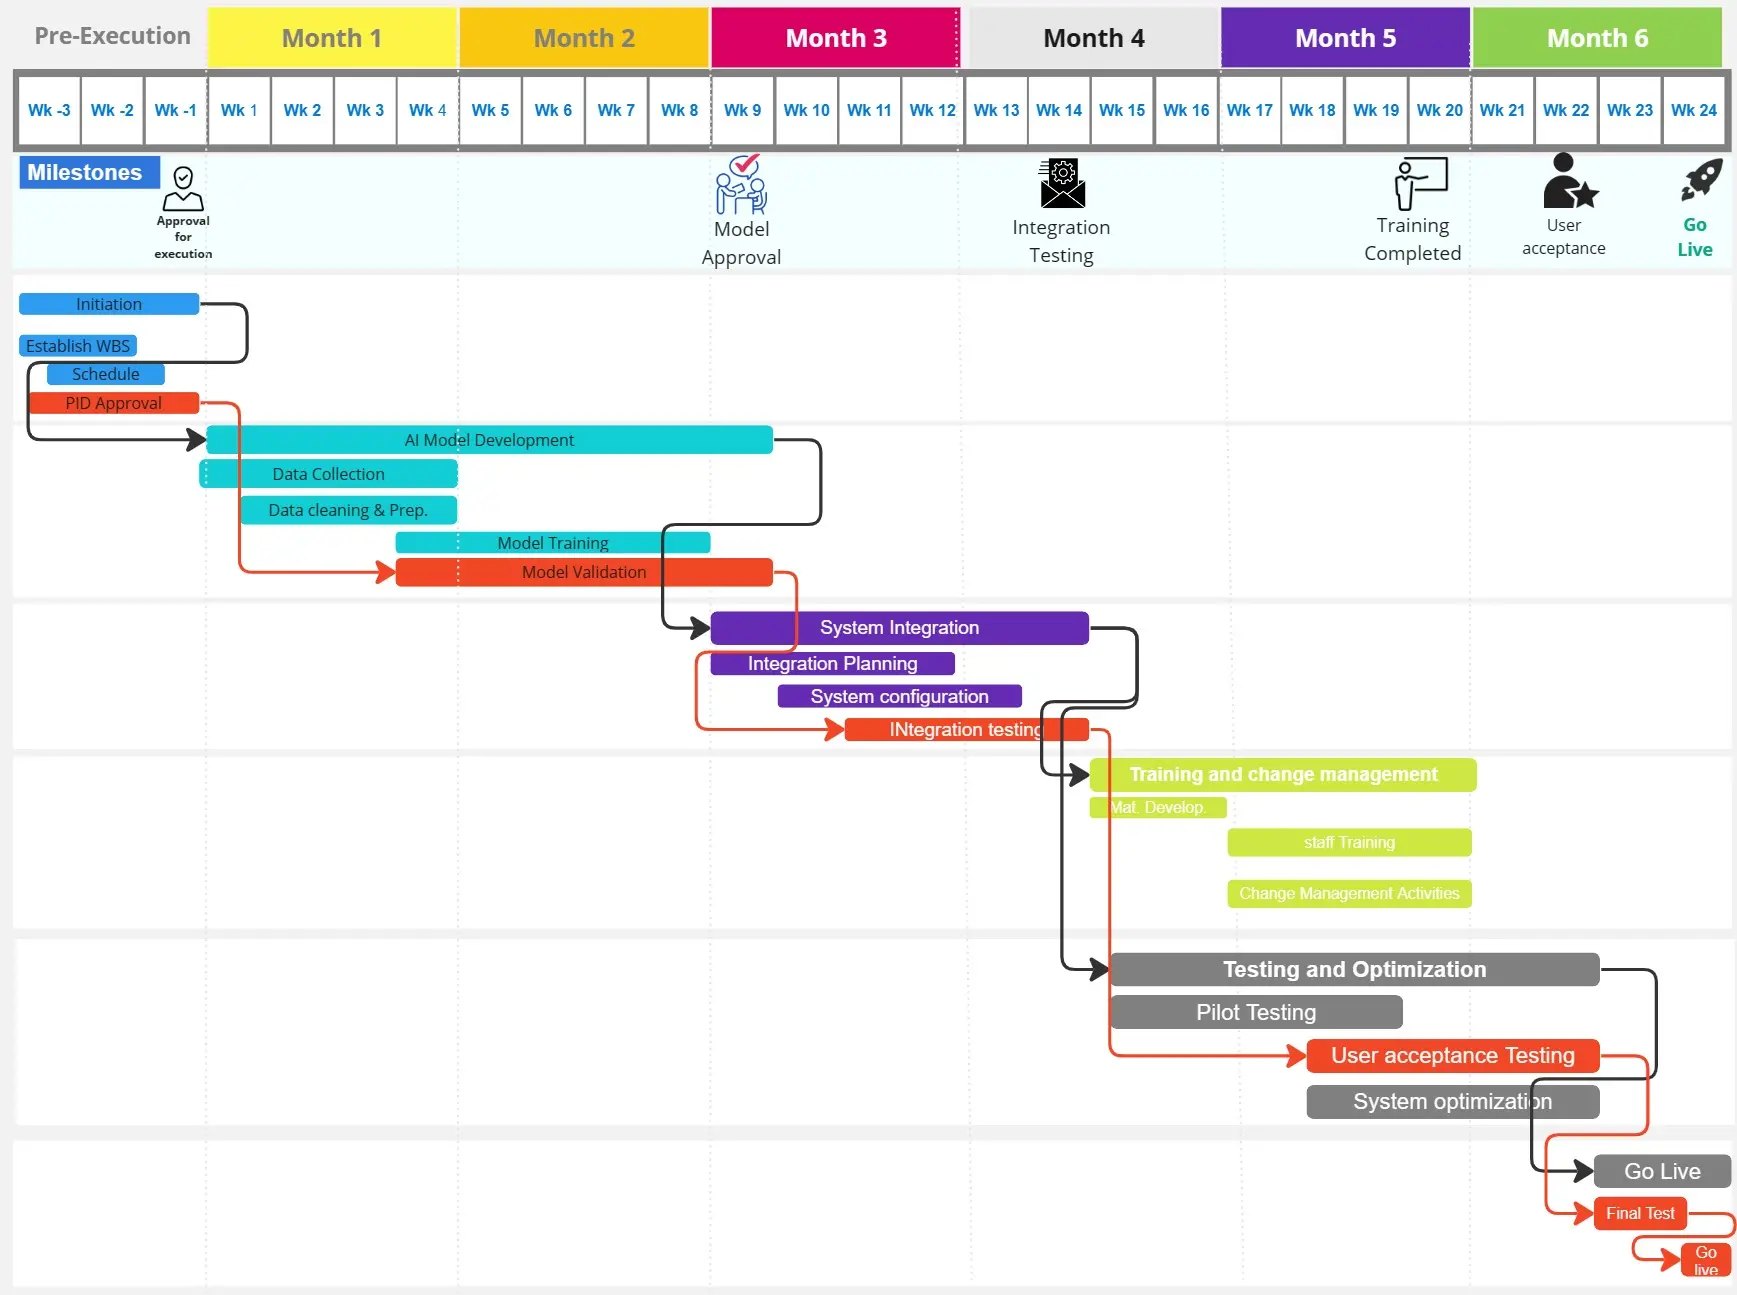
A project planning Gantt chart visualizes your project schedule as a horizontal bar chart, showing task duration, sequencing, and team assignments. Each bar represents a task or phase, helping you monitor progress and adjust timelines in real time.
What Problem Does the Project Planning Gantt Chart Solve?
This template addresses common challenges project managers face:
Unclear task dependencies causing delays
Resource allocation conflicts across teams
Missed deadlines due to poor visibility
Difficulty communicating timelines to stakeholders
How to Use the Project Planning Gantt Chart Template
List all project tasks and phases
Define start and end dates for each task
Map dependencies between tasks
Assign team members to specific deliverables
Update progress regularly
Project Planning Gantt Chart FAQs
Who should use this template?
Project managers, product managers, design leads, and cross-functional teams managing complex projects.
When should I use a Gantt chart?
Use it for projects with multiple phases, dependencies, and stakeholders requiring timeline visibility.