Objectives and Key Results (OKRs) Template
Use the OKR template to bring clarity and structure when setting up your business goals. Align teams and work towards the same vision.
About the OKR Template
The OKR template helps you with the strategic planning for the financial year, sets goals for you and your team, and aligns everyone towards the same objectives and key results.
This framework brings clarity, focus, and structure, and it exists at two primary levels: strategic and operational. The OKR Template allows you to have a great overview from the top down, providing everyone with actionable points so the company’s ultimate goals are achieved.
What is an OKR?
OKRs are Objectives and their related Key Results.
OKRs should be transparent to everyone: top-down, bottom-up, and cross-functional. When everyone’s looking at the same framework, everyone has the opportunity to work toward the same outcomes.
Objectives are the antidote to “blue sky thinking” – they aim to help you articulate what you want to achieve. An objective is significant, concrete, and drives you to get things done.
Key results explain how you’ll get those things done. Specific and measurable, these quantitative goals act as benchmarks for how you’ll reach an objective. (Think outcomes or results in absolute numbers.)
How to use the OKR template
Creating your own OKRs is about defining your key metrics and then bringing your team on board to raise the visibility of this framework company-wide.
It’s simple to make them with Miro, where you can easily create and share your team’s OKRs. Begin by selecting the OKR Template, then take the following steps to make your own.
Here’s how to get started:
Map out your team hierarchy.
Write from top-down which team is responsible for each OKR. You can edit the text inside the shapes to add the names and titles of the people in your organization.
Add the primary objectives driving your company or team on the top rectangle or shape.
Add the OKRs for each respective team, according to their function and role.
Fill in the measurable Key Results in the boxes below.
Color code teams so you can see at a glance which team is responsible for each OKR.
Remember: Objectives are concrete goals, and you can set them ambitiously; Key Results are always measurable and contain actionable points.
Ideally, you should do your OKR planning together with your team. Set some time aside and run a smooth session with Miro.
Why should you use the OKR template?
You and your team can use the OKR framework template to:
Clarify major goals according to department or discipline.
Communicate clearly and focus on what’s important for cross-functionality.
Practice transparency and simplify big ideas so everyone understands how they contribute to bigger company goals and priorities.
Sets up indicators for measuring progress so that teams can adapt and adjust to change.
Focus efforts so everyone stays aligned and cross-collaborative, and turn competitive initiatives into combined and consolidated efforts.
Teams that commit to completing their Objectives and Key Results (OKRs) should ideally point their stakeholders to results based on funding allocated per quarter. The goal is to reduce risk yet still set ambitious, bold quarterly goals, focusing on results over outcomes while putting value for both customer and business front and center.
What is typically included in an OKR template?
An OKR template usually consists of two main sections - Objectives and Key Results. Objectives are clear and specific goals that need to be achieved, while Key Results are measurable outcomes that indicate progress toward those goals. The template may also include sections for tracking progress and linking OKRs to strategic priorities.
Can the template be customized according to my organization's specific needs?
Yes, you can customize the template to match your organization's terminology, performance indicators, and other relevant details. The template is flexible enough to allow for adaptation.
How often should I update or review OKRs?
OKRs are typically set on a quarterly basis. It is recommended to have regular progress check-ins and reviews throughout the quarter, with a more comprehensive evaluation at the end of the period.
Is there a preferred format for presenting the information within the template?
While there isn't a strict format, it is important to keep your OKR template organized, visually clear, and easy to understand. You can use color-coding, charts, and graphs to represent the information visually.
Get started with this template right now.
Login Sequence Diagram Template
Works best for:
Diagramming, Technical Diagramming
The UML Sequence Login Diagram Template is a valuable tool for visualizing user authentication processes. It breaks down complex login sequences into clear, visual components, facilitating collaborative understanding among team members, regardless of their technical expertise. This shared understanding is crucial for ensuring all stakeholders, from developers to project managers, are on the same page, leading to efficient decision-making and a smoother development process. The template's ability to translate technical details into an accessible format streamlines communication and significantly reduces the likelihood of misinterpretation or oversight, making it an essential asset in any software development project.
Gantt Chart for Project Scheduling
Works best for:
Planning, Strategy
Gantt Chart for Project Scheduling helps you plan and visualize project timelines. It enables you to manage tasks, deadlines, and dependencies, ensuring efficient project execution. Ideal for project managers looking to streamline their scheduling process.
Project Scope Template
Works best for:
Project Management, Decision Making, Project Planning
A project scope helps you plan and confirm your project’s goals, deliverables, features, functions, tasks, costs, and deadlines. A project manager and team should develop a project scope as early as possible, as it will directly influence both the schedule and cost of a project as it progresses. Though project scopes will vary depending on your team and objectives, they generally include goals, requirements, major deliverables, assumptions, and constraints. Aim to include the whole team when you create a project scope to ensure everyone is aligned on responsibilities and deadlines.
SMART Goals Template
Works best for:
Prioritization, Strategic Planning, Project Management
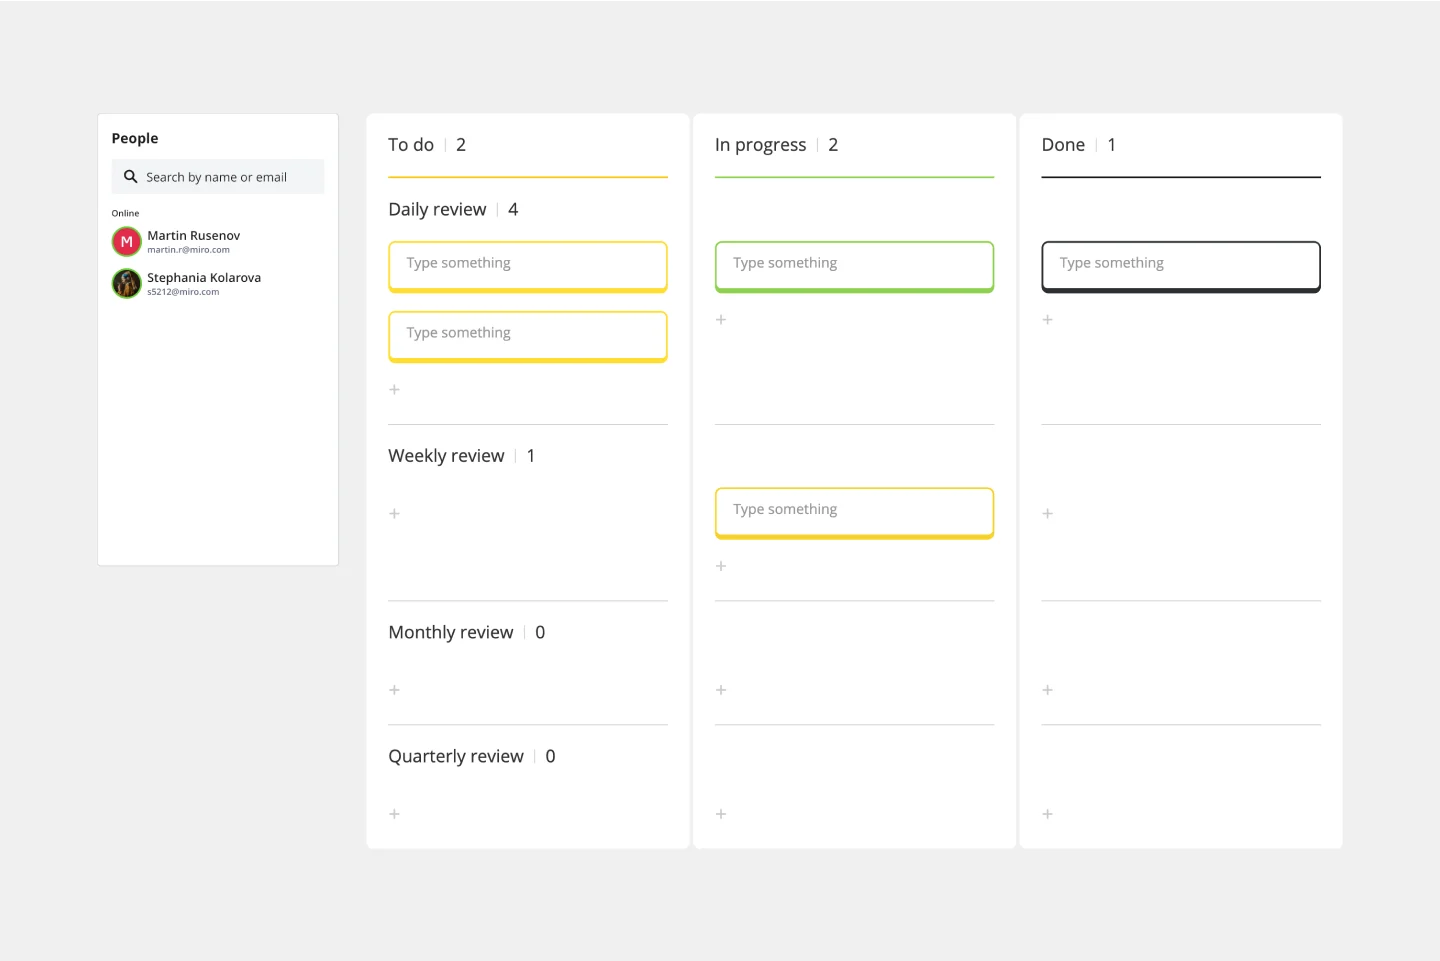
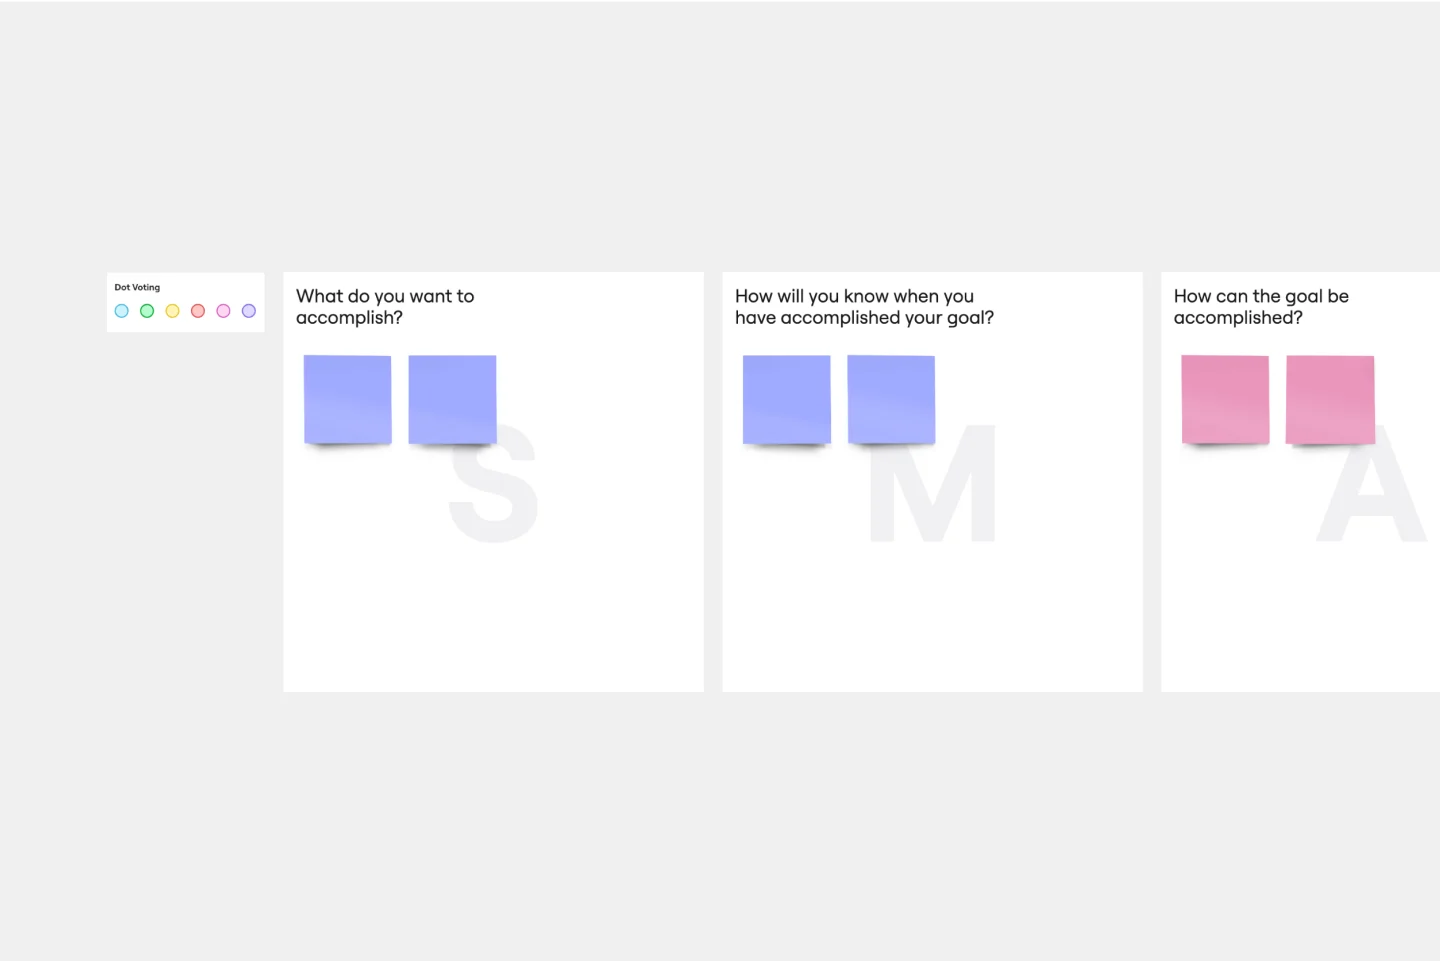
Setting goals can be encouraging, but can also be overwhelming. It can be hard to conceptualize every step you need to take to achieve a goal, which makes it easy to set goals that are too broad or too much of a stretch. SMART is a framework that allows you to establish goals in a way that sets you up for success. SMART stands for Specific, Measurable, Attainable, Relevant, and Timely. If you keep these attributes in mind whenever you set goals, then you’ll ensure your objectives are clear and reachable. Your team can use the SMART model anytime you want to set goals. You can also use SMART whenever you want to reevaluate and refine those goals.
Venn Diagram Practical Applications
Works best for:
Venn Diagram
The Venn Diagram for Practical Applications template helps you apply Venn diagrams to real-world scenarios. Use this template to solve problems, identify relationships, and make decisions based on clear visual analysis. It's perfect for practical tasks such as project planning, resource allocation, and strategic decision-making. This tool is ideal for business professionals, educators, and anyone looking to apply theoretical concepts to practical situations.
T-Chart Template
Works best for:
Ideation, Operations, Strategic Planning
T-Charts can help you compare and contrast two different ideas, group information into different categories, and prove a change through “before” and “after” analysis. T-Charts are visual organizational tools that enable you to compare ideas, so you can evaluate pros and cons, facts and opinions, strengths and weaknesses, or big-picture views versus specific details. Designers and content creators can use T-Charts to turn possibilities into actionable ideas. T-Charts are useful for discussing differences and similarities with your team or clients and can help you to reach a decision together.