The Modern Project Timeline is a high-level visual roadmap designed for Project Managers, Team Leads, and Executives to synchronize complex initiatives. In an era of rapid execution, this template moves beyond clunky spreadsheets to provide a clean, "at-a-glance" view of a project’s pulse, ensuring that every stakeholder is aligned on the path from initiation to completion.
What Problems Does This Modern Gantt Chart Solve?
Regardless of the industry, managing a multi-month project often leads to "timeline drift" and communication gaps. This template mitigates those risks by providing:
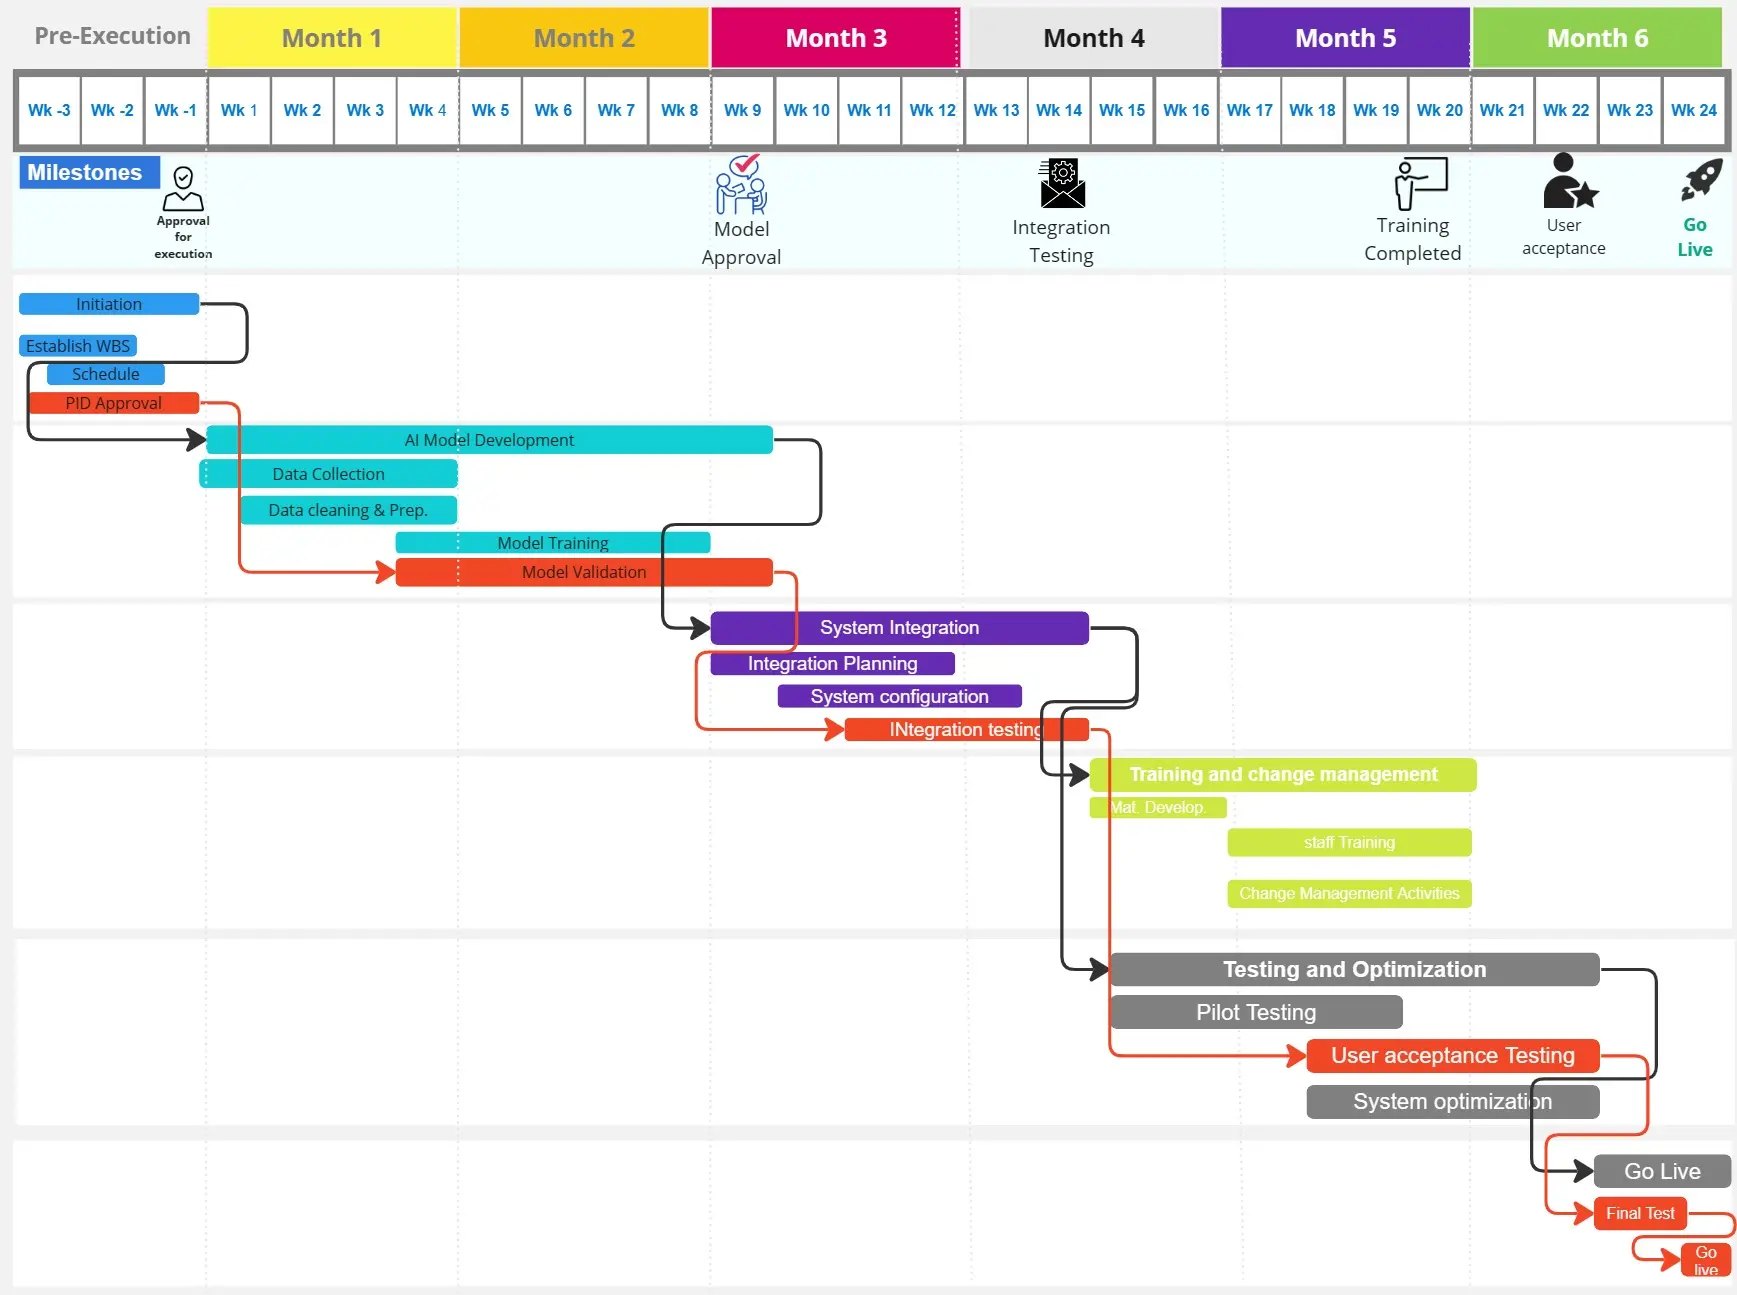
Visual Sequence & Flow: It clearly maps the chronological order of operations, making it easy to see which stages must finish before the next can begin.
Executive-Ready Clarity: The modern, minimalist aesthetic is designed for presentations. It removes technical "noise," allowing leadership to focus on high-level progress.
Stage-Based Organization: By grouping activities into color-coded "Stages," it prevents teams from feeling overwhelmed by a massive task list.
Overlap Management: The staggered bars visualize "lead and lag" times, helping managers identify where different teams need to collaborate simultaneously.
How to Use This Template (The Universal 4-Tier Structure)
To maximize project control, simply define your stages and tasks as needed using this flexible hierarchy:
1. Project Stages (The Master Categories)
Group your work into logical phases (e.g., Phase 1: Planning, Phase 2: Execution). These act as the "containers" for your workstreams.
2. Activity Tracks (The Horizontal Bars)
Each bar represents a specific workstream or deliverable.
3. Overlap & Dependency (The Visual Logic)
Align bars vertically to show concurrent work. If one bar starts exactly where another ends, you’ve visually signaled a critical dependency.
4. Progress Tracking (Optional Coloring)
Use different shades (as seen in the dark vs. light blue) to represent the status:
Frequently Asked Questions (FAQ)
How granular should the tasks be in this view?
This is a Strategic Timeline. Focus on "Work Packages" or "Milestones" rather than daily to-do lists. If a task takes less than a week, it might be too small for this high-level view.
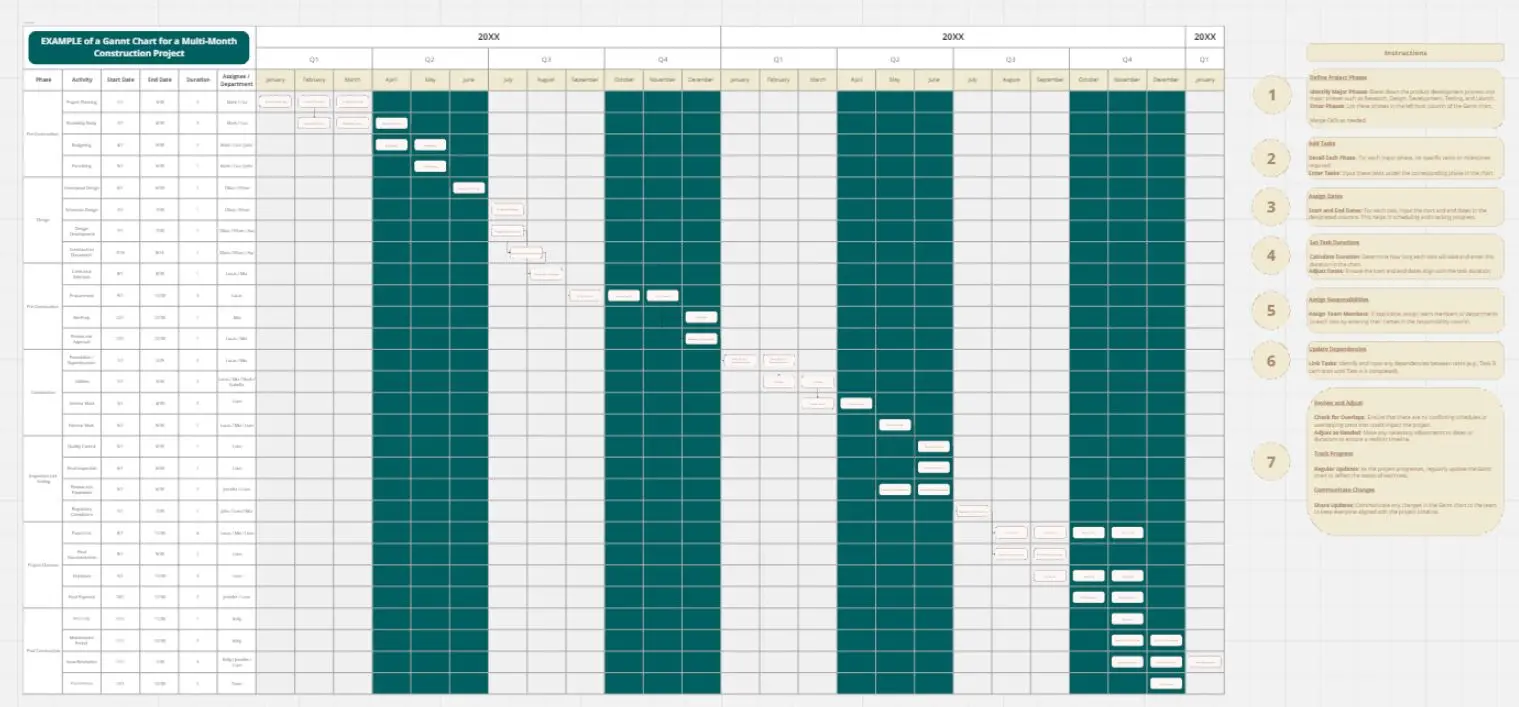
Can I adapt the months for a shorter project?
Absolutely. While this template shows a full year (Jan–Dec), you can easily zoom in on a single quarter or a specific 6-month "sprint" by adjusting the header labels.
What is the difference between this and a standard Task List?A task list tells you what to do. This Gantt chart tells you when it happens and how it impacts everything else. It is a tool for timing, not just execution.