Development Process Gantt Chart
What is it?
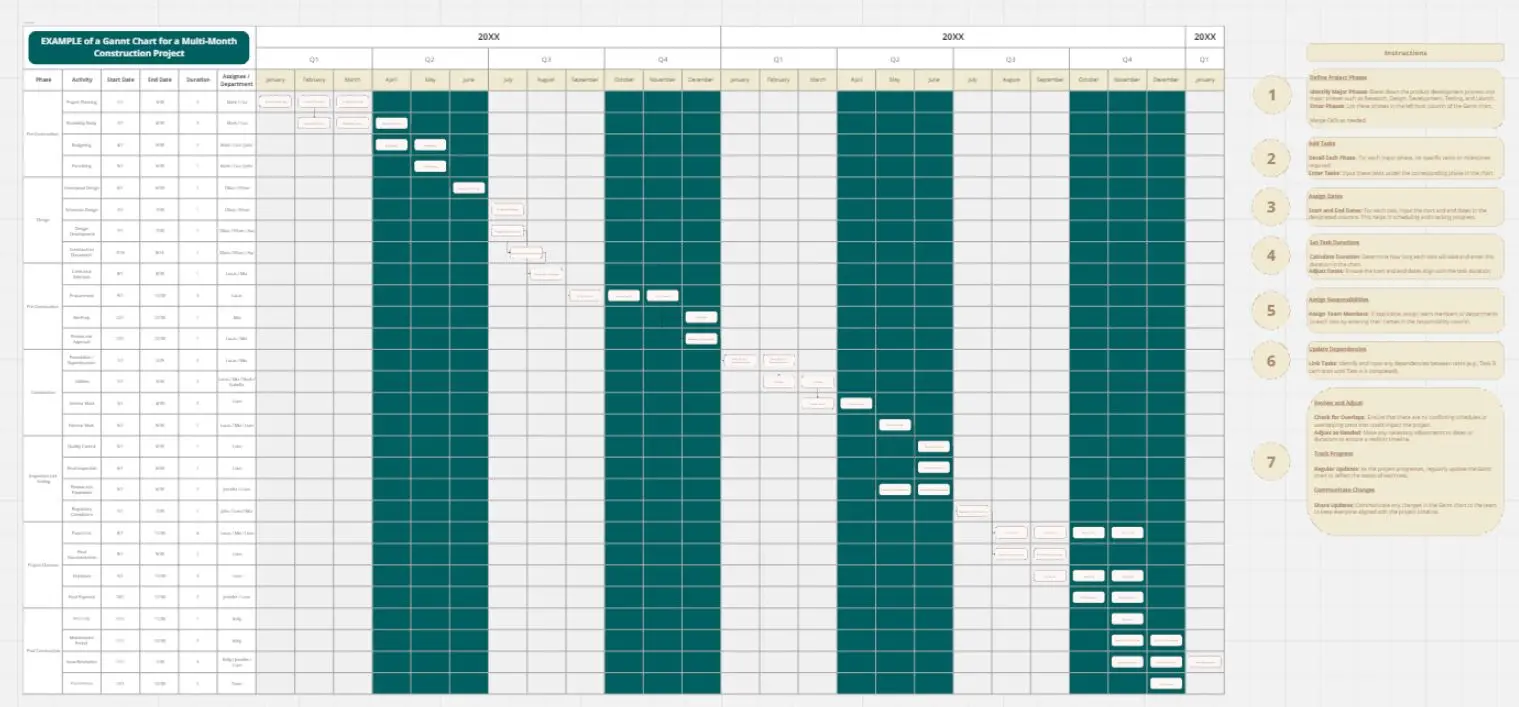
The Development Process Gantt Chart is a visual project planning tool that helps you map out tasks, timelines, and dependencies across a development process. It provides a structured overview of how a project unfolds over time—showing what needs to happen, when, and in what sequence.
By translating complex workflows into a timeline-based format, the template makes it easier to coordinate activities, allocate resources, and track progress from start to finish.
This template is ideal for:
Project managers coordinating multi-phase development processes
Product and service designers structuring concept-to-launch workflows
Start-ups and SMEs planning product, service, or business development
Sustainability and innovation teams managing circular or impact-driven initiatives
Consultants and facilitators guiding clients through structured implementation processes
It works equally well for internal team planning and collaborative workshops.
To get the most value from the template:
1. Define your phases
Start by outlining the key stages of your development process (e.g. research, design, testing, implementation, evaluation).
2. Break down activities
List the specific tasks within each phase. Keep them clear and actionable.
3. Set timelines
Assign start and end points for each task. Be realistic and allow buffer time where needed.
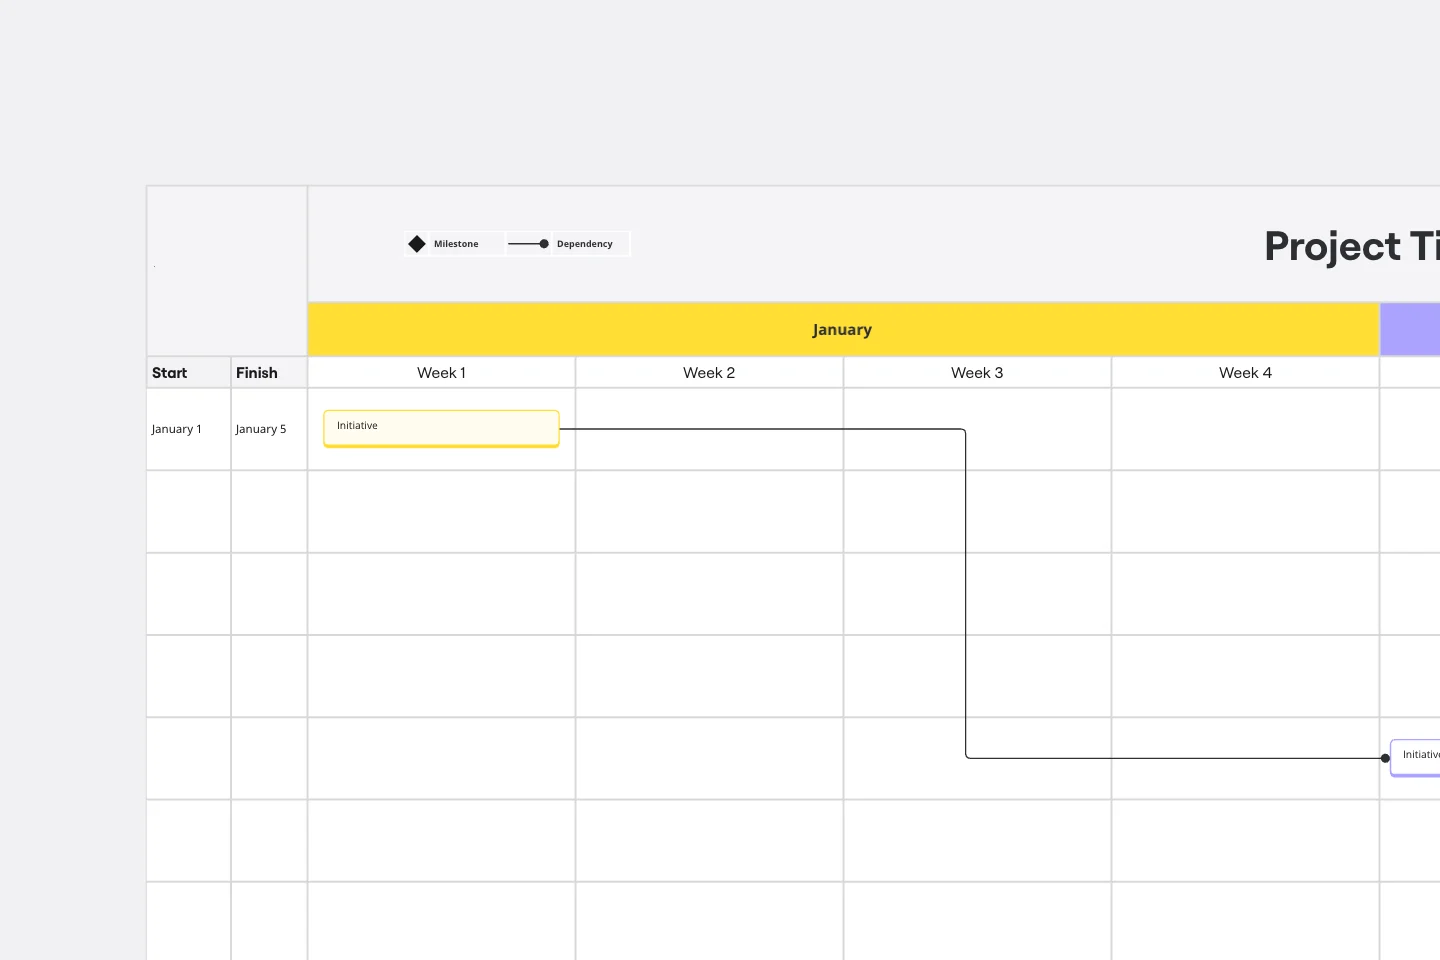
4. Map dependencies
Identify which tasks rely on others being completed first. This helps avoid bottlenecks.
5. Assign responsibilities
Clarify who is responsible for each task to improve accountability and coordination.
6. Use it as a living tool
Update the chart regularly as the project evolves—this is not a static plan, but a dynamic management tool.
7. Facilitate collaboration
Use it in workshops or team sessions to align expectations, co-create timelines, and build shared ownership.
Why use this template?
Creates clarity in complex processes
Aligns teams around a shared timeline
Supports better planning and decision-making
Helps anticipate risks and delays
Makes progress visible and trackable