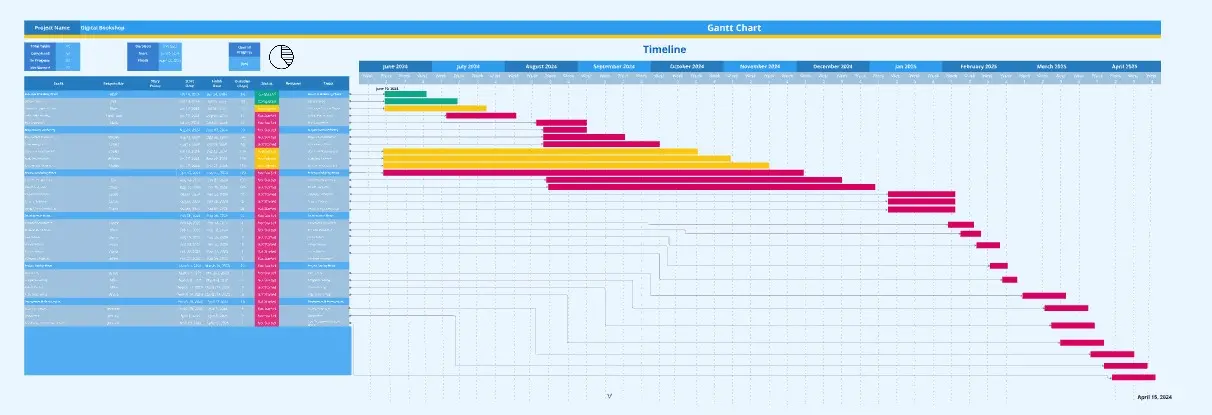
Track, prioritize and implement customer insights with a visual timeline. This Customer Feedback Gantt Chart template helps UX researchers and product designers transform user feedback into actionable product improvements with clear deadlines and ownership.
What Is a Customer Feedback Gantt Chart for User Researchers?
A Customer Feedback Gantt Chart is a visual project management tool that maps customer insights, research findings and feature requests across a timeline, enabling design teams to plan implementation sprints and track progress from discovery to deployment.
What Problem Does the Customer Feedback Gantt Chart Solve?
User researchers often struggle to bridge the gap between collecting feedback and seeing it implemented. This template solves:
Lost insights between research and development
Unclear prioritization of user needs
Lack of visibility into feedback implementation status
Difficulty coordinating cross-functional design sprints
How to Use the Customer Feedback Gantt Chart Template
Add customer feedback items as tasks
Categorize by priority and user impact
Assign owners from research and design teams
Set realistic timelines for implementation
Track progress and update stakeholders
Customer Feedback Gantt Chart FAQs
How do I prioritize feedback? Use impact-effort matrices alongside your timeline to focus on high-value improvements.
Can I integrate this with user research tools? Yes, import data from survey platforms and usability testing tools.