DMAIC Business Improvement Map Workshop Using a Fill-In Table helps teams turn scattered improvement conversations into a structured, slide-ready plan. Using a simple DMAIC table, Define, Measure, Analyze, Improve, Control, you align on purpose, tools, and outputs for each phase and leave with a clear action plan tied to owners and dates.
What is this?
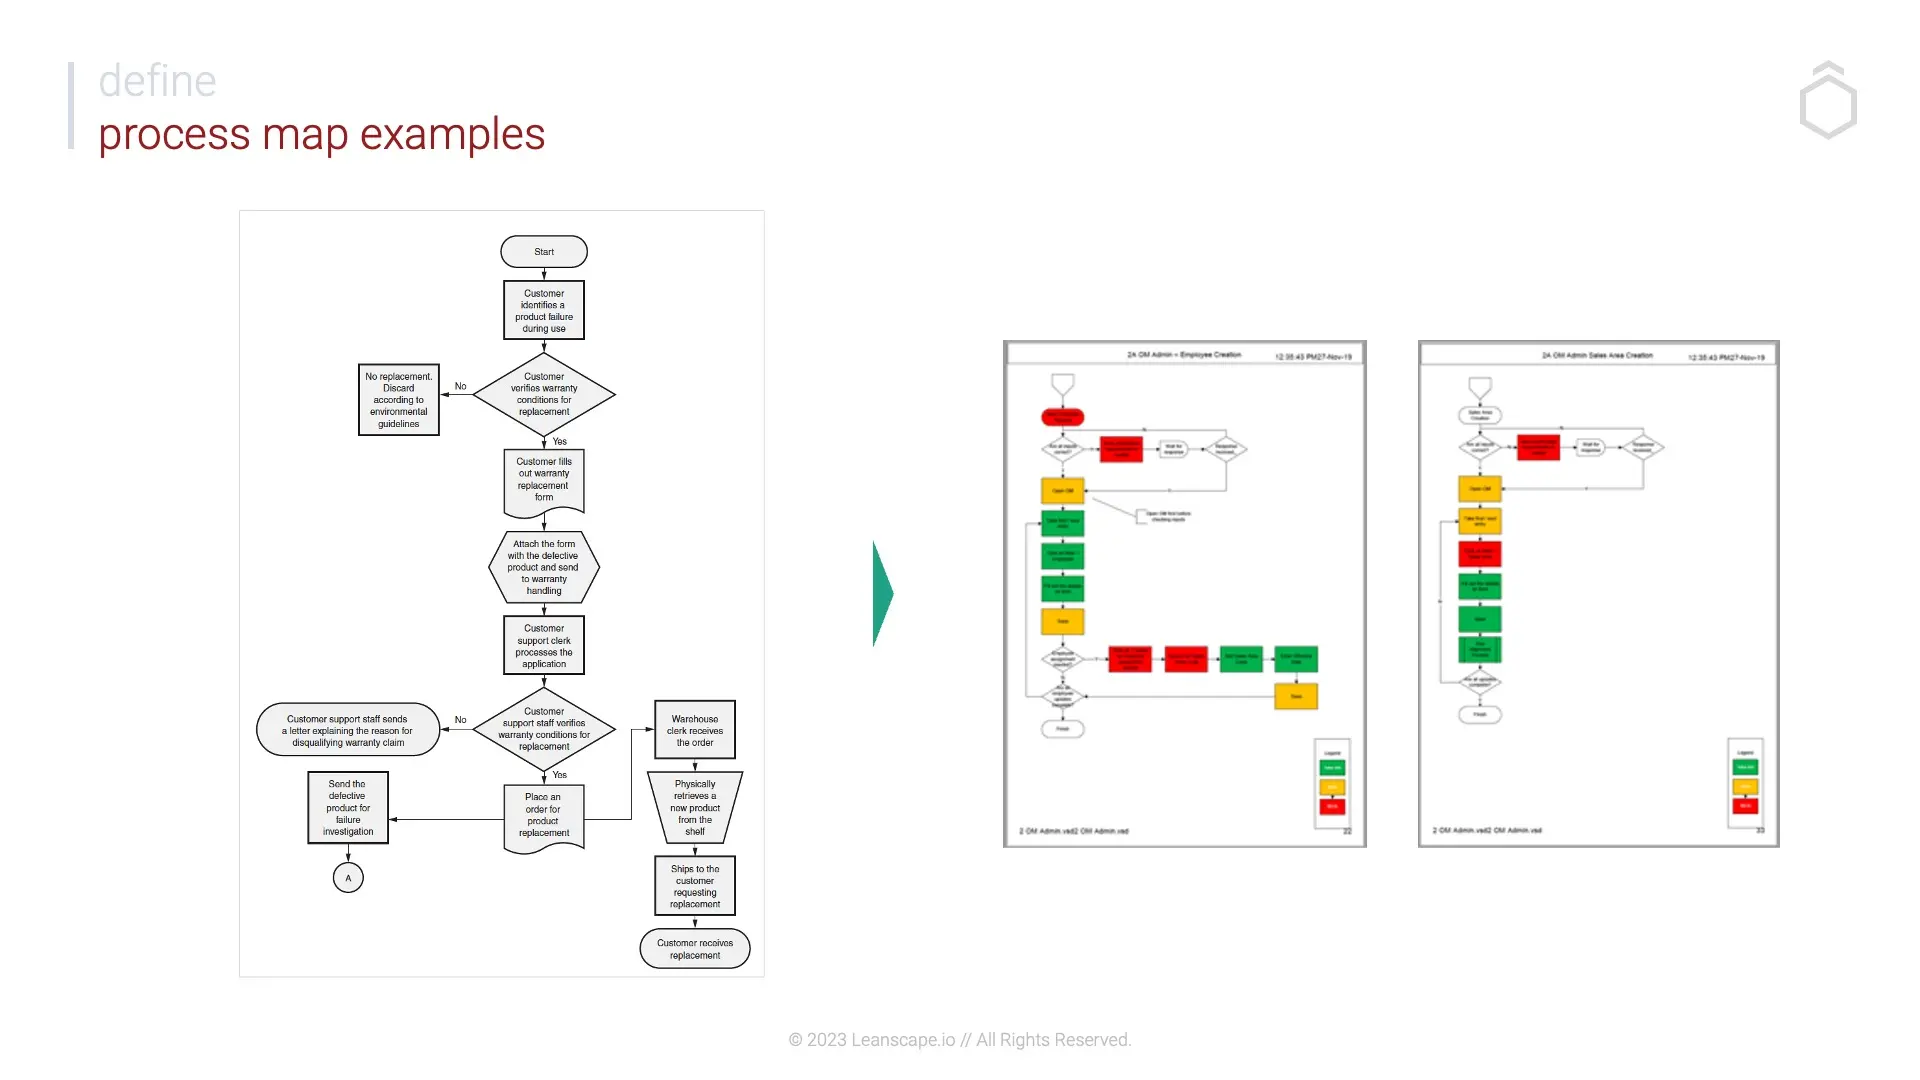
A facilitated workshop that guides teams through filling a structured DMAIC table to create a shared improvement narrative that fits on one slide and drives execution.
What problem does it solve?
Meetings full of opinions instead of data
Missing baseline metrics
Root causes based on assumptions
Improvements that fade after rollout
How to use
Write the process name, trigger > end condition, and one measurable aim
Fill DEFINE with a clear problem statement, scope, metric, and owner
Fill MEASURE with baseline metrics, data sources, and collection plan
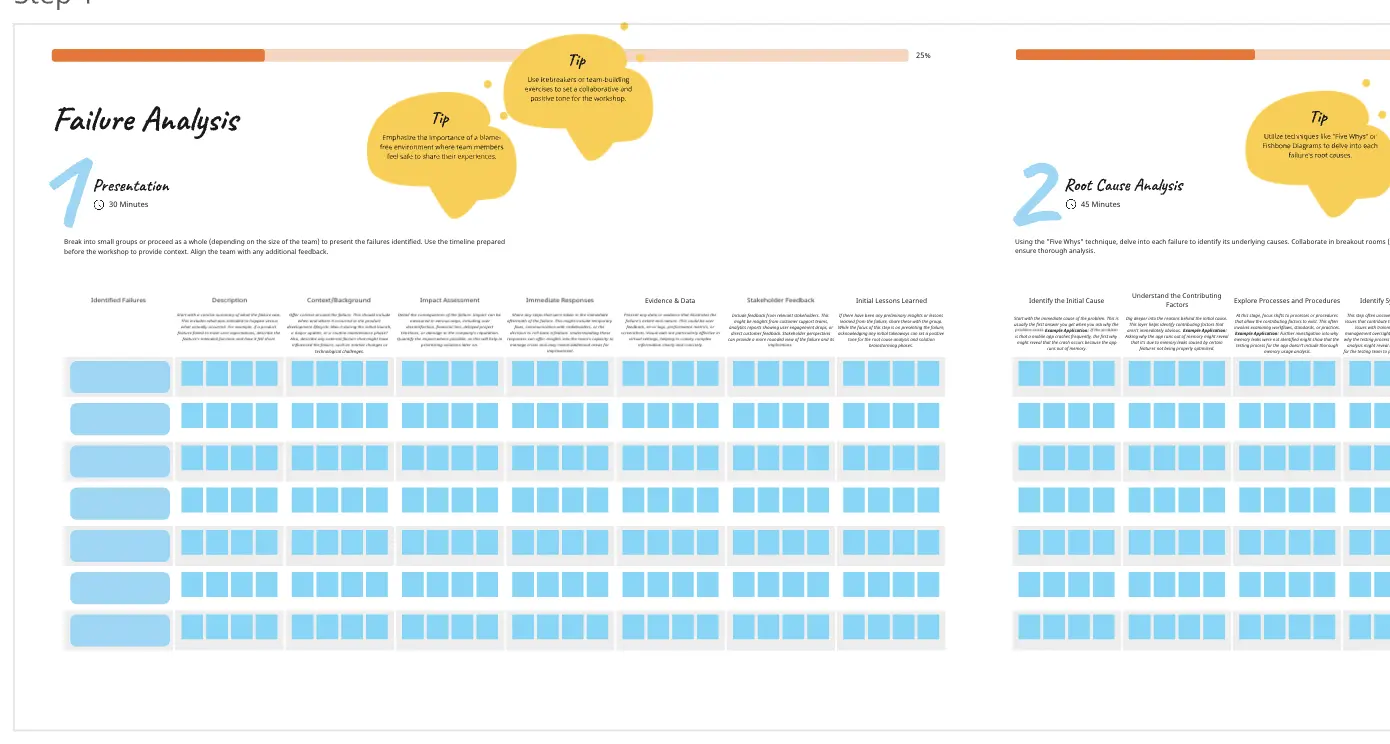
Fill ANALYZE with ranked root causes and supporting evidence
Fill IMPROVE with prioritized solutions, pilot plan, and future-state flow
Fill CONTROL with metrics, thresholds, owners, and escalation actions
Trim each cell to 3–5 bullets for executive clarity
Common pitfalls
Too many metrics, vague root causes, solution wishlists, weak control plans.
Ways to avoid mistakes
Limit to 3–5 metrics, write root causes as testable statements, tie each solution to a metric shift, define thresholds and response rules.
Miro Features Used
Tables for the DMAIC grid, Sticky notes for rapid input, Frames for each phase, Tags for owners and metrics, Voting for prioritizing root causes, Comments for open risks
FAQ
Q: Who can benefit from this template?
A: Process owners, operations leads, continuous improvement teams, project managers, and data partners.
Q: What do I leave with?
A: A completed DMAIC table, top root causes, prioritized improvements, and a control plan with named owners and review cadence.
Q: Can this fit on one slide?
A: Yes, the table is designed to communicate the full improvement story in a single executive-ready view.