Bubble Map Template
Map ideas and data points quickly with a Bubble Map Template. Streamline complex information, promoting efficient decision-making in every project across your organization.
About the Bubble Map Template
The Bubble Map Template stands out in data visualization and idea organization as an adaptable and easy-to-use tool. It allows you to arrange your thoughts, processes, or data in a visually appealing and understandable format, boosting efficiency and clarity. Whether brainstorming, strategizing, or presenting, use the Bubble Map Template as your go-to solution for turning complex ideas into clear visual narratives.
What's a Bubble Map Template?
A Bubble Map Template is a diagramming tool used for visually organizing information. The diagram uses varying-sized circles or "bubbles" to represent concepts and lines to denote relationships or connections between them. It's a great tool for understanding complex systems, brainstorming ideas, or visualizing hierarchies and relationships.
Why should you use it?
Bubble maps help streamline thoughts, ideas, and information in an easily digestible format. They encourage critical thinking and facilitate understanding of relationships and patterns within complex data.
How to use a Bubble Map Template in Miro?
The Bubble Map Template in Miro offers a streamlined way to visually organize your ideas or data. Here's a quick guide to creating your Bubble Map:
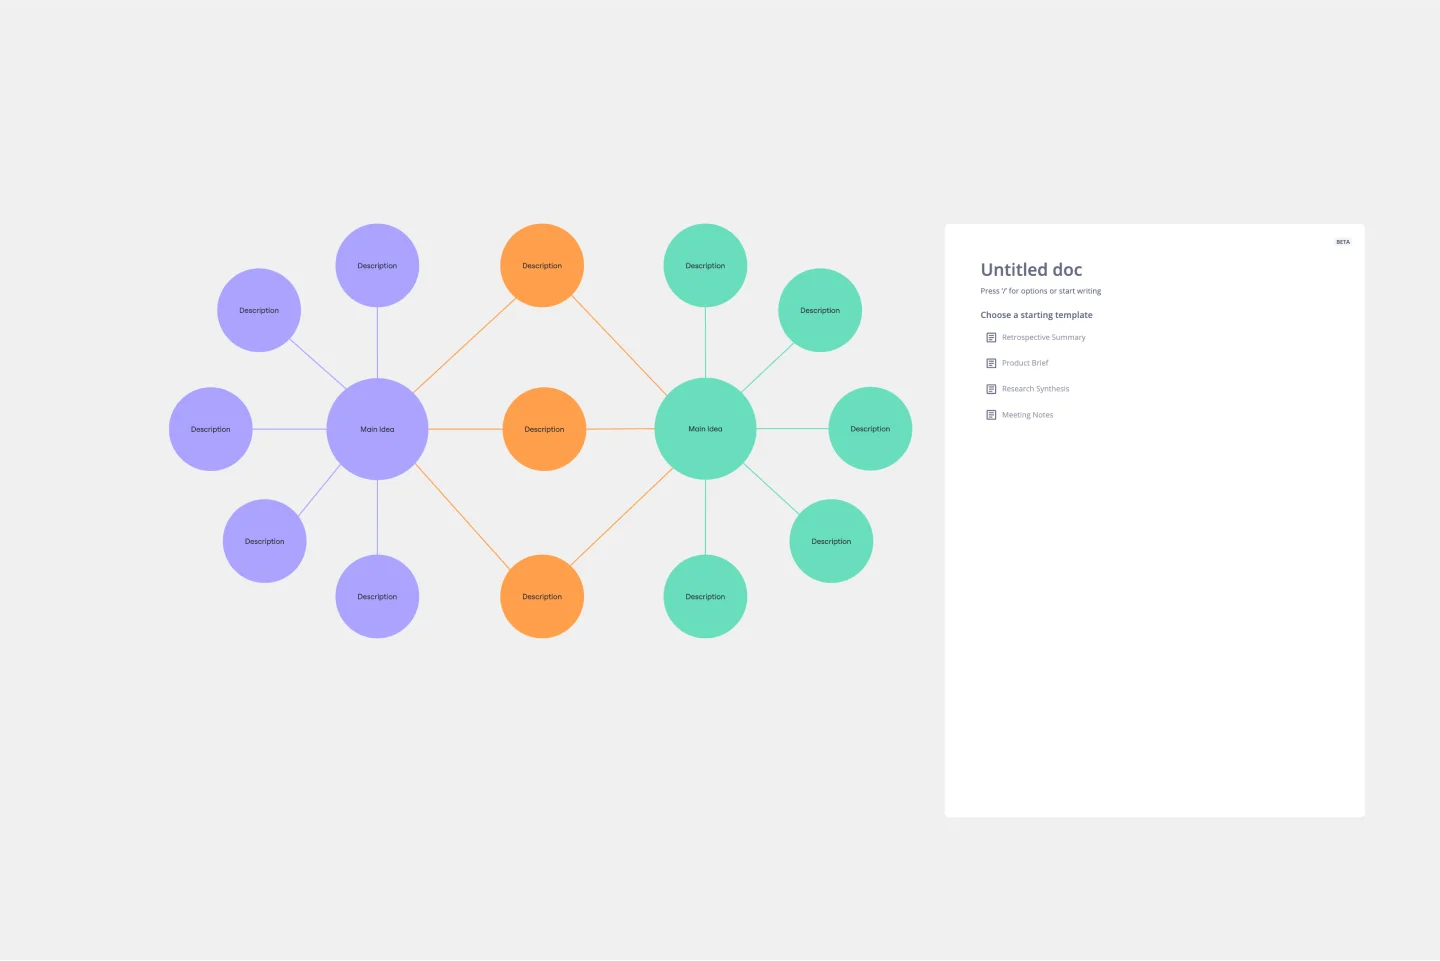
Select the Bubble Map Template: Click on "Use template." The template will then be loaded onto your Miro board.
Edit the bubbles: Click on the template, and a text box will appear in the context menu bar. This will allow you to edit the central bubble or main idea. For resizing, click and drag the circle's edge. In the context menu, change the color of the bubbles and lines, adjust the font size and style within the bubbles, and even add icons or images to make your bubble map more visually engaging.
Auto-arrange and align: If you're dealing with many bubbles, Miro's auto-arrange and align feature can help you keep your map neat and readable.
Remember that you can invite others to collaborate on your bubble map in real-time, making it the ultimate bubble map maker and an excellent tool for brainstorming sessions, project planning, or team meetings. Enjoy visually mapping your thoughts and ideas with Miro's Bubble Map Template.
Can I collaborate with my team on a Bubble Map in real time?
Yes. Miro's collaborative features allow multiple users to work on the same Bubble Map simultaneously. Team members can add their input, make changes, and leave comments in real time, promoting dynamic and efficient collaboration.
Can I share my Bubble Map with others?
Absolutely. Miro lets you share your Bubble Map in several ways – via a link, email, or even embedded on a website. You can control whether recipients can view, comment or edit your map.
Can I use the Bubble Map Template offline?
Miro primarily operates online to enable real time collaboration. However, you can export your Bubble Map Template as a PNG, JPEG, or PDF file to view offline.
Get started with this template right now.
UML Use Case Online Shopping System Template
Works best for:
UML
The Online Shopping System Template simplifies the process of documenting and visualizing how users interact with an online shopping system. It provides a standard way to map out user interactions, such as product listings, inventory management, shopping carts, order processing, payments, and shipping details. By using this template, teams can collaborate effectively in real-time or at different times, adjusting the diagram to meet their project's specific needs. This not only improves clarity and efficiency but also fosters better communication among team members and stakeholders, ensuring a thorough understanding of the system's design and requirements.
5-Set Venn Diagram
Works best for:
Venn Diagram
Analyze complex data with the 5 Set Venn Diagram template. This tool allows you to compare and contrast five different sets of data, highlighting intersections and unique elements. Perfect for in-depth data analysis, research, and strategic planning. Ideal for analysts, researchers, and educators looking to present comprehensive data insights in a clear and visual manner.
Cloudflare Automatic Captioning for Video Template
The Cloudflare Automatic Captioning for Video Template in Miro is a powerful tool designed to enhance the accessibility and engagement of video content. By leveraging Cloudflare's technology, this template helps outline the captioning process for videos. It not only makes content accessible to a broader audience, including those who are deaf or hard of hearing but also boost viewer engagement by making videos consumable in sound-sensitive environments or by individuals who prefer reading along.
UML Component Diagram Template
Works best for:
Mapping, Diagrams, Software Development
Use our Component Diagram template to show how a system’s physical components are organized and wired together. Visualize implementation details, make sure planned development matches system needs, and more — all in a collaborative environment.
UML Communication Diagram Template
Works best for:
Software Development, Mapping, Diagrams
Most modern programs consist of many moving parts working to a precise set of instructions. With a communication diagram, you can visualize exactly how those parts work together, giving you a clearer understanding of your program as a whole. What’s more, the diagram leaves spaces for expanding the network of relationships as your product grows and evolves. A communication diagram is a vital tool in any software designer’s arsenal.
Cross-Account EC2 Status Monitoring for HPC Clusters Template
Works best for:
AWS
The Cross-Account EC2 Status Monitoring for HPC Clusters Template provides a centralized view of the health and performance of EC2 instances across multiple AWS accounts. It helps in early issue detection, reducing downtime and ensuring optimal efficiency of HPC clusters. The template offers customization options to meet specific HPC cluster configurations, simplifying monitoring and improving operational efficiency for administrators.