11 likes
64 uses
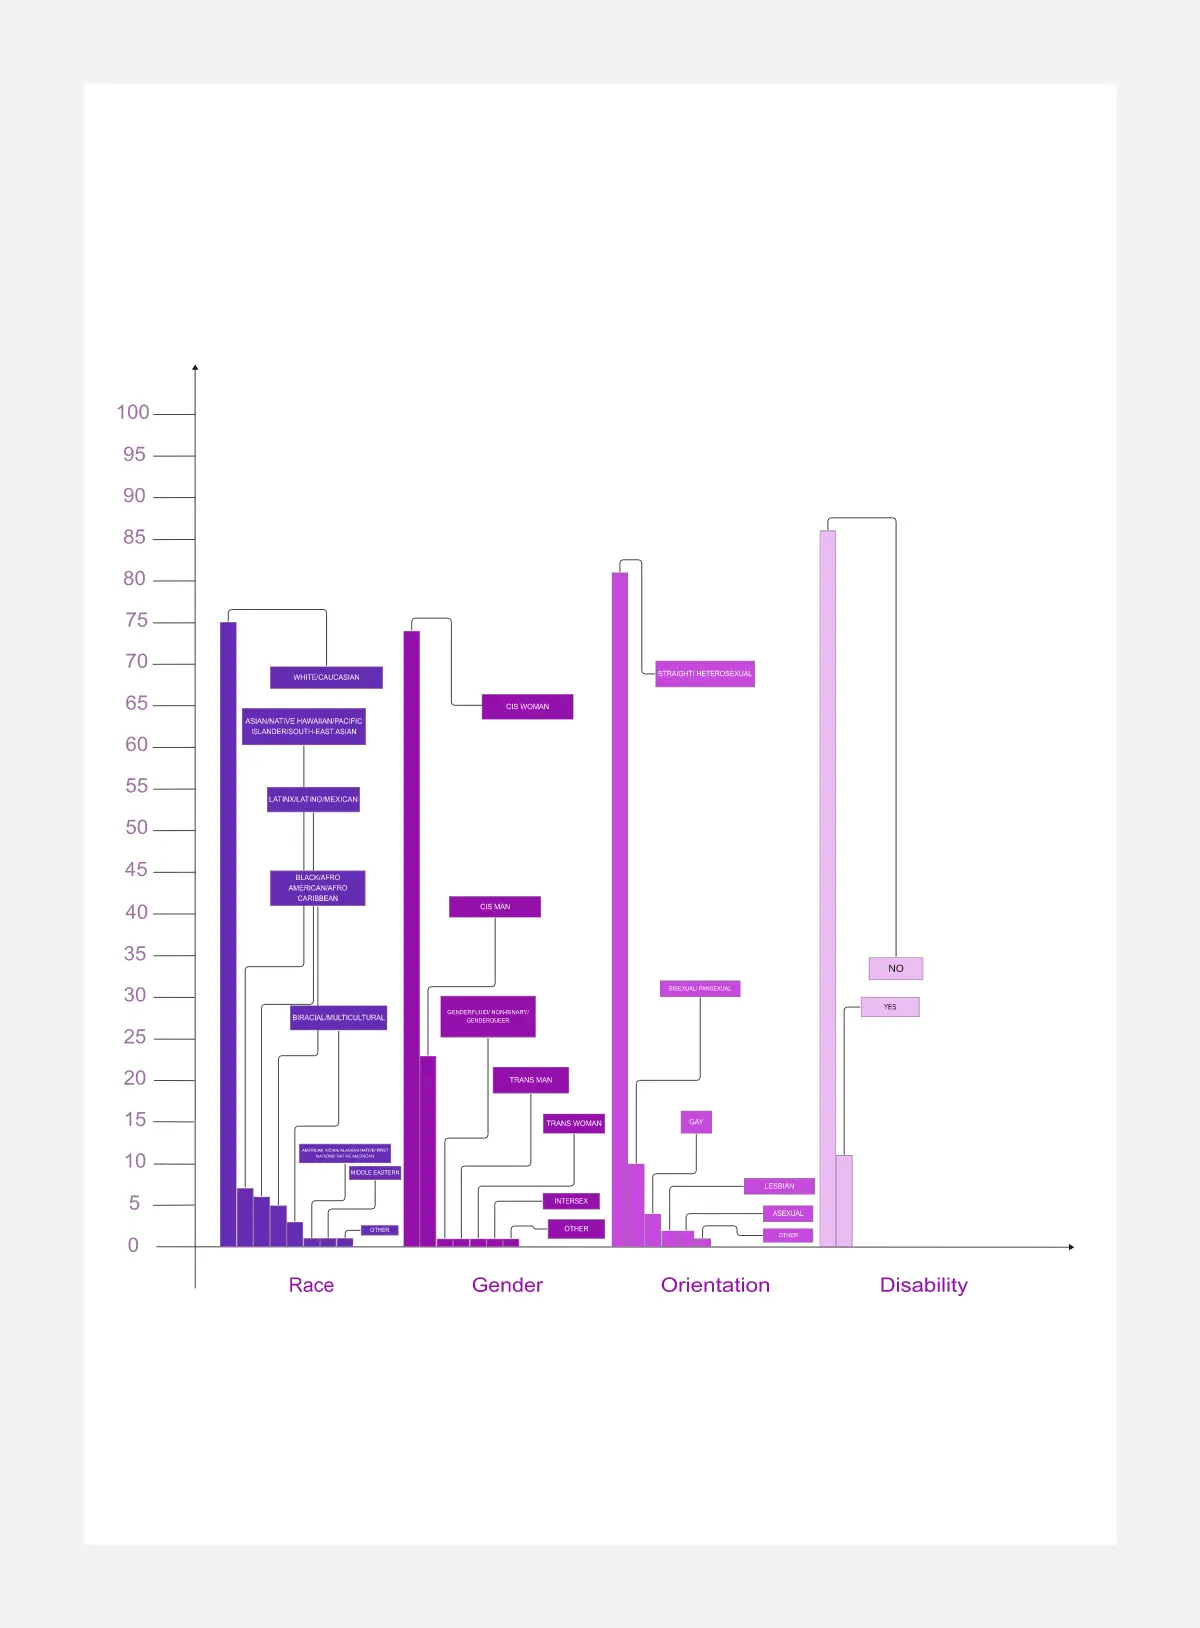
Bar Chart / Diagram Combined
The Bar Chart / Diagram Combined template offers a versatile tool for creating visualizations that combine bar charts with other diagrammatic elements. It provides elements for representing data trends, relationships, and comparisons effectively. This template enables teams to create customized visualizations that communicate complex information in a clear and compelling manner. By promoting visual clarity and insight, the Bar Chart / Diagram Combined template empowers teams to make data-driven decisions and communicate findings with impact.