About the analytics & data science templates collection
This collection serves data scientists, analysts, and product managers who need to make data-driven decisions collaboratively. These templates span your entire analytical process—from data exploration and hypothesis formation to statistical analysis, machine learning workflows, and insight presentation.
You'll find frameworks for customer segmentation, A/B test analysis, predictive modeling, data pipelines, churn analysis, and recommendation systems. These templates bridge the gap between technical precision and business clarity, making sophisticated analysis accessible to diverse teams.
Why you'll love the analytics templates collection
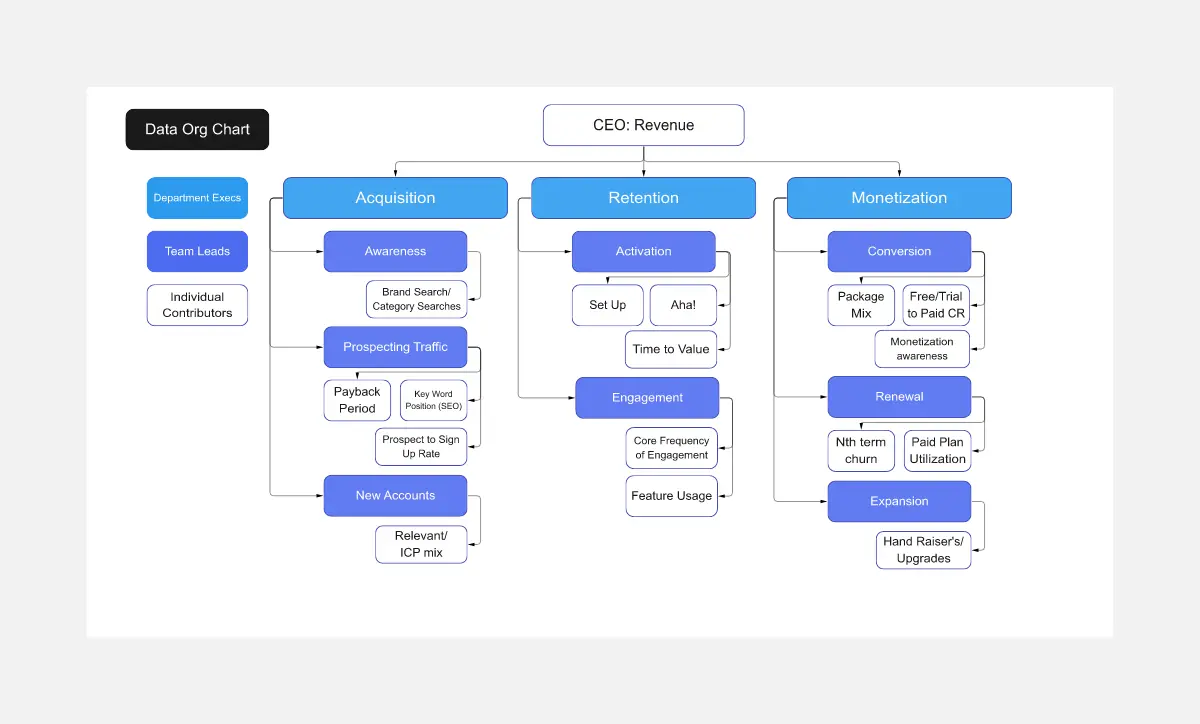
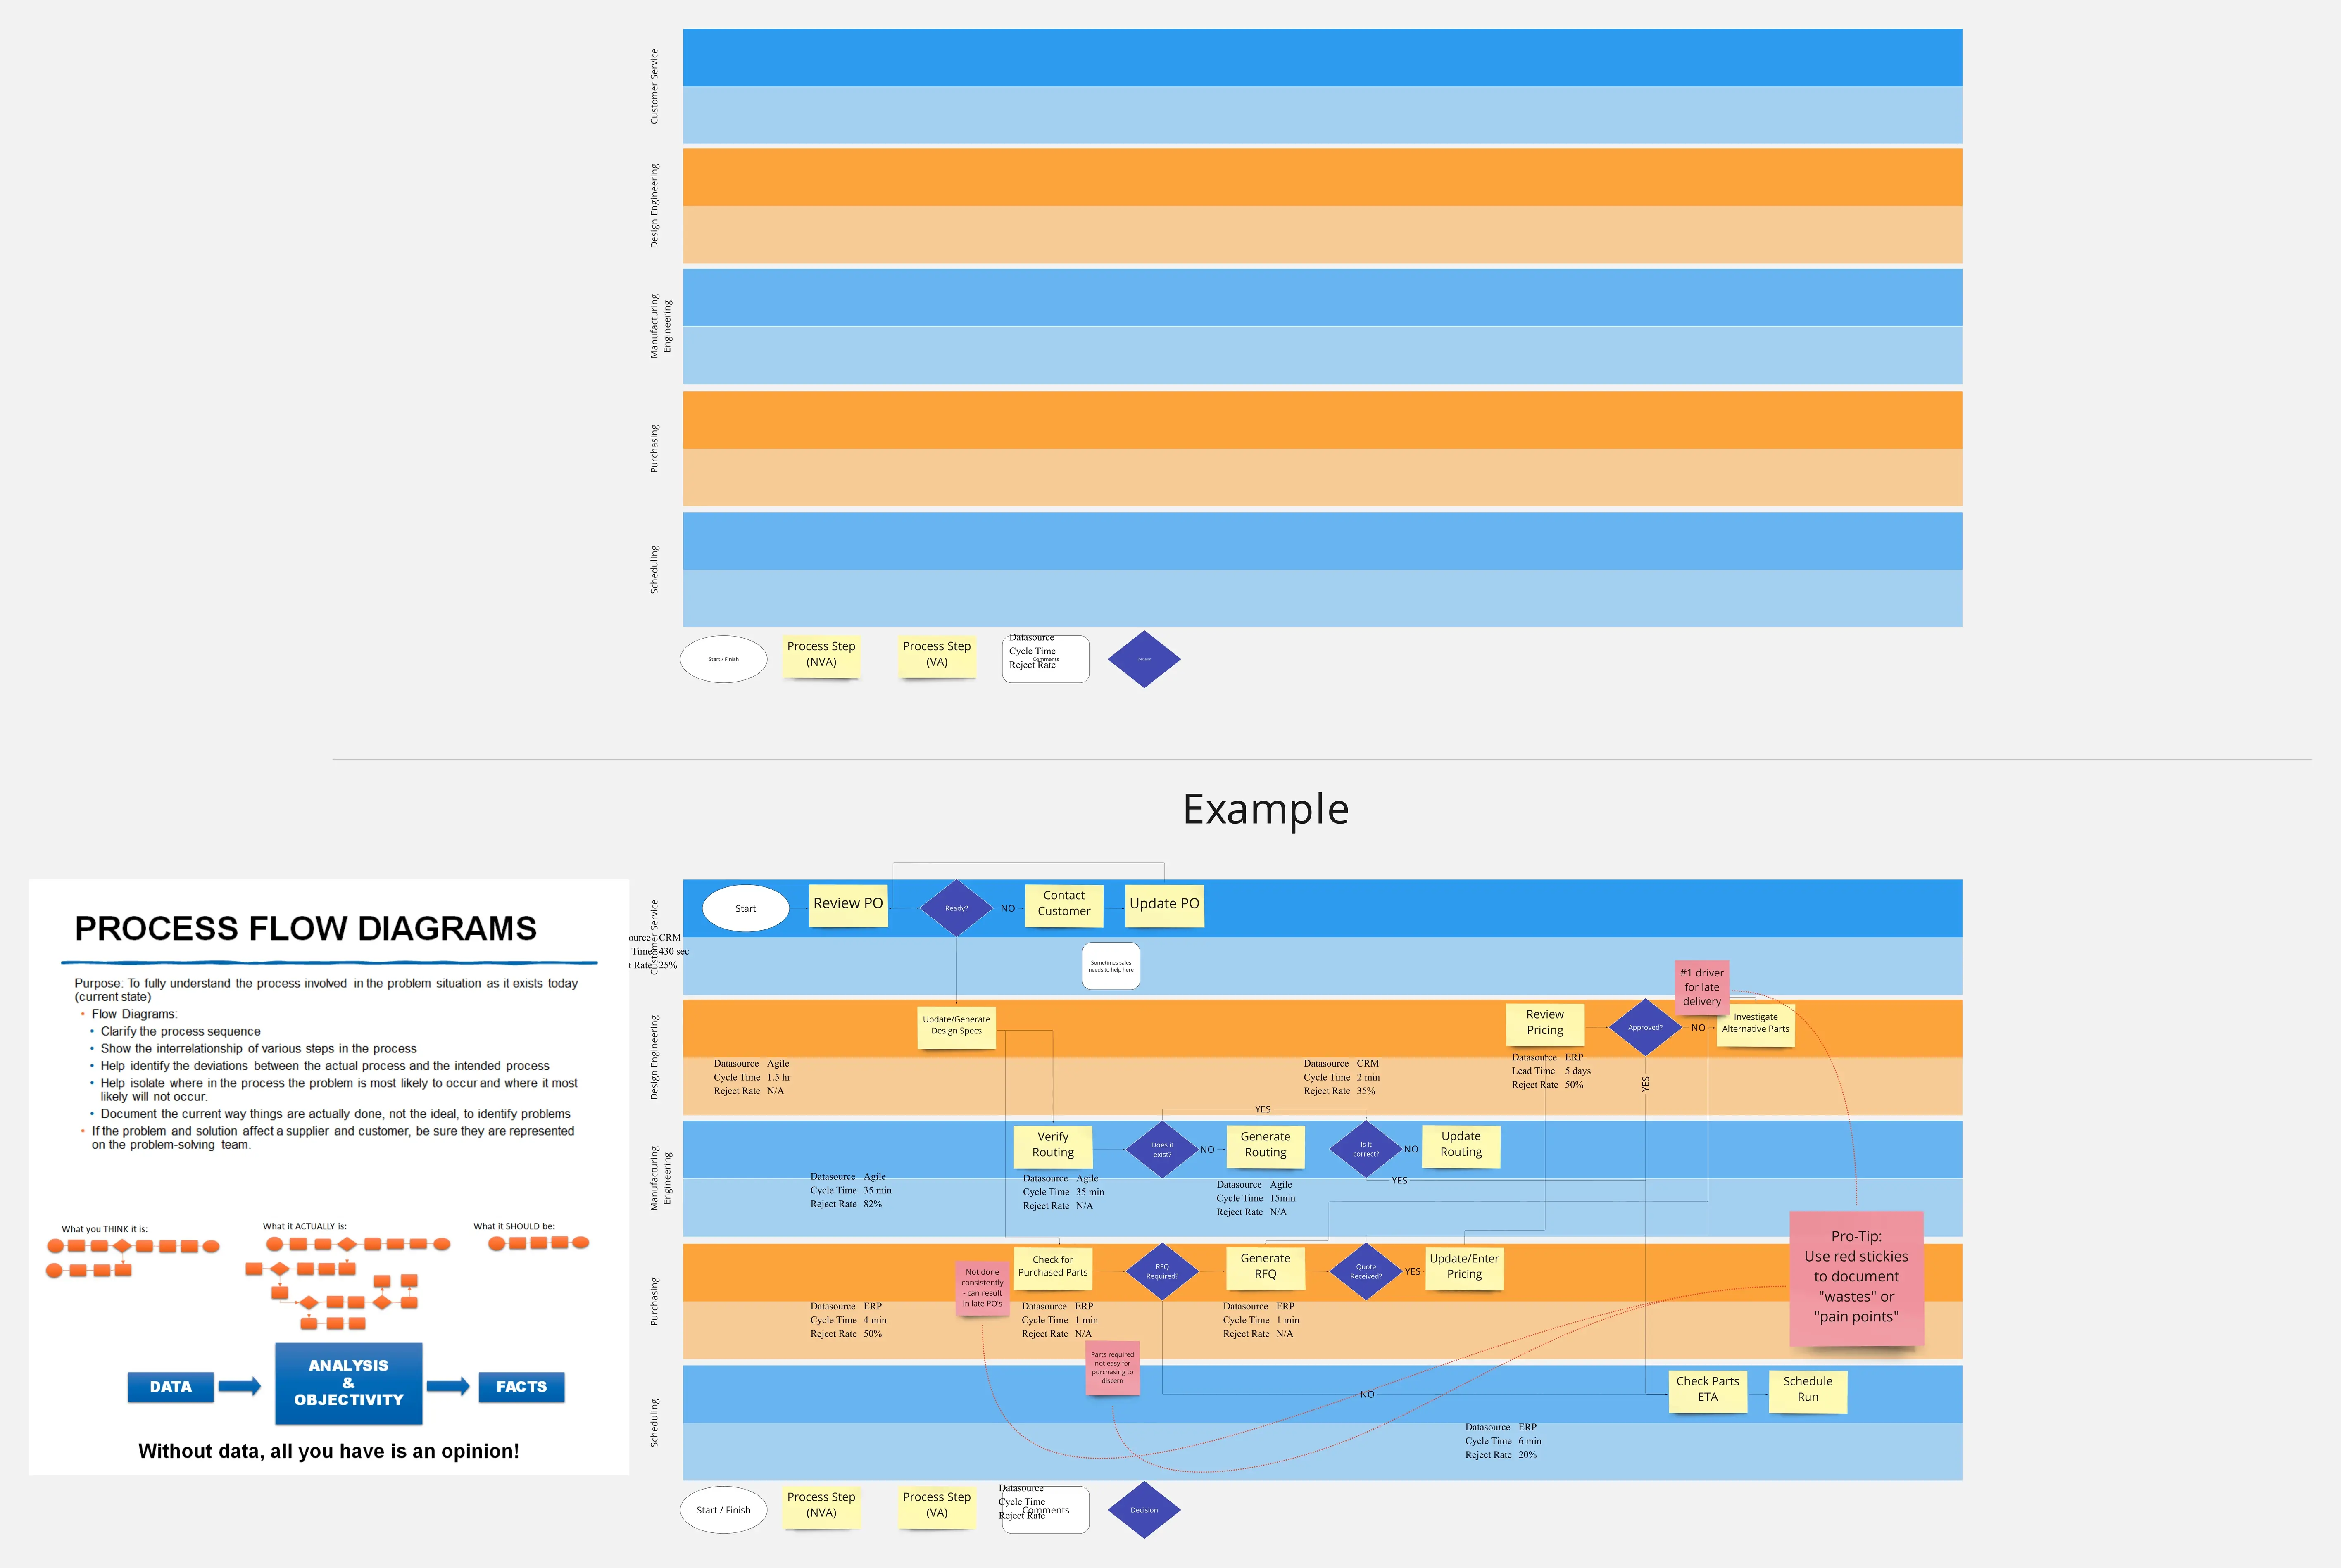
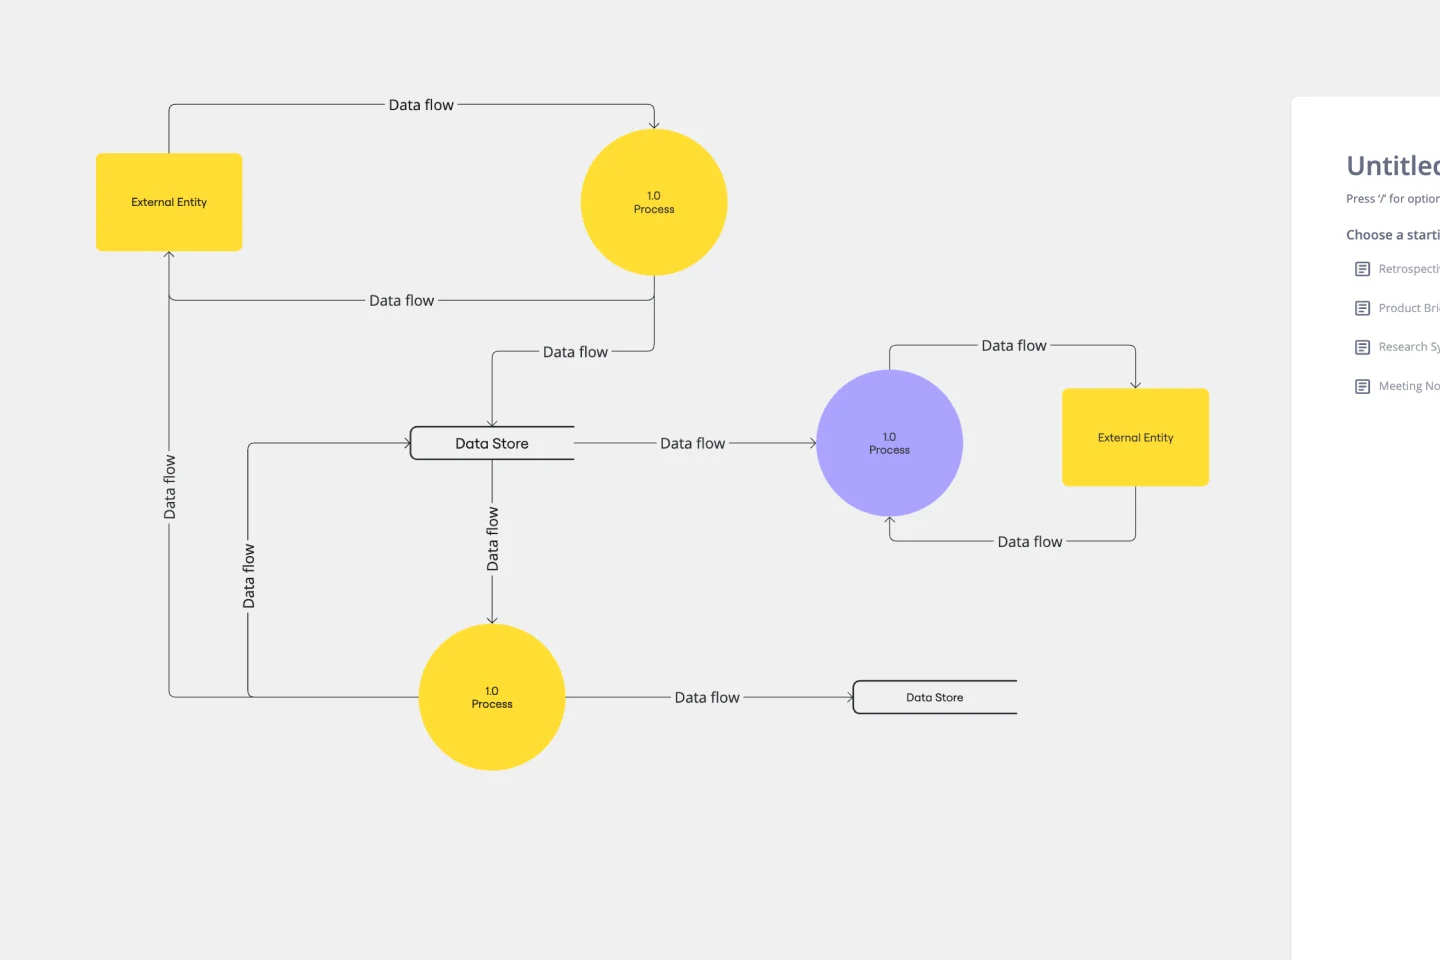
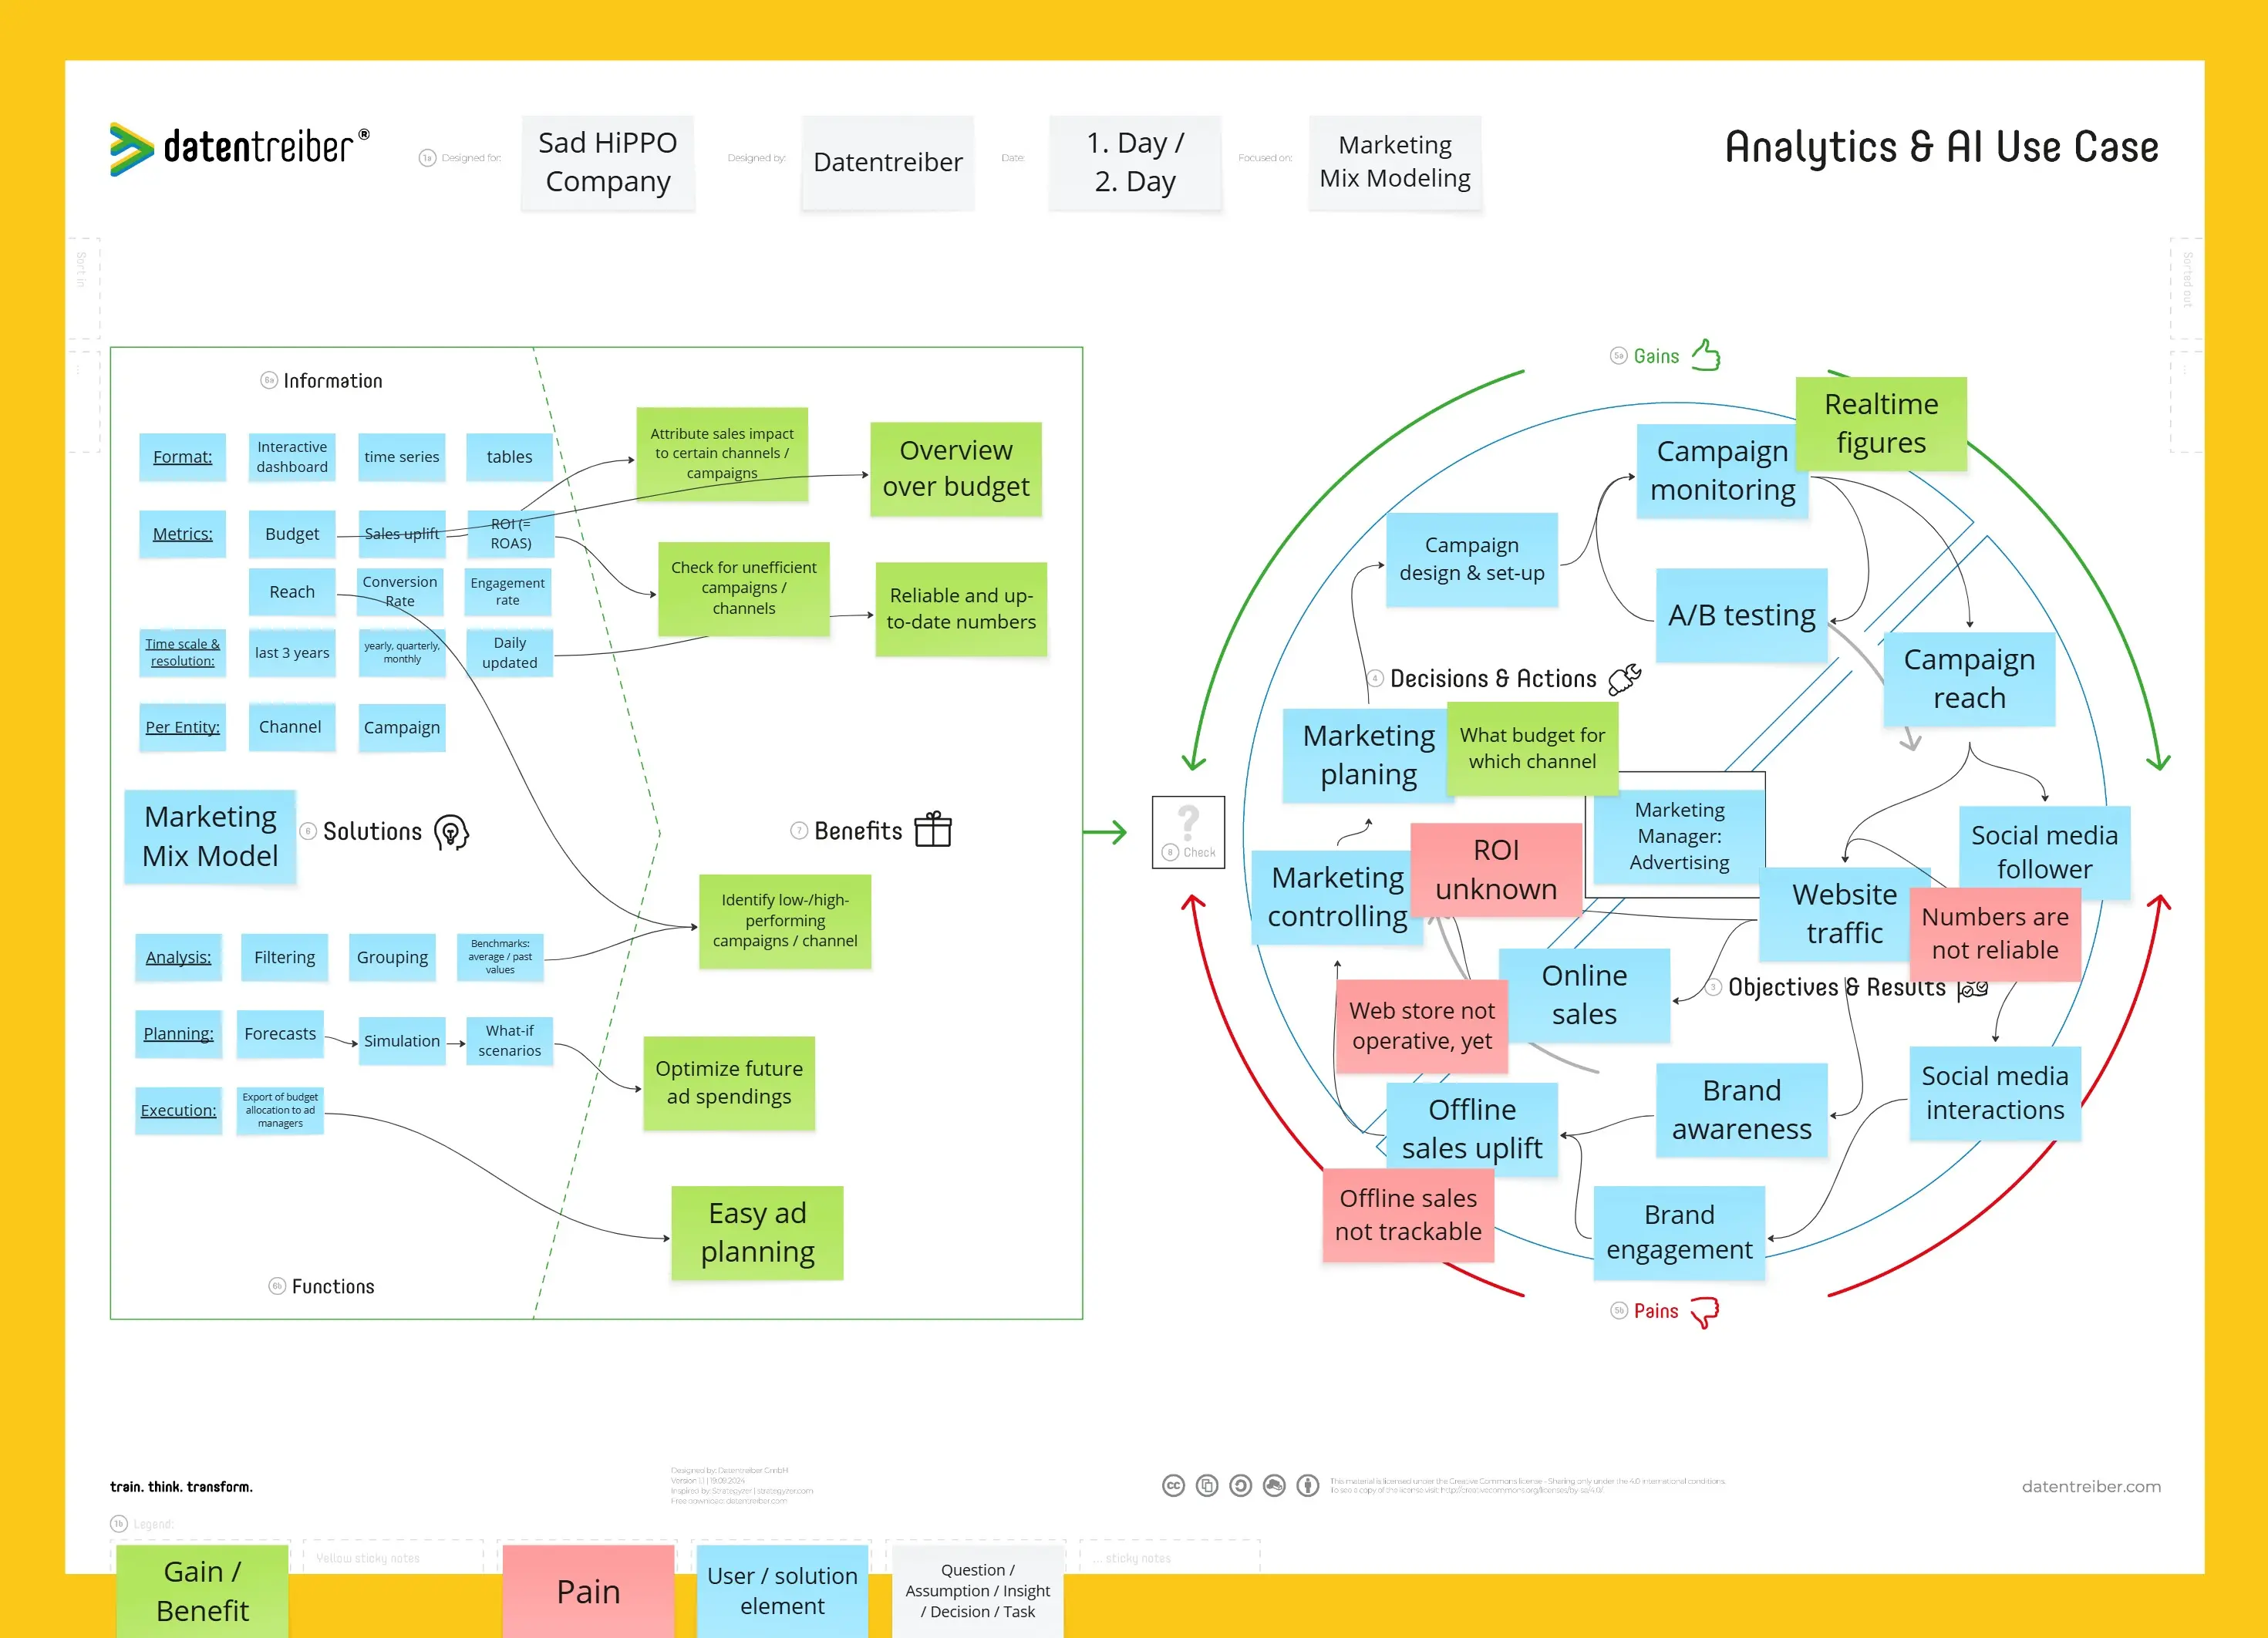
Visual frameworks make complexity manageable. Transform overwhelming datasets into scannable structures. Map customer segments across behavioral axes or chart metric relationships through connected diagrams. Stakeholders grasp complex analyses at a glance.
Contextual collaboration keeps everyone aligned. Link quantitative findings to user research boards, product roadmaps, or strategic planning sessions. When teammates see how your churn prediction model connects to customer experience issues, they make smarter decisions faster.
Real-time co-analysis eliminates bottlenecks. Stop being the bottleneck for every data question. Invite stakeholders onto your analysis board where they explore findings, add domain expertise, and ask questions directly on relevant charts.
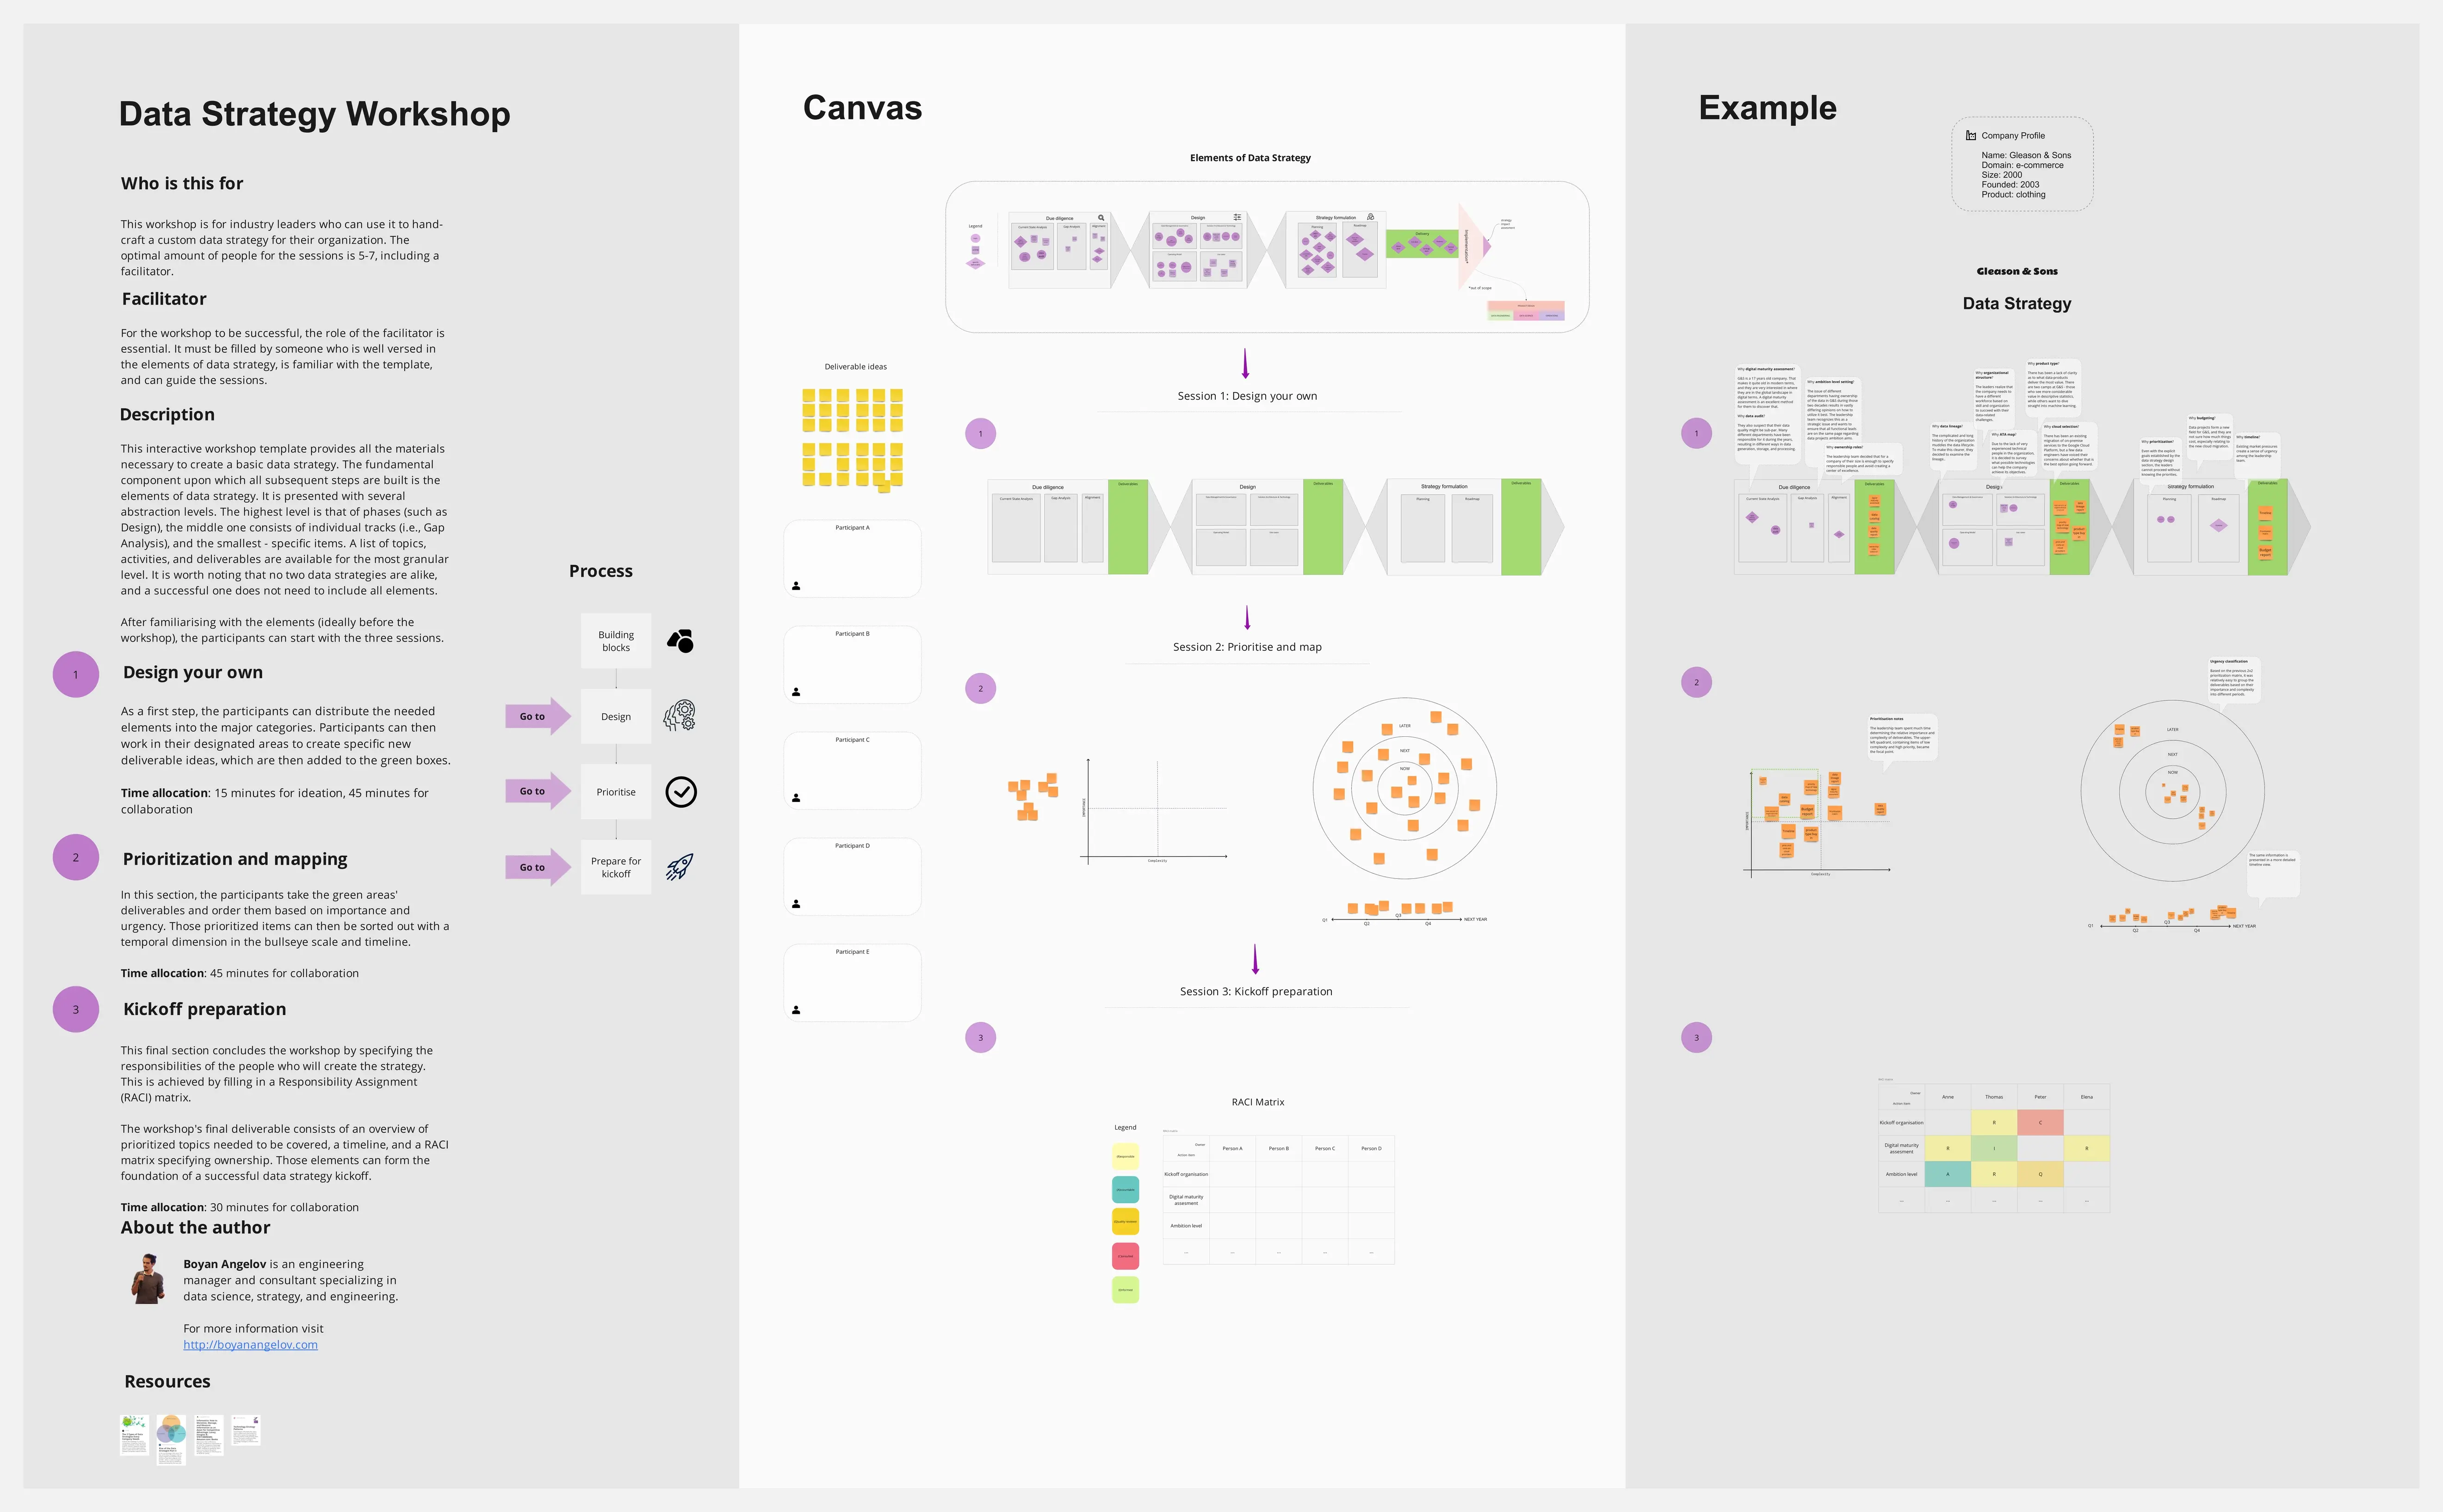
Flexible canvas adapts to any approach. Start with a hypothesis map, expand into detailed statistical analysis, then reorganize for executive presentation—all without switching tools or losing context.
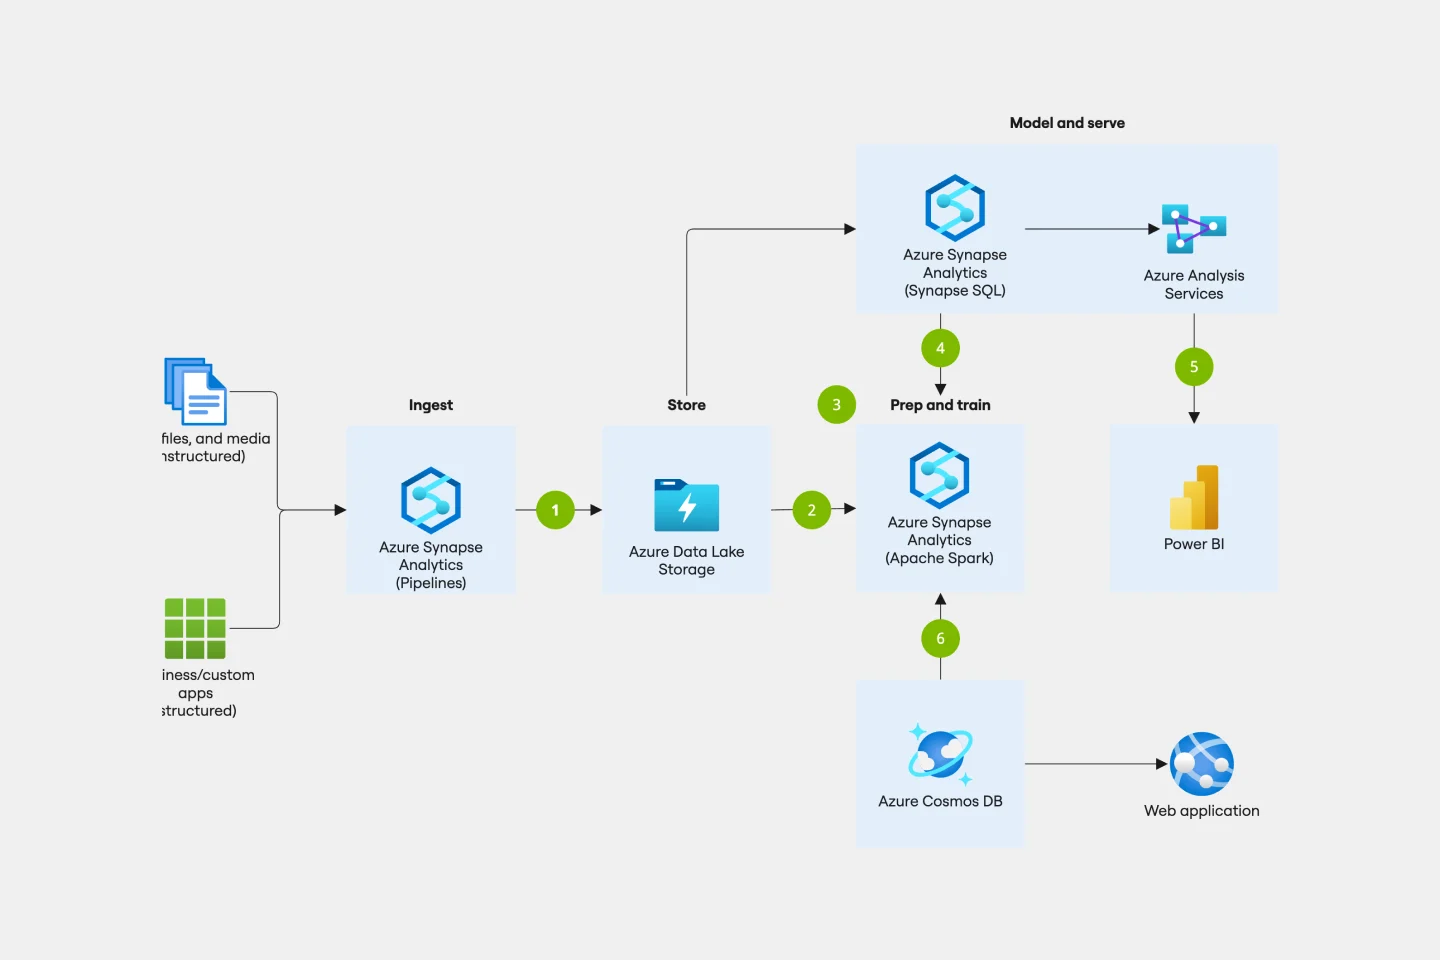
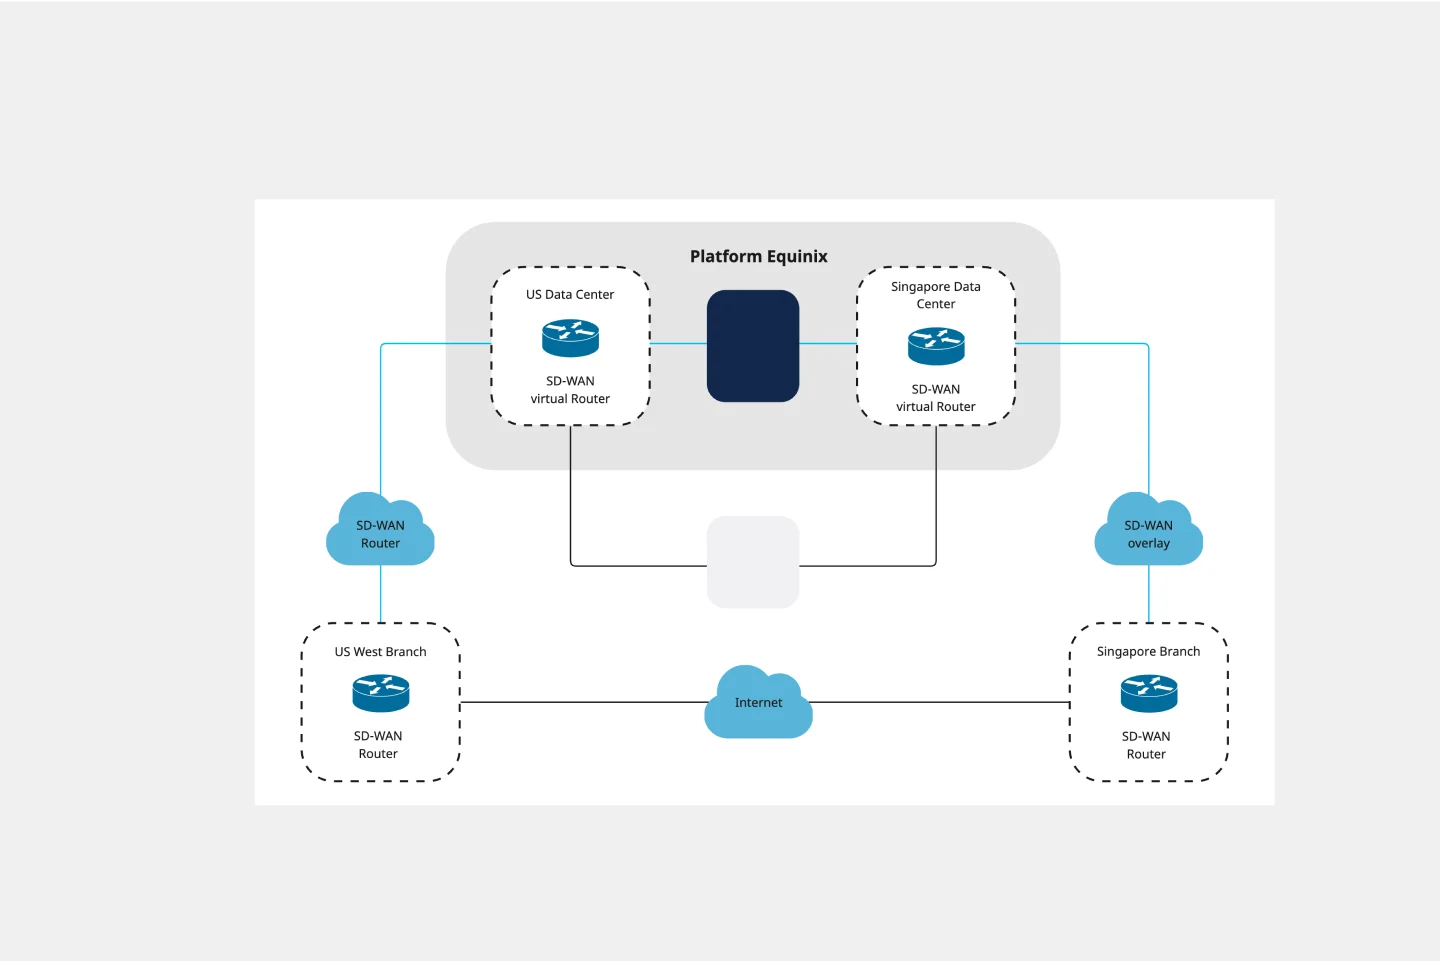
Seamless integration with your data stack. Bring in visualizations from Tableau, charts from Python notebooks, or exports from your BI tools. Miro becomes the connective tissue between your technical tools and collaborative decision-making.
How to use the analytics templates
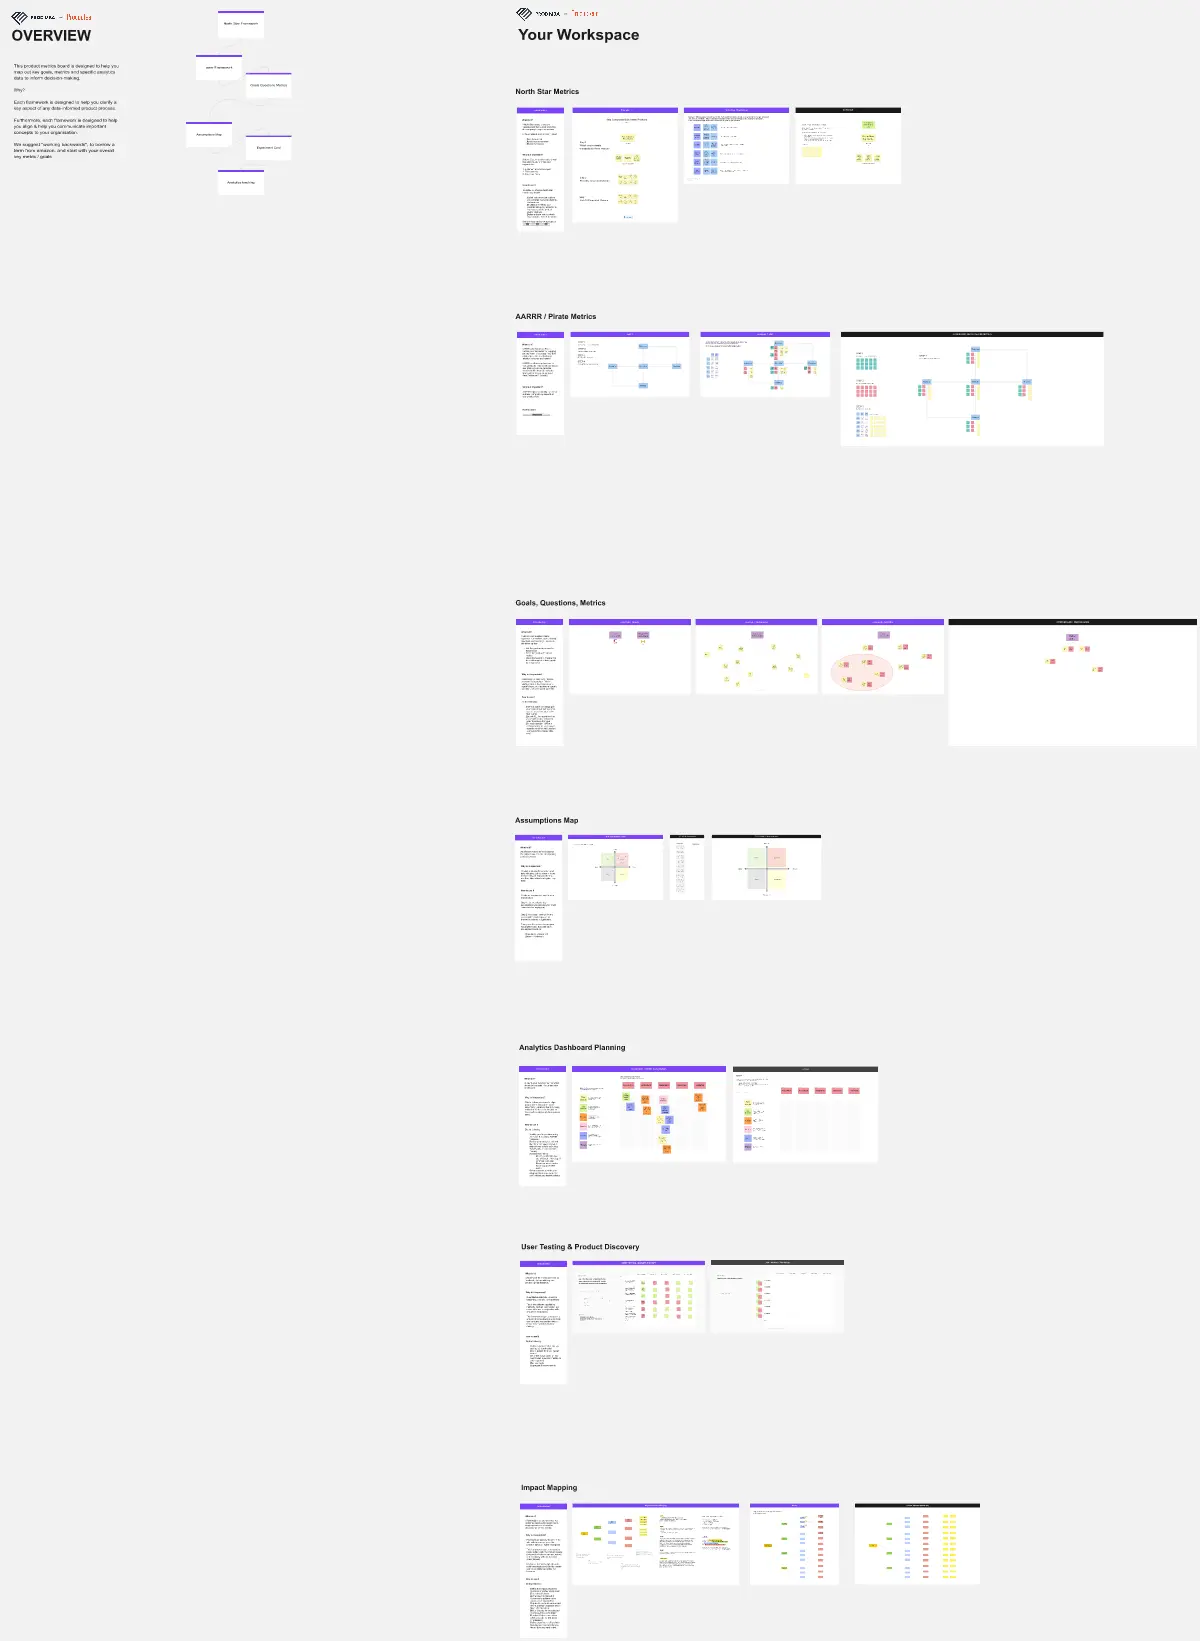
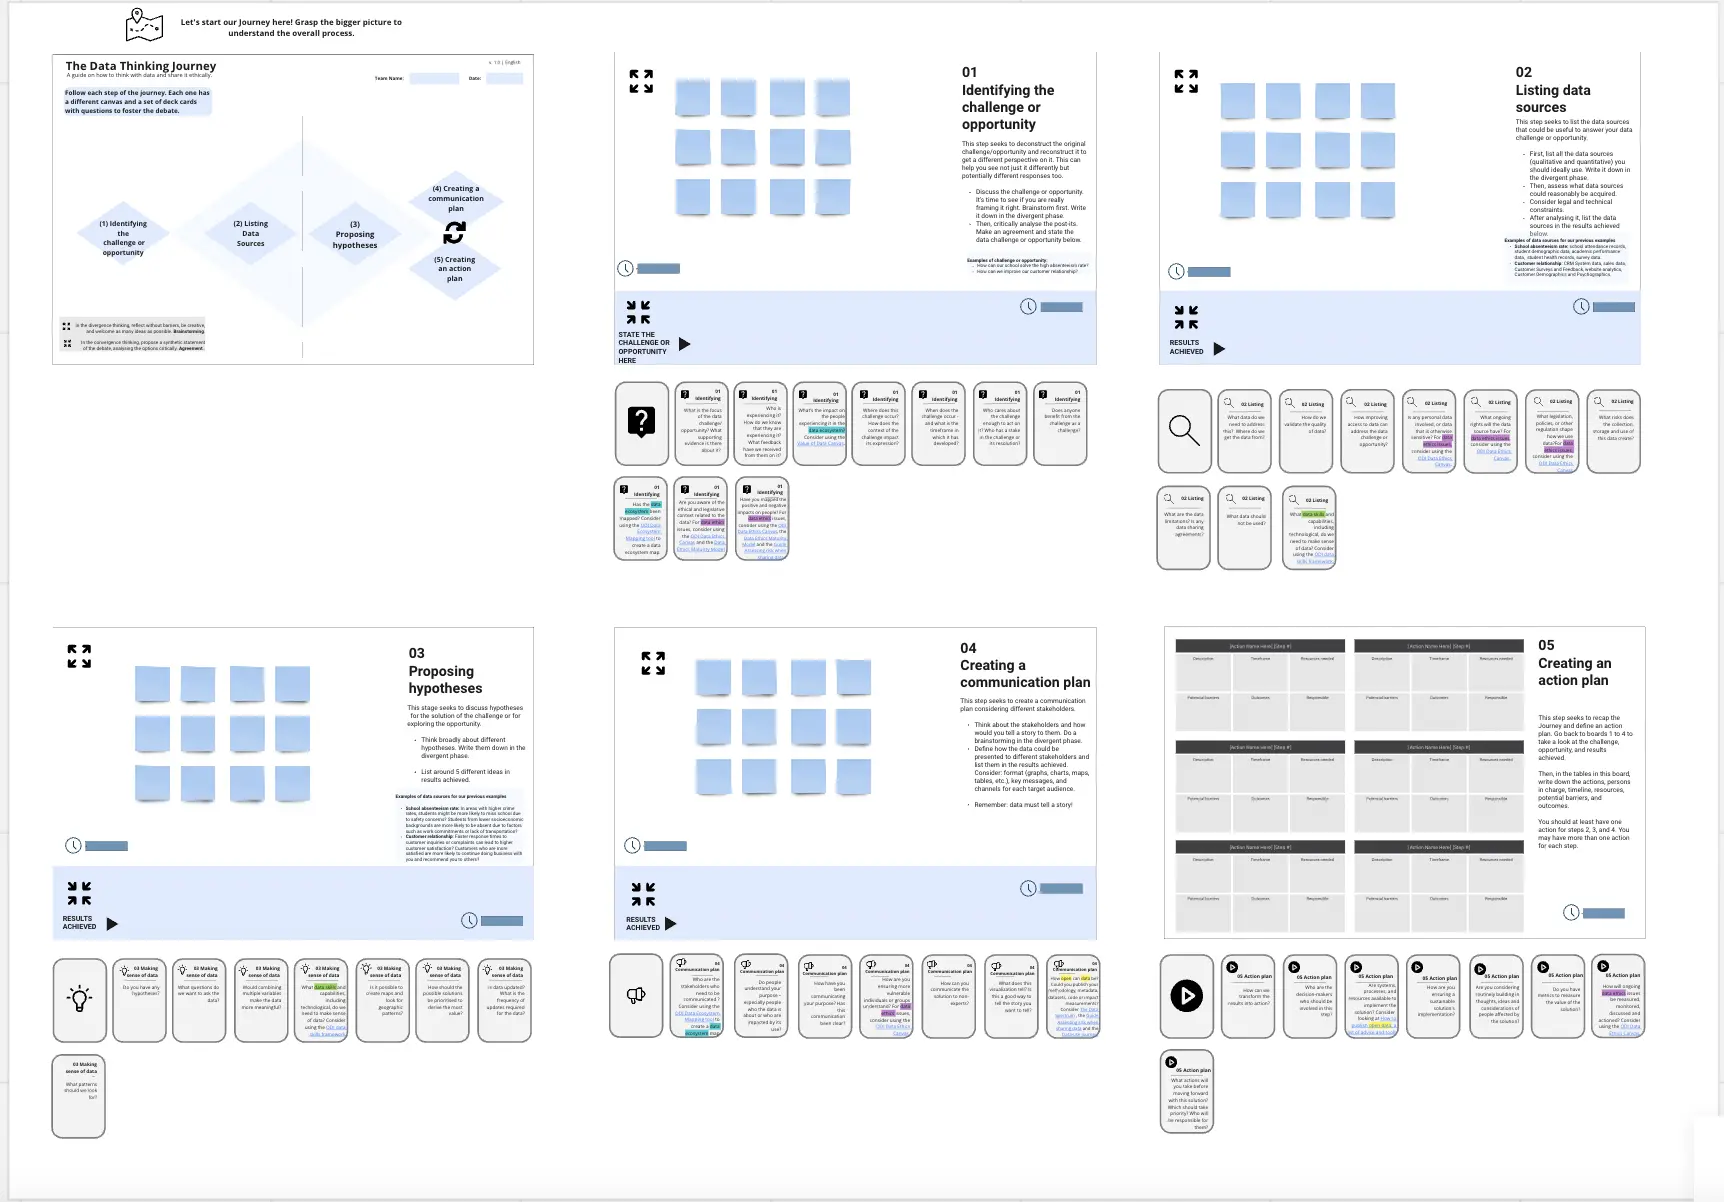
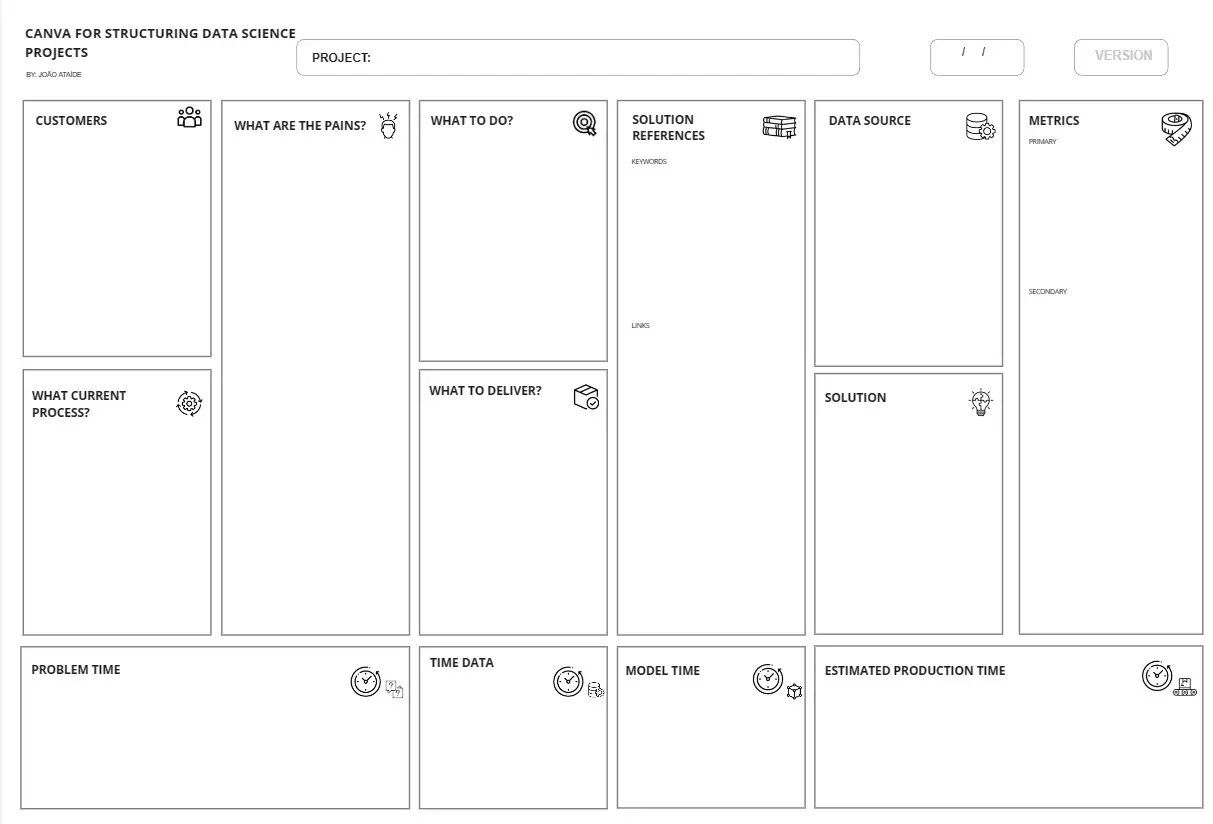
Step 1: Select your analytical framework. Browse the collection for a template matching your project needs—whether exploring customer behavior, building predictive models, or presenting quarterly insights.
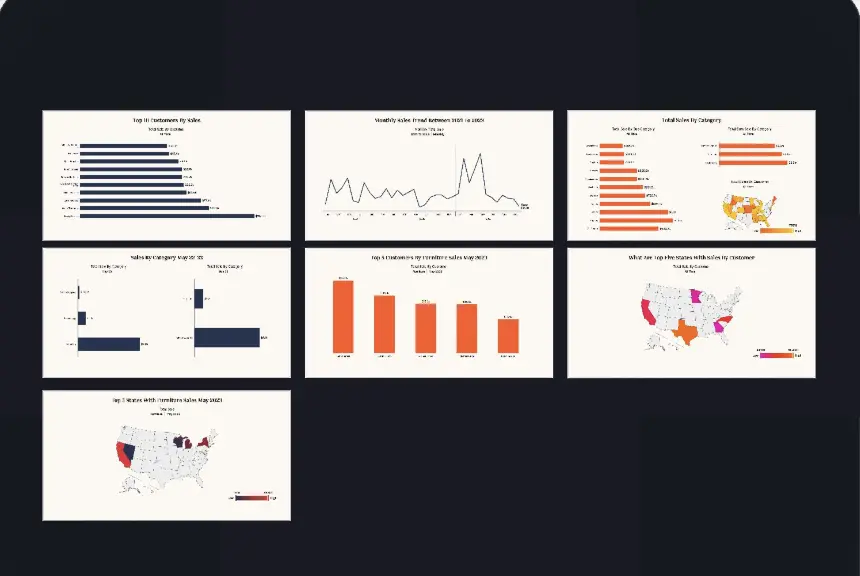
Step 2: Import and organize your data. Bring datasets, visualizations, and preliminary findings into the template. Add charts from your analysis tools, embed interactive dashboards, or paste screenshots of key findings.
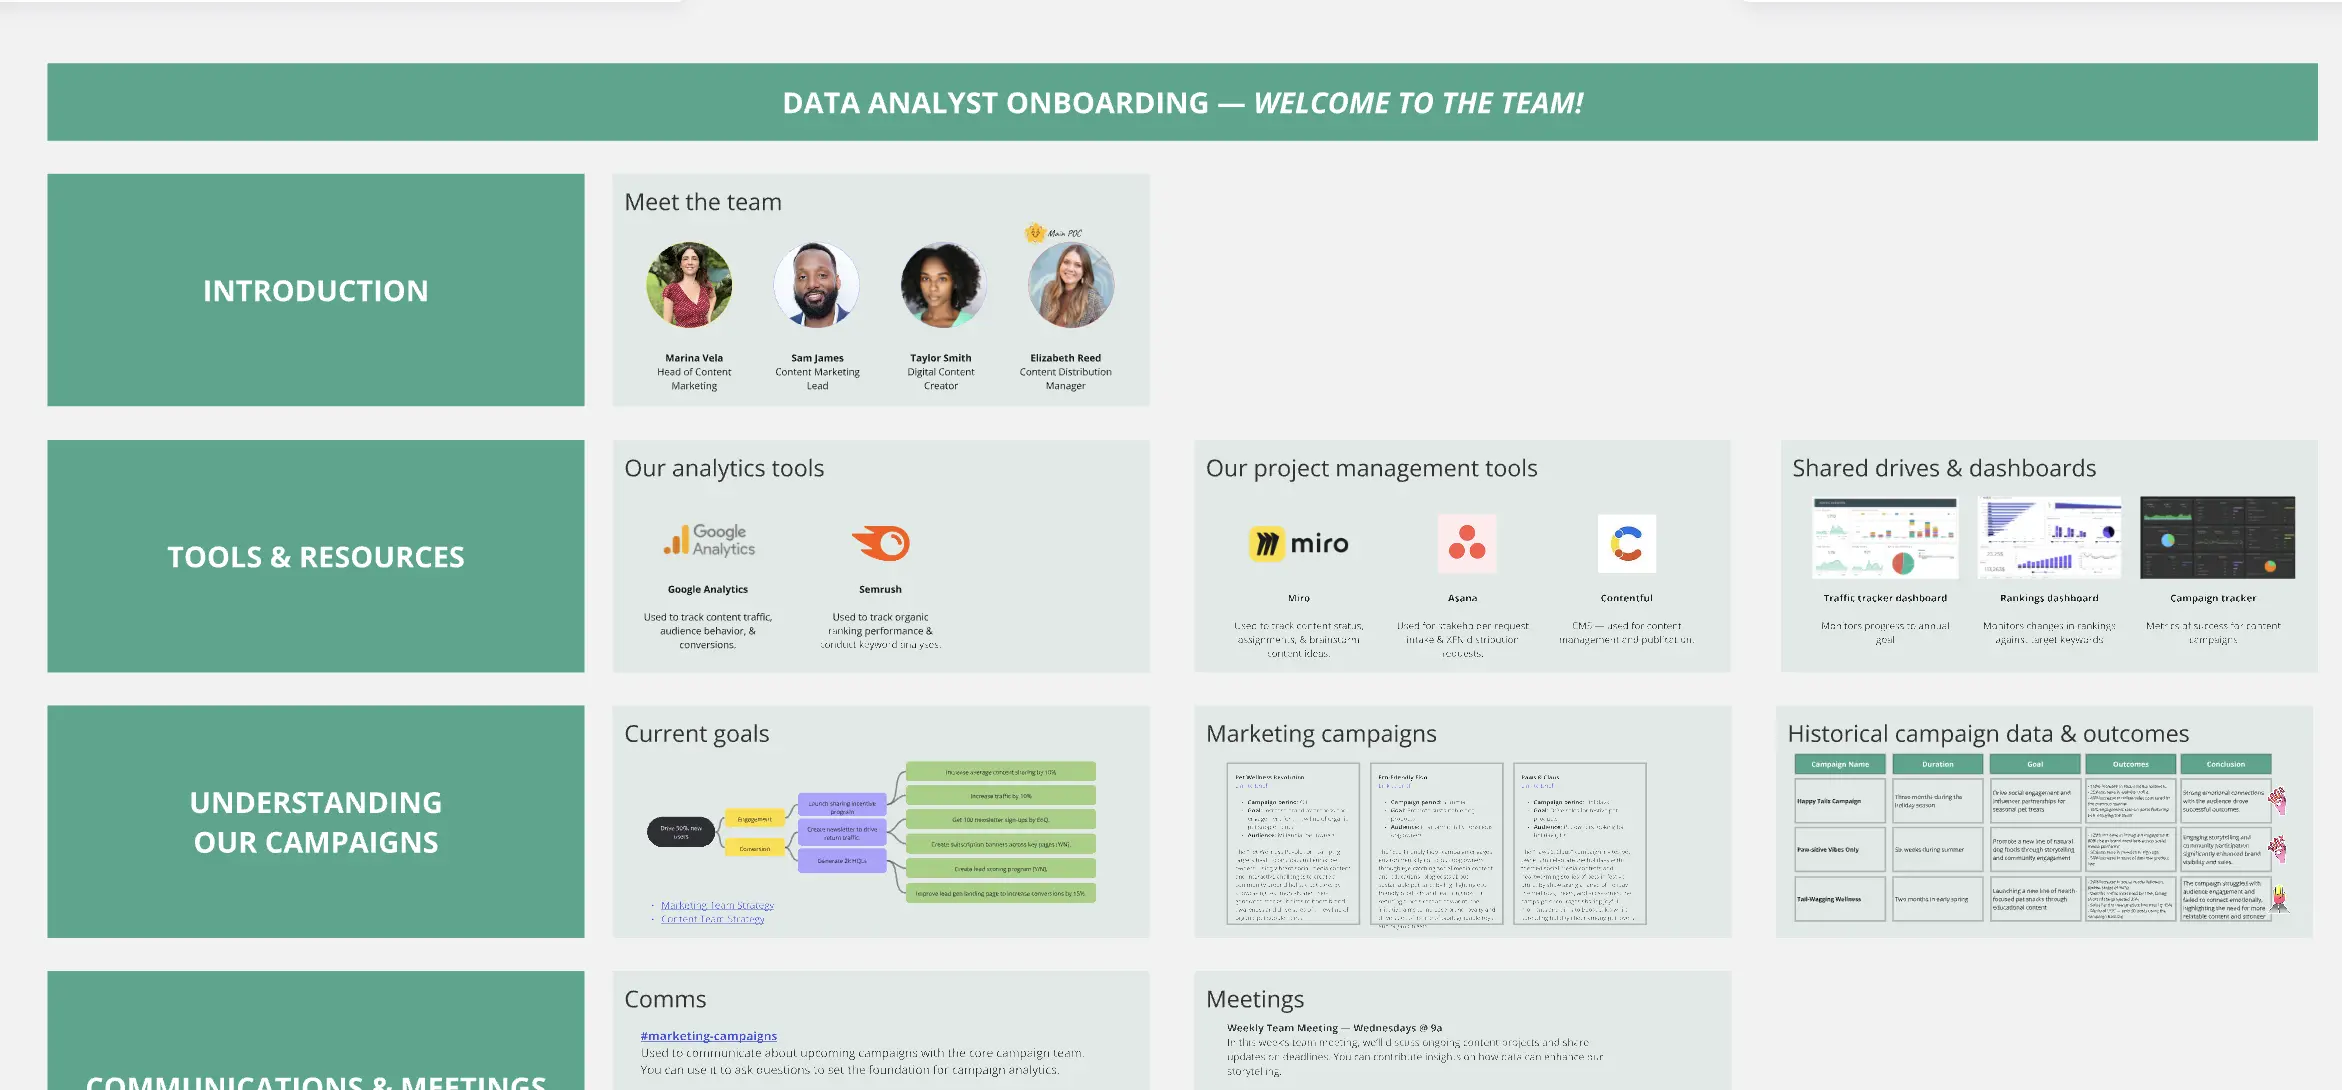
Step 3: Add context and connections. Link customer segments to persona profiles. Connect metric trends to product release timelines. Annotate anomalies with explanations. Transform numbers into narratives your team can act on.
Step 4: Invite collaborative exploration. Share your board with stakeholders. Use commenting to facilitate discussions on specific data points. Enable teammates to add insights, flag patterns, or raise questions about findings.
Step 5: Present with confidence. Use presentation mode to guide stakeholders through your findings. Walk through your data story from hypothesis to conclusion using the same workspace where you conducted the analysis.
Save successful workflows as custom templates to standardize your methodology across projects and help new team members quickly understand your analytical frameworks.
FAQ about analytics & data science templates
How does Miro AI help with data analysis?
Miro AI generates organizational frameworks for your findings, creates visual summaries of complex datasets, and suggests effective ways to structure insights for different audiences. Less time on presentation logistics, more time on what the data reveals.
Can Miro replace my BI tools or statistical software?
Miro complements your existing analytics stack rather than replacing it. Think of Miro as the collaborative layer where Tableau, Python, R, SQL, and Excel handle computational work, while Miro provides the visual workspace where those insights become collaborative decisions.
How do non-technical team members contribute to data analysis in Miro?
Miro's visual approach lets product managers, designers, and marketers engage meaningfully without technical expertise. They can comment on insights, connect findings to their domain knowledge, ask clarifying questions on charts, and help prioritize which analyses matter most.
What types of analytics workflows work best in Miro?
Miro excels at exploratory analysis, hypothesis development, customer segmentation, user behavior mapping, experiment planning and review, insight synthesis across multiple data sources, and collaborative interpretation of findings—particularly for projects requiring cross-functional input.
Ready to transform isolated data analysis into collaborative insight development? Explore the analytics templates and help your team see what the numbers really mean.