Azure Data Flow Template
The Azure Data Flow is a diagram that will allow you to combine data and build and deploy custom machine learning models at scale.
Trusted by 65M+ users and leading companies
About the Azure Data Flow Template
The Azure Data Flow Template will show you how to transform your data into actionable insights using the best-in-class machine learning tools. This architecture allows you to combine data and build and deploy custom machine learning models at scale.
Keep reading to learn more about the Azure Data Flow Template.
What is an Azure Data Flow Template
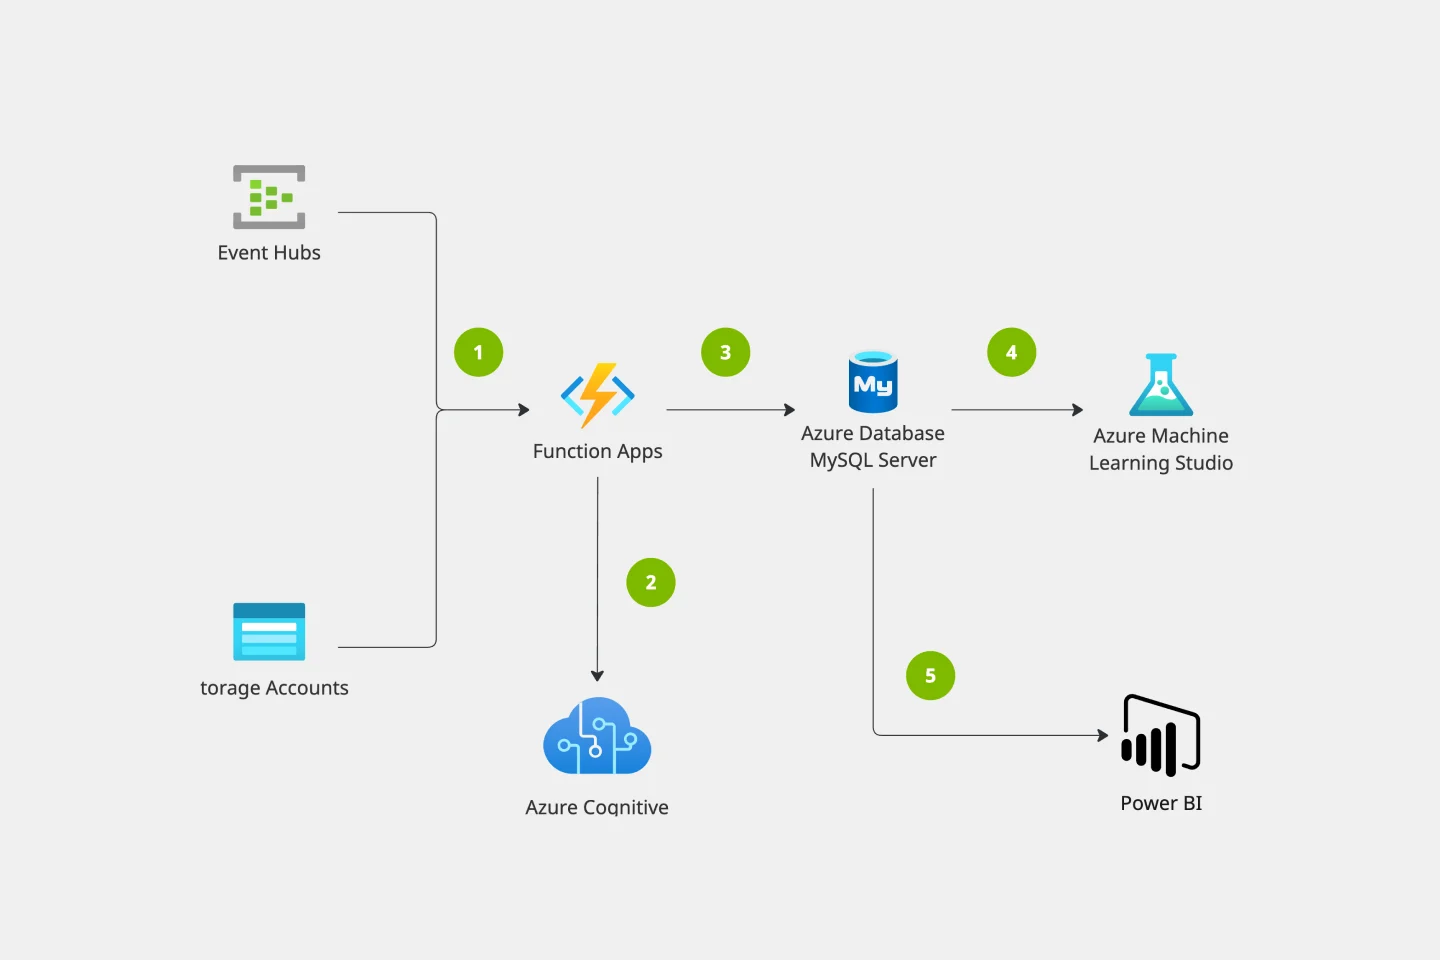
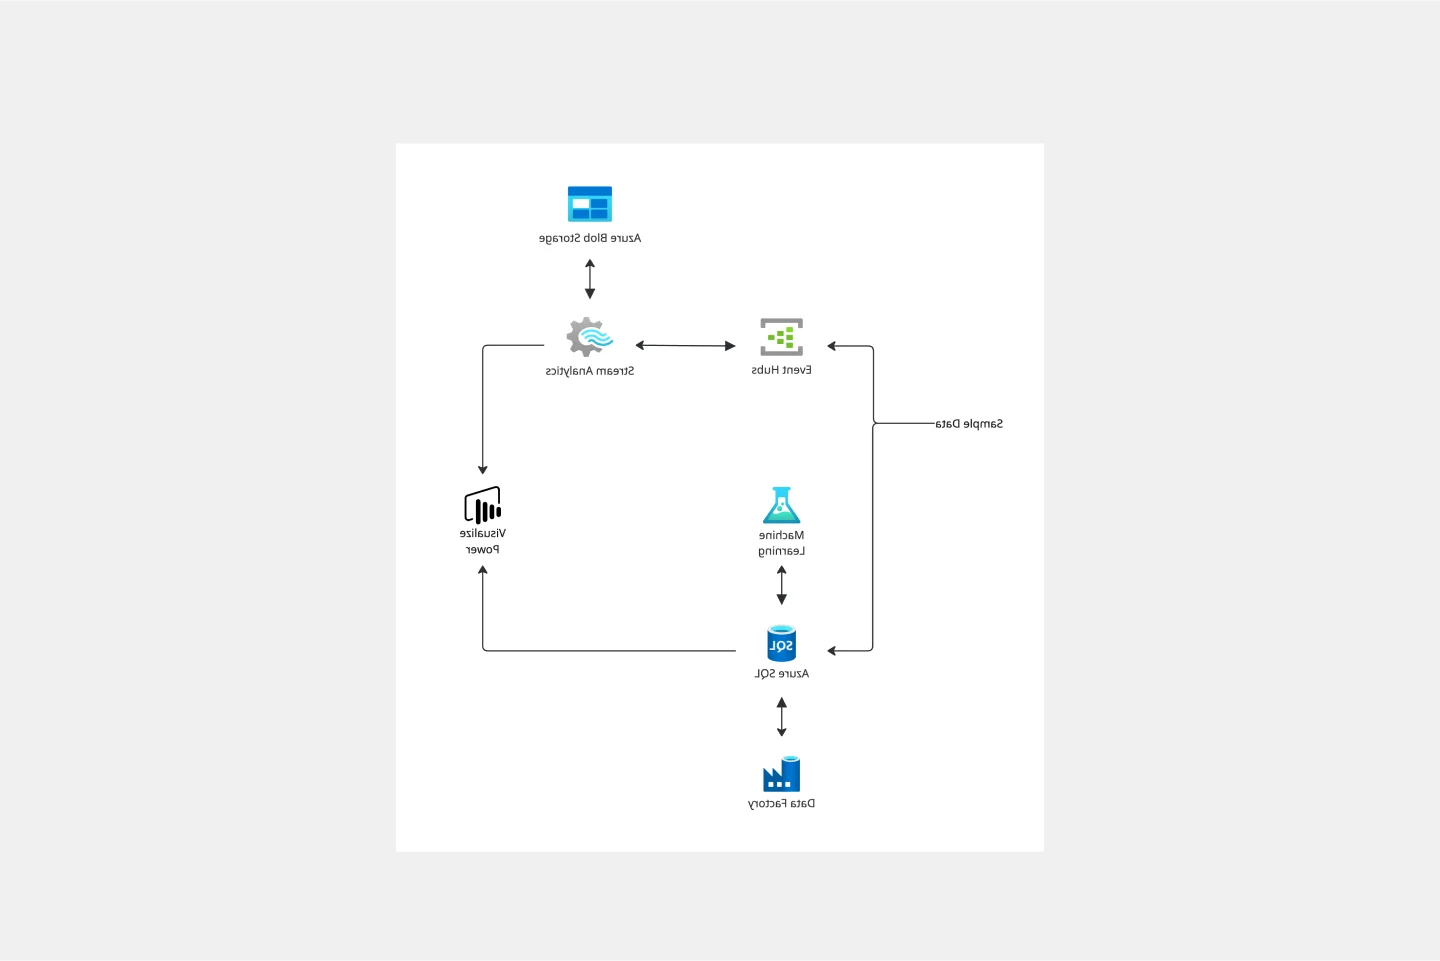
The Azure Data Flow Template visually shows the data flow to deploy and build custom machine learning models. The Azure Data Flow Template has unique icons categorized into Stencils. Each Stencil focuses on a specific task to make it easier for users to access the right set of icons.
When to use Azure Data Flow Template
You can use the Azure Data Flow Template to transform your data into actionable insights and better inform decision making. Collect data, analyze it, and use it to make decisions surrounding your architecture, from cost data, to performance, to user load, using data will guide you to make the right choices in your environment.
To build your Azure Data Flow Template, check out these best practices:
Do’s
Use the icon to illustrate how products can work together
In diagrams, we recommend to include the product name somewhere close to the icon
Use the icons as they would appear within Azure
Don’ts
Don’t crop, flip or rotate icons
Don’t distort or change icon shape in any way
Don’t use Microsoft product icons to represent your product or service.
How do I make an Azure Data Flow Template?
To make an Azure Data Flow in Miro is easy. You can use our Azure Data Flow Template and customize it as you see fit. Once you have the diagram structure, you can start adding the icons. You can find the icons under our Azure Icon Set integration.
Get started with this template right now.
Company Organizational Chart
Works best for:
Org Charts, Operations, Mapping
An org chart is a visual guide that sums up a company’s structure at a glance—who reports to whom and who manages what teams. But it does more than just display the chain of command. It also showcases the structure of different departments and informs employees who to reach out to with issues and concerns. That makes it an especially valuable tool for new hires who are getting familiar with the company. Our templates make it easy for you to add your entire team and customize the chart with colors and shapes.
Azure Demand Forecasting Template
Works best for:
Software Development, Diagrams
The Azure Demand Forecasting diagram will show the architecture of a demand forecast, making it easier for you to predict data consumption, costs, and forecast results. Azure is Microsoft’s cloud computing platform, designed to provide cloud-based services such as remote storage, database hosting, and centralized account management. Azure also offers new capabilities like AI and the Internet of Things (IoT).
Cynefin Framework Template
Works best for:
Leadership, Decision Making, Prioritization
Companies face a range of complex problems. At times, these problems leave the decision makers unsure where to even begin or what questions to ask. The Cynefin Framework, developed by Dave Snowden at IBM in 1999, can help you navigate those problems and find the appropriate response. Many organizations use this powerful, flexible framework to aid them during product development, marketing plans, and organizational strategy, or when faced with a crisis. This template is also ideal for training new hires on how to react to such an event.
User Flow Template
Works best for:
Desk Research, Flowcharts, Mapping
User flows are diagrams that help UX and product teams map out the logical path a user should take when interacting with a system. As a visual tool, the user flow shows the relationship between a website or app’s functionality, potential actions a user could take, and the outcome of what the user decides to do. User flows help you understand what a user does to finish a task or complete a goal through your product or experience.
Meeting Template
Works best for:
Meetings, Team Meetings, Workshops
Everyone has been in a meeting that didn’t go as planned. Maybe it ran off course, or you ran out of time to accomplish everything you set out to do -- or maybe it just felt like a waste of time. To avoid that, it’s important to prepare to run a team meeting ahead of time. With this simple but effective template, you can prepare to run a team meeting that ticks all the boxes. By creating a streamlined way to build preparation into your workflow, you’ll ensure your meetings are efficient, enjoyable, and collaborative.
AWS Architecture Diagram Template
Works best for:
Software Development, Diagrams
The AWS Architecture Diagram is a visual representation of the AWS framework, and it also translates the best practices when using Amazon Web Services architecture. You can now have an overview of your AWS architecture with Miro’s AWS Architecture Diagram Template, track your cloud solutions easily, and optimize processes like never before.