Consultant templates
From scattered client data and disjointed deliverables to strategic clarity that drives real results—deliver consistently excellent work with templates built for how consultants actually work.
You've been there: juggling multiple client projects, each with unique frameworks and expectations. Recreating strategy decks from scratch. Searching through old files for that workshop format that worked perfectly six months ago. Losing billable hours to setup instead of high-value thinking.
Picture starting your next engagement with a proven framework already in place. Walking into discovery sessions with structured templates that draw out exactly what you need to know. Collaborating with clients in real-time as you map their current state, identify gaps, and design their future state—all in one visual workspace they can see and interact with.
Miro's consultant templates create this kind of streamlined excellence. Focus on the insights and solutions that make you invaluable—not the administrative setup that drains your energy.
About the consultant templates collection
This collection serves management consultants, strategy advisors, and consulting teams who need to deliver high-impact work across diverse client engagements. These consultant templates support your core challenges: structuring new projects quickly, facilitating productive workshops, translating complex analyses into compelling recommendations, and maintaining consistency without sacrificing customization.
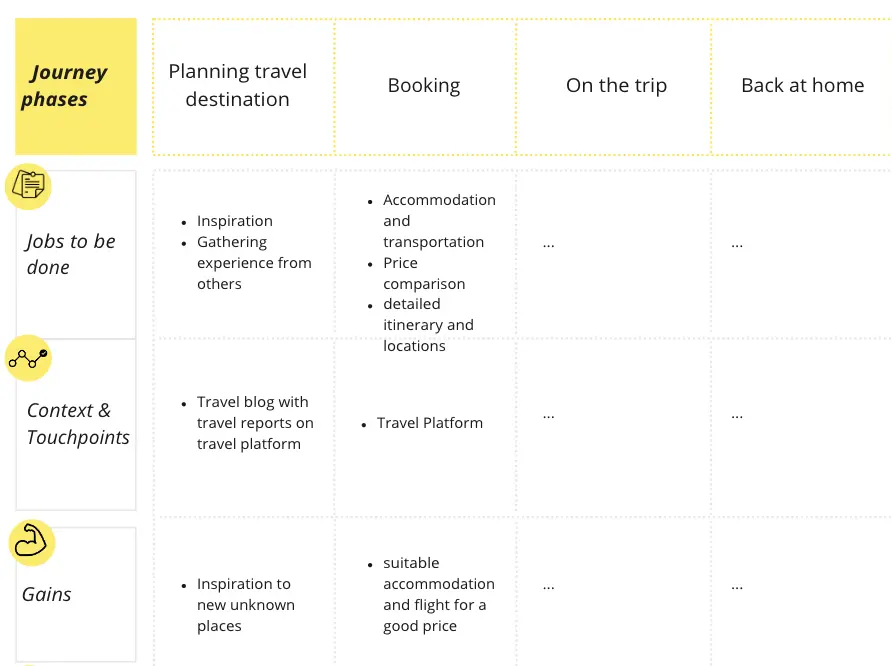
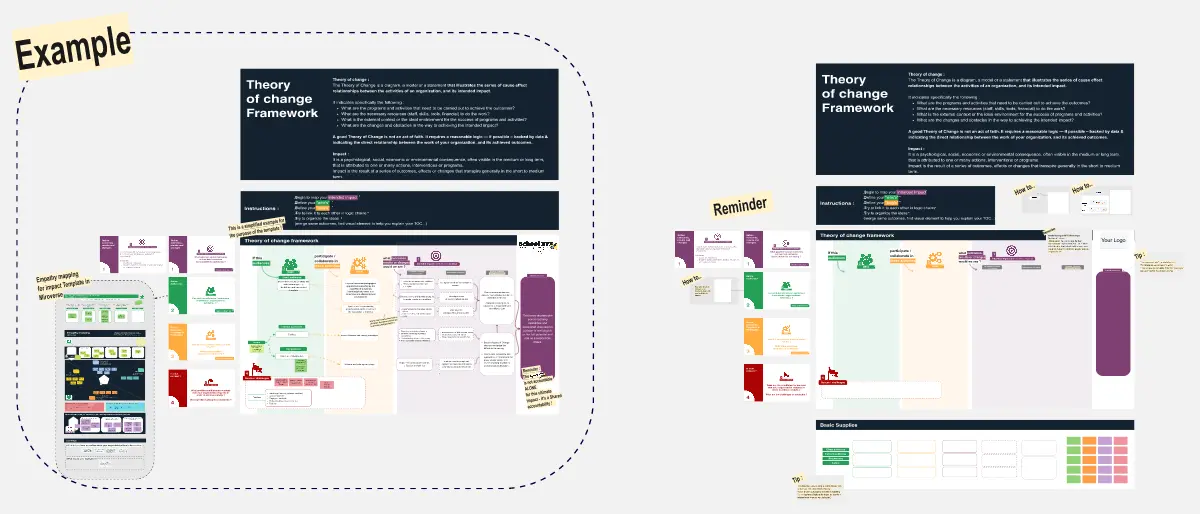
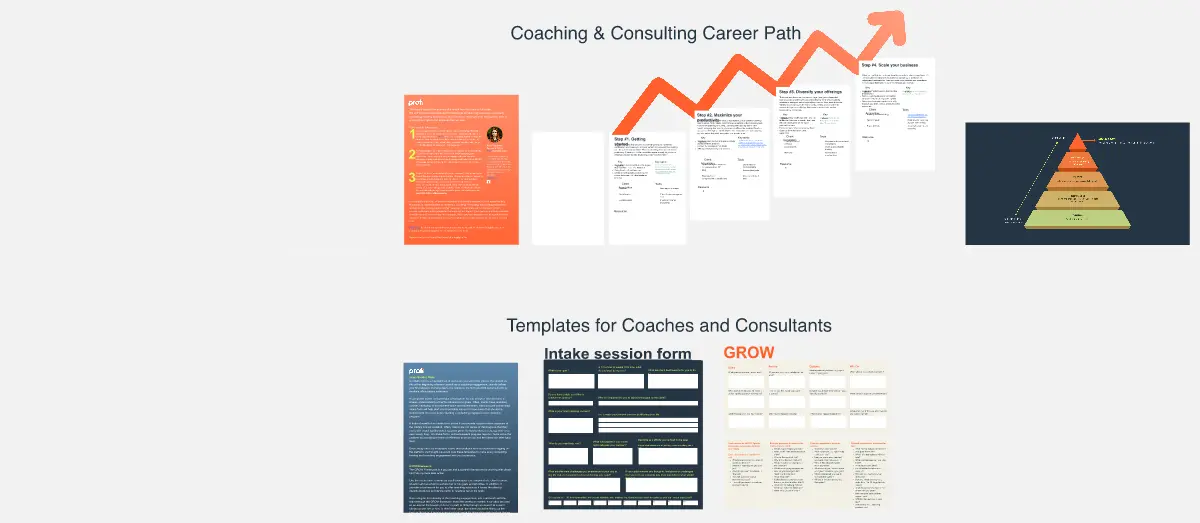
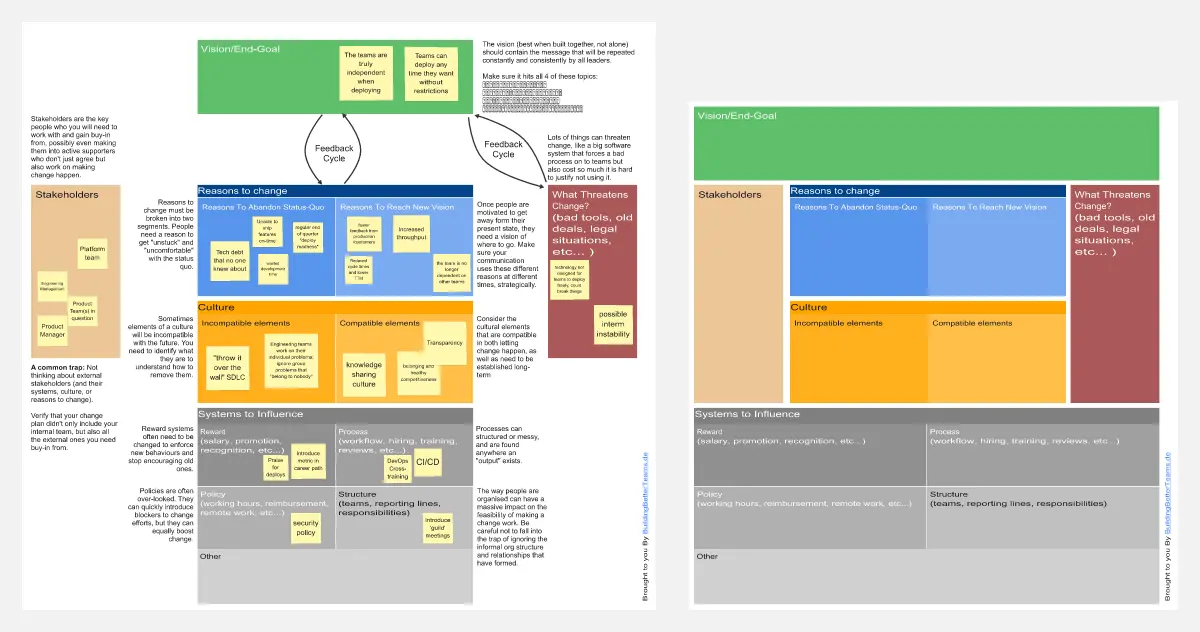
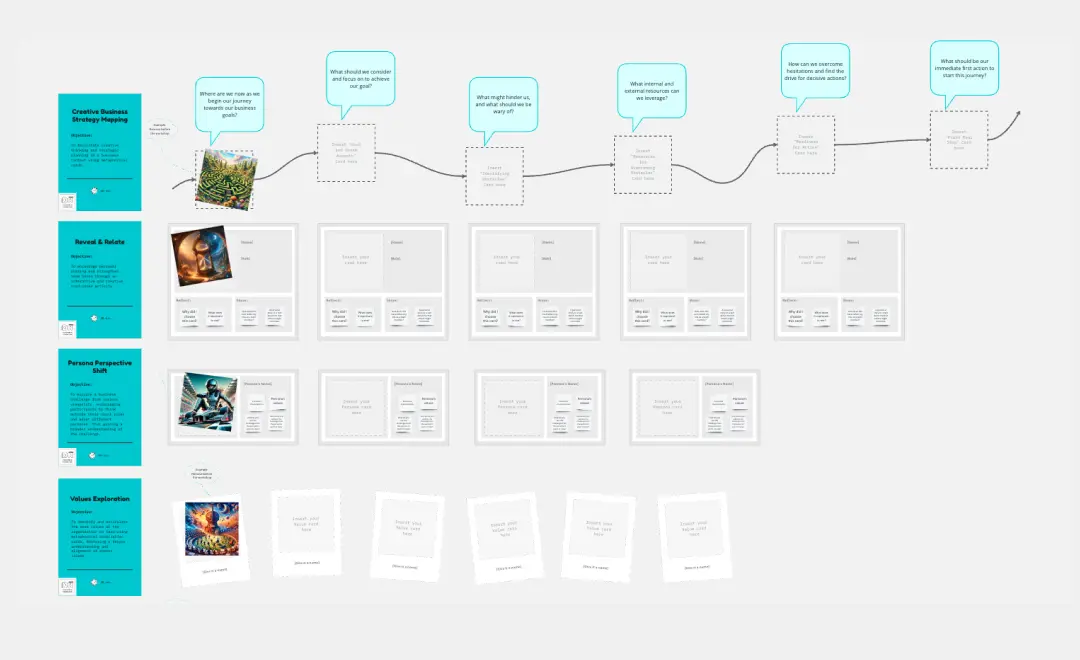
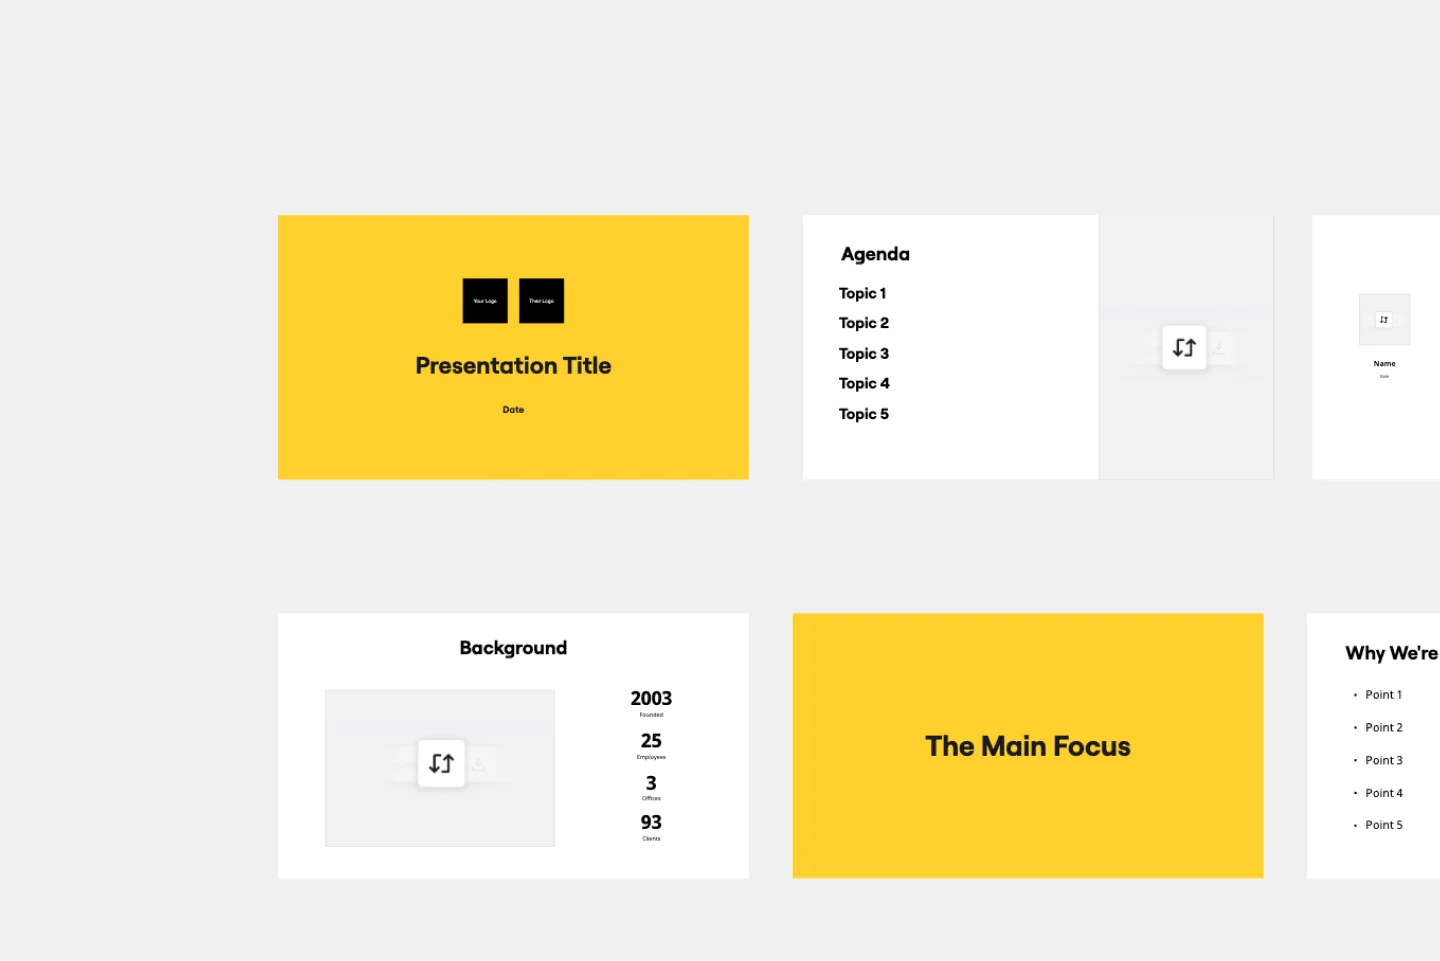
The templates span your entire consulting lifecycle—business model canvases, stakeholder maps, SWOT analyses, customer journey maps, change management plans, and presentation structures. Each provides the foundation for professional-grade deliverables while giving you flexibility to adapt for each client's unique context.
Why you'll love the consultant templates collection
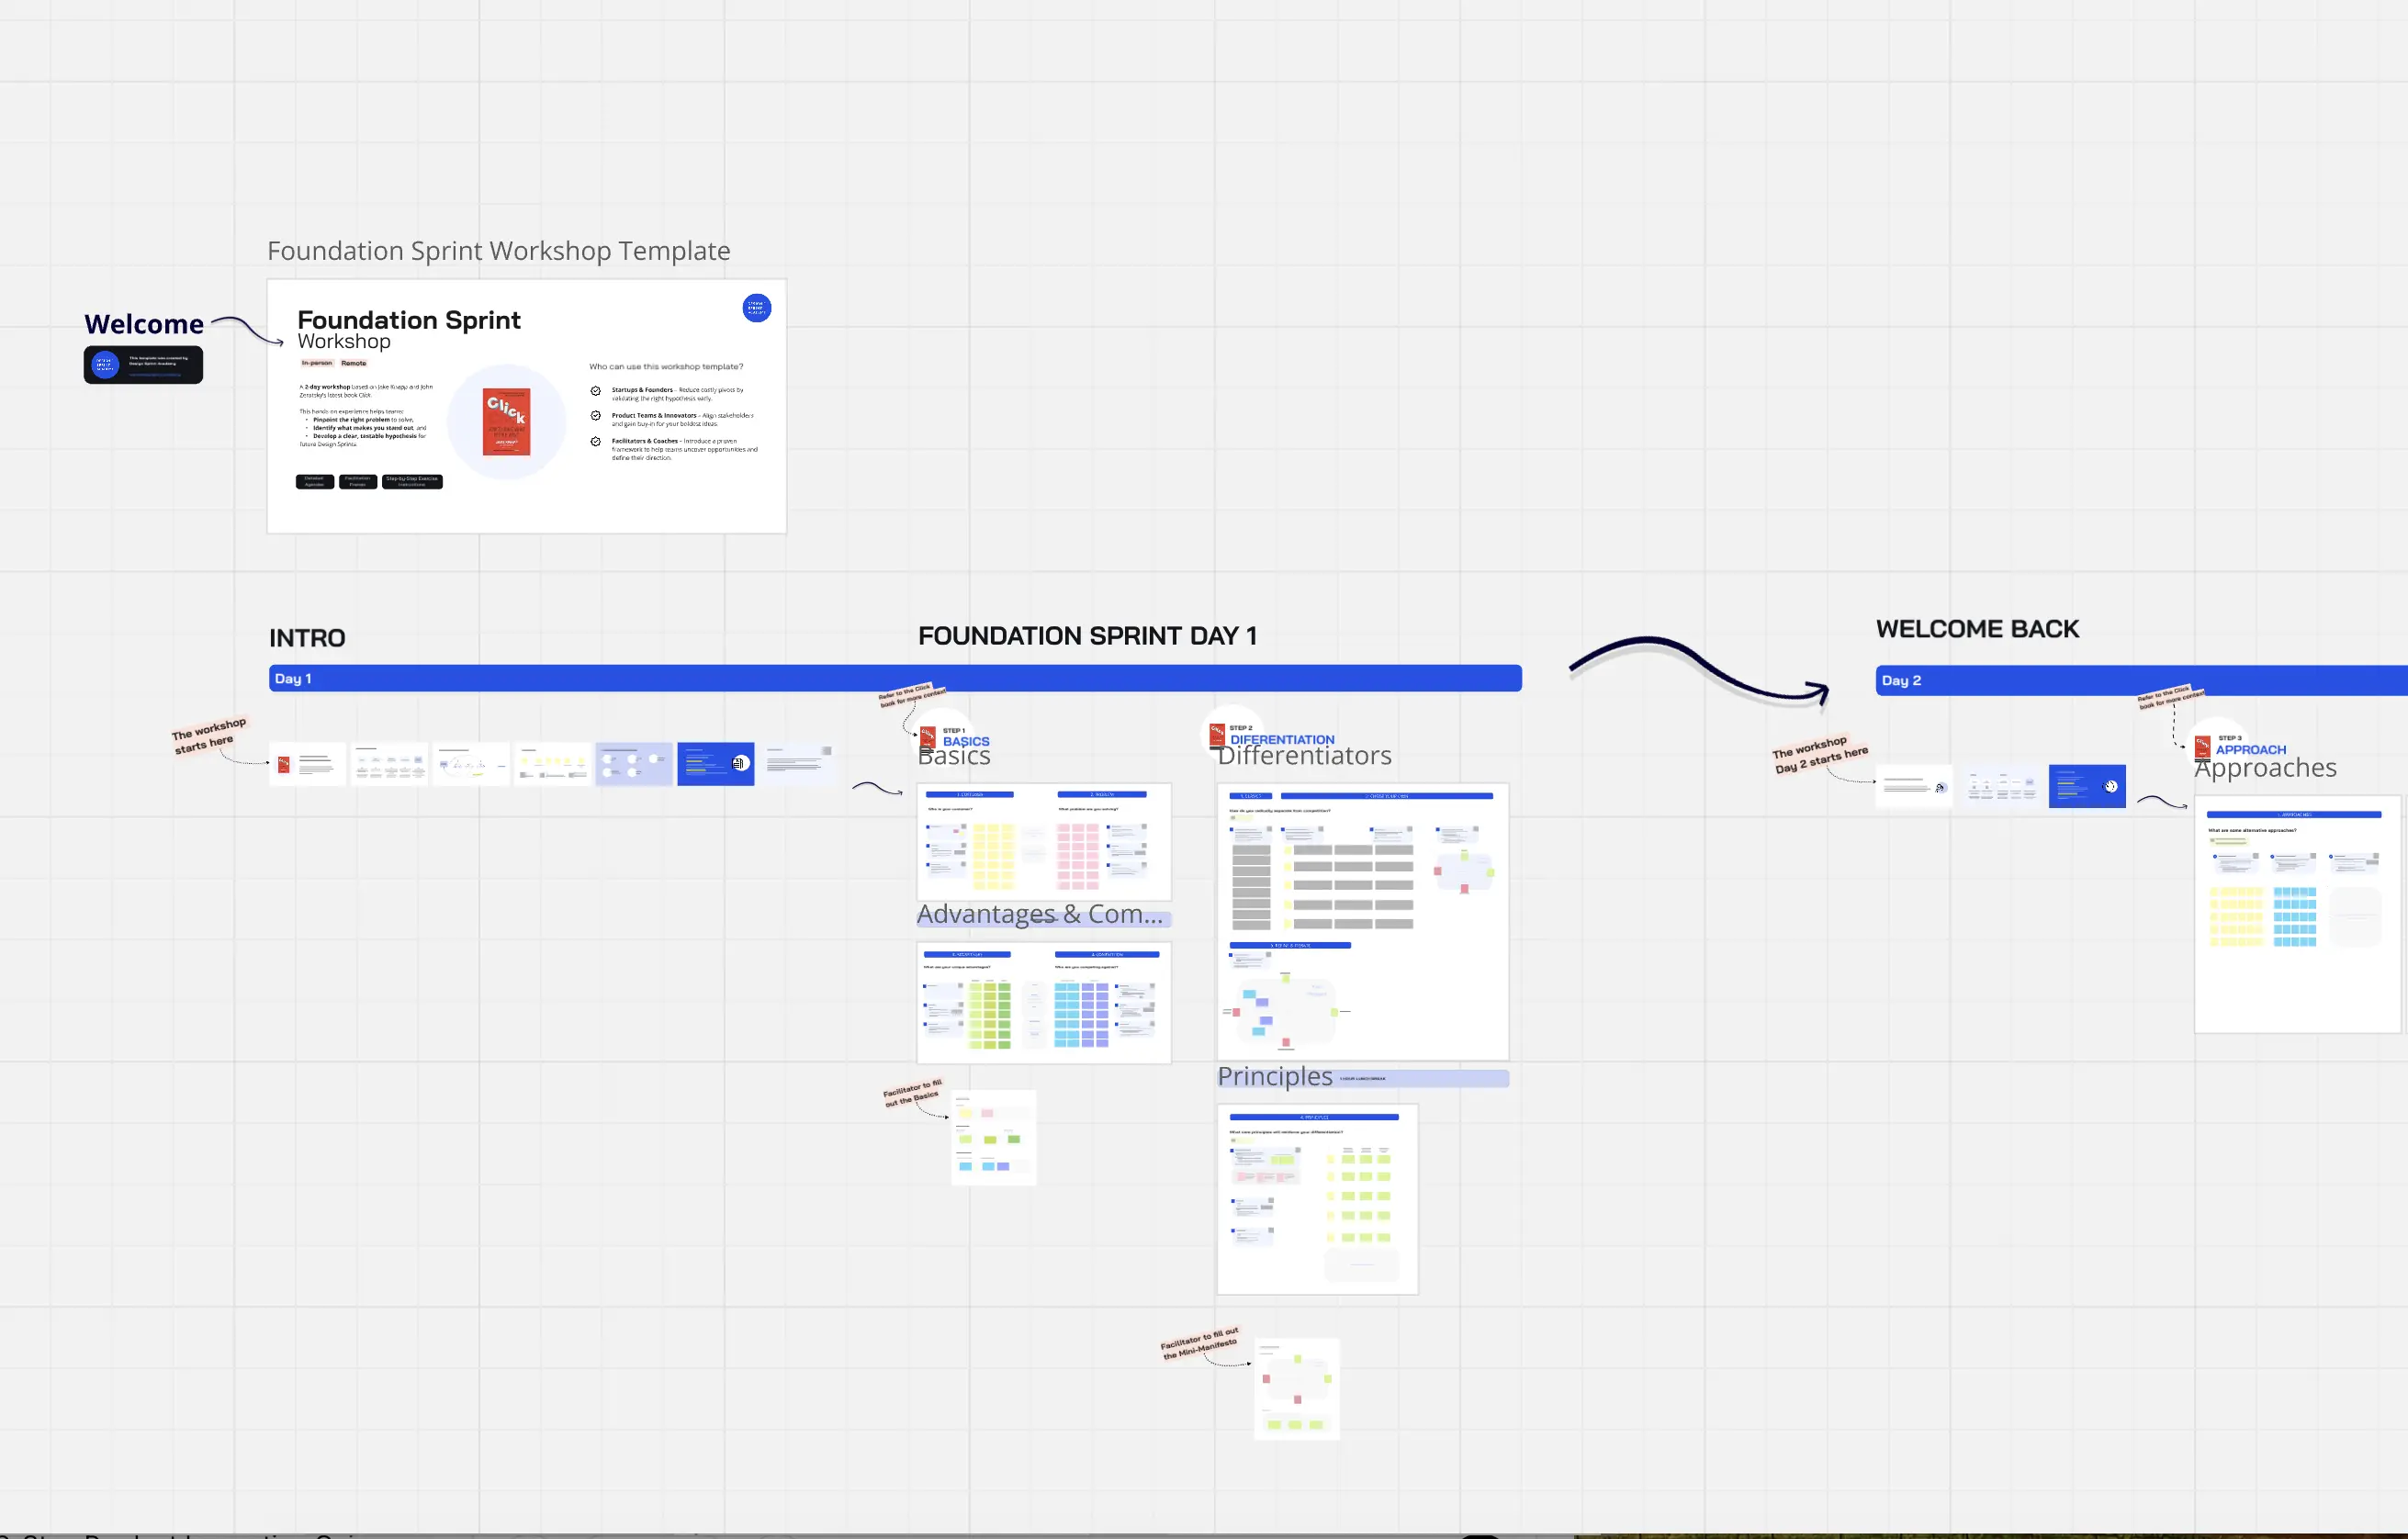
Hit the ground running on every engagement. Stop rebuilding your process each time. These templates provide battle-tested frameworks for common consulting scenarios—from initial discovery to final recommendations. Customize quickly and get straight to strategic thinking.
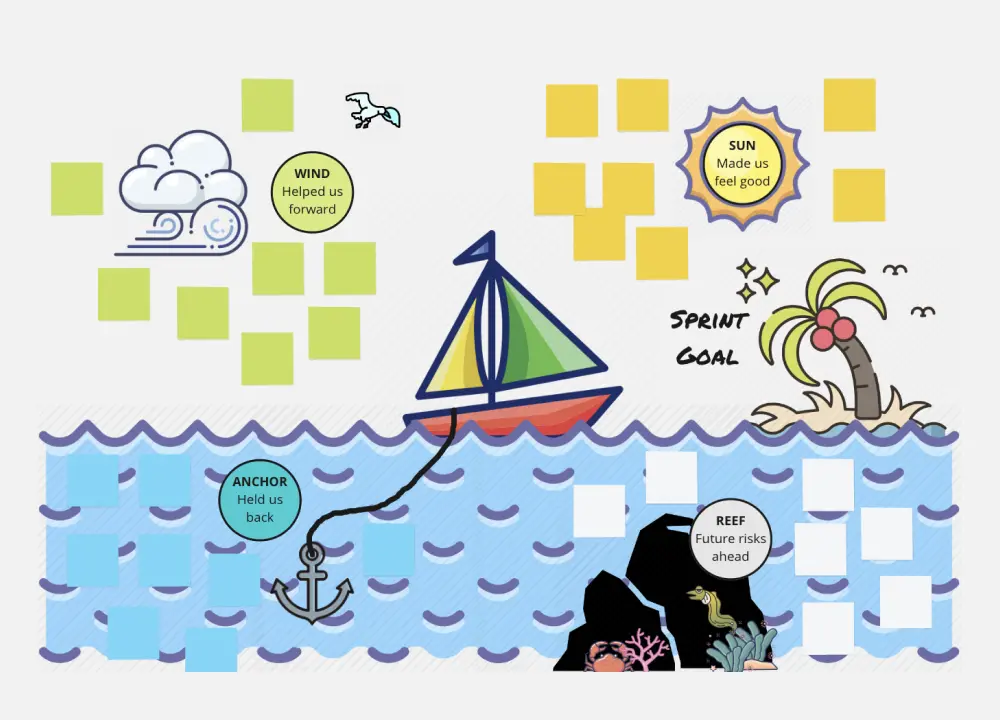
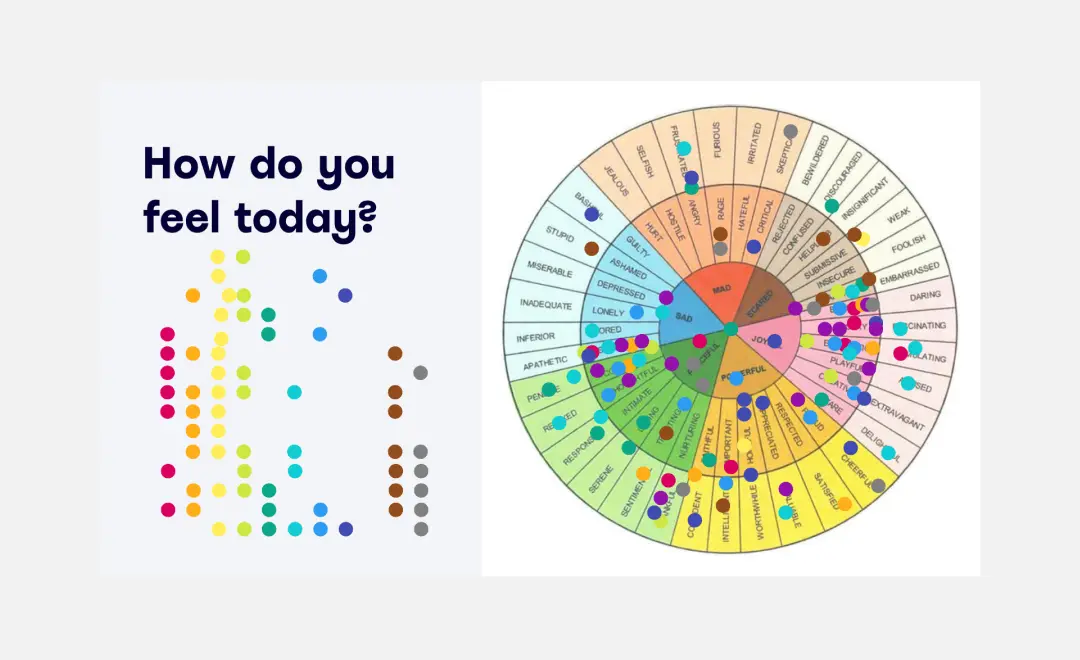
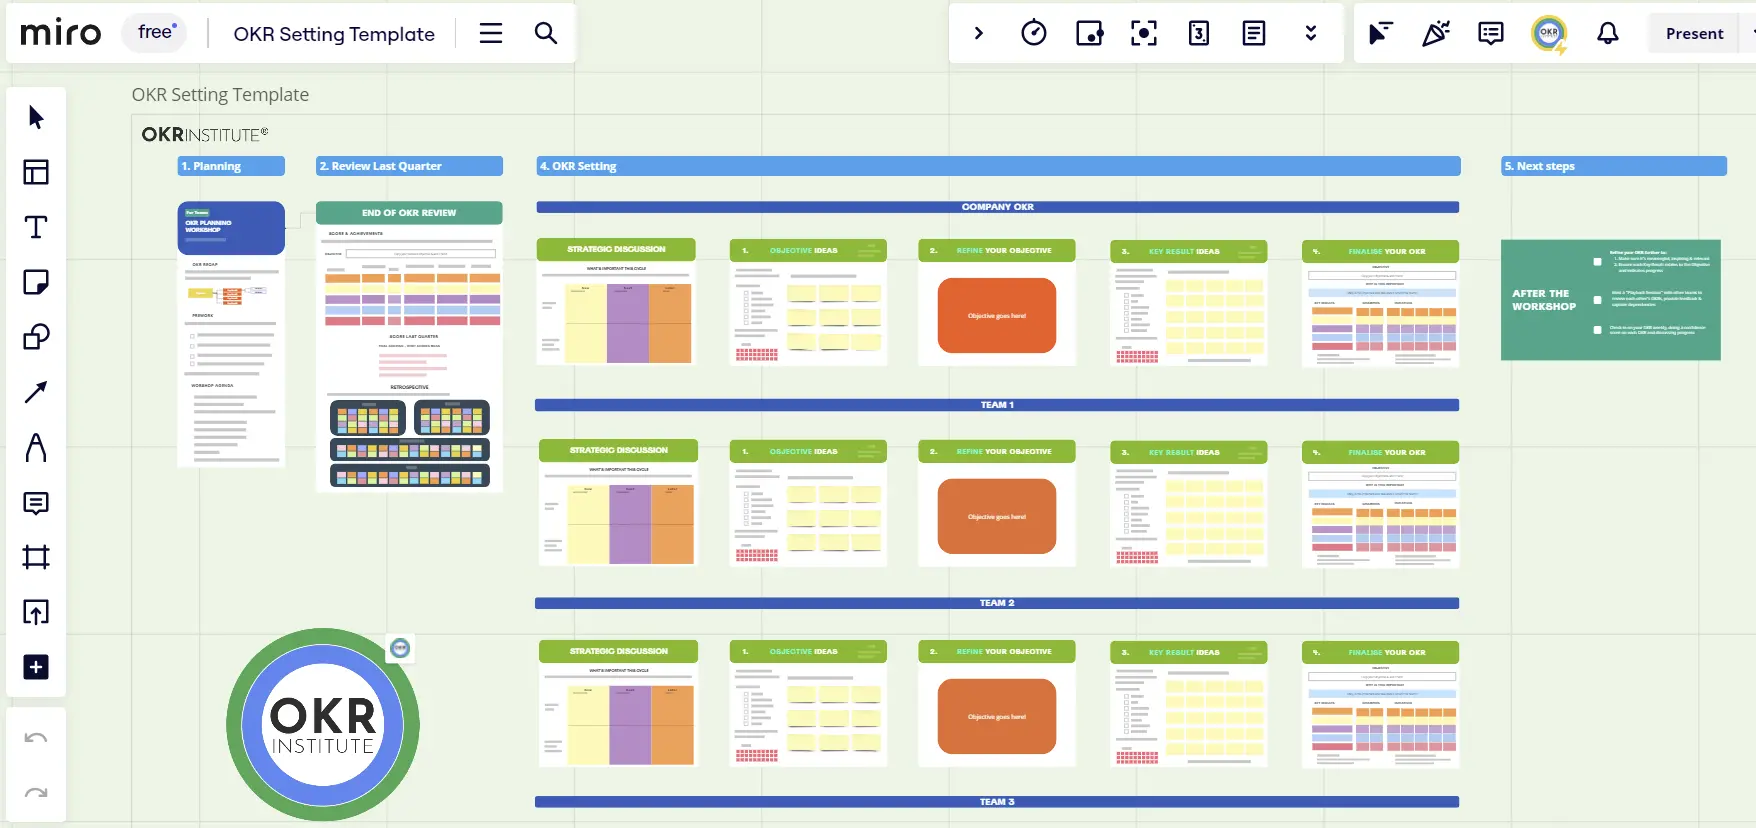
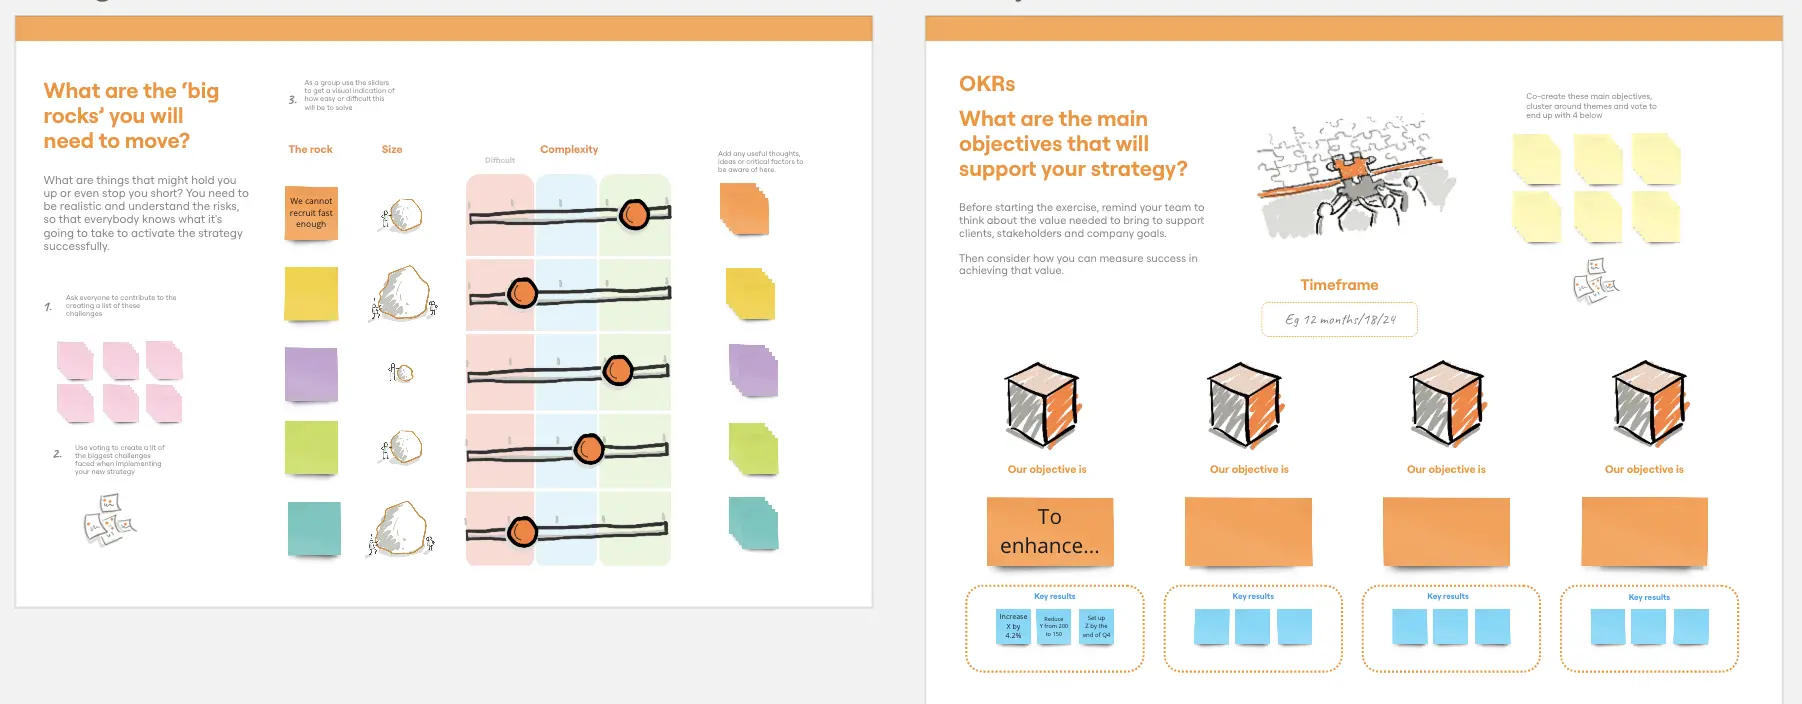
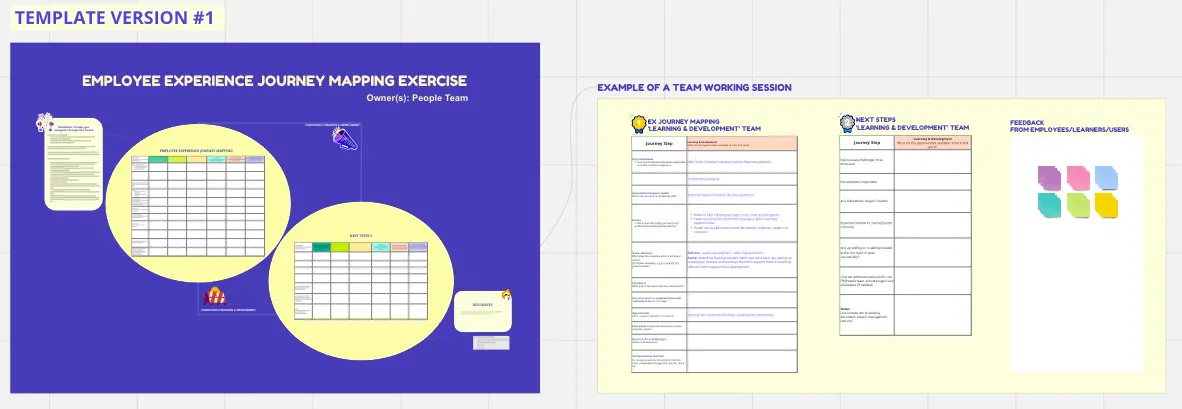
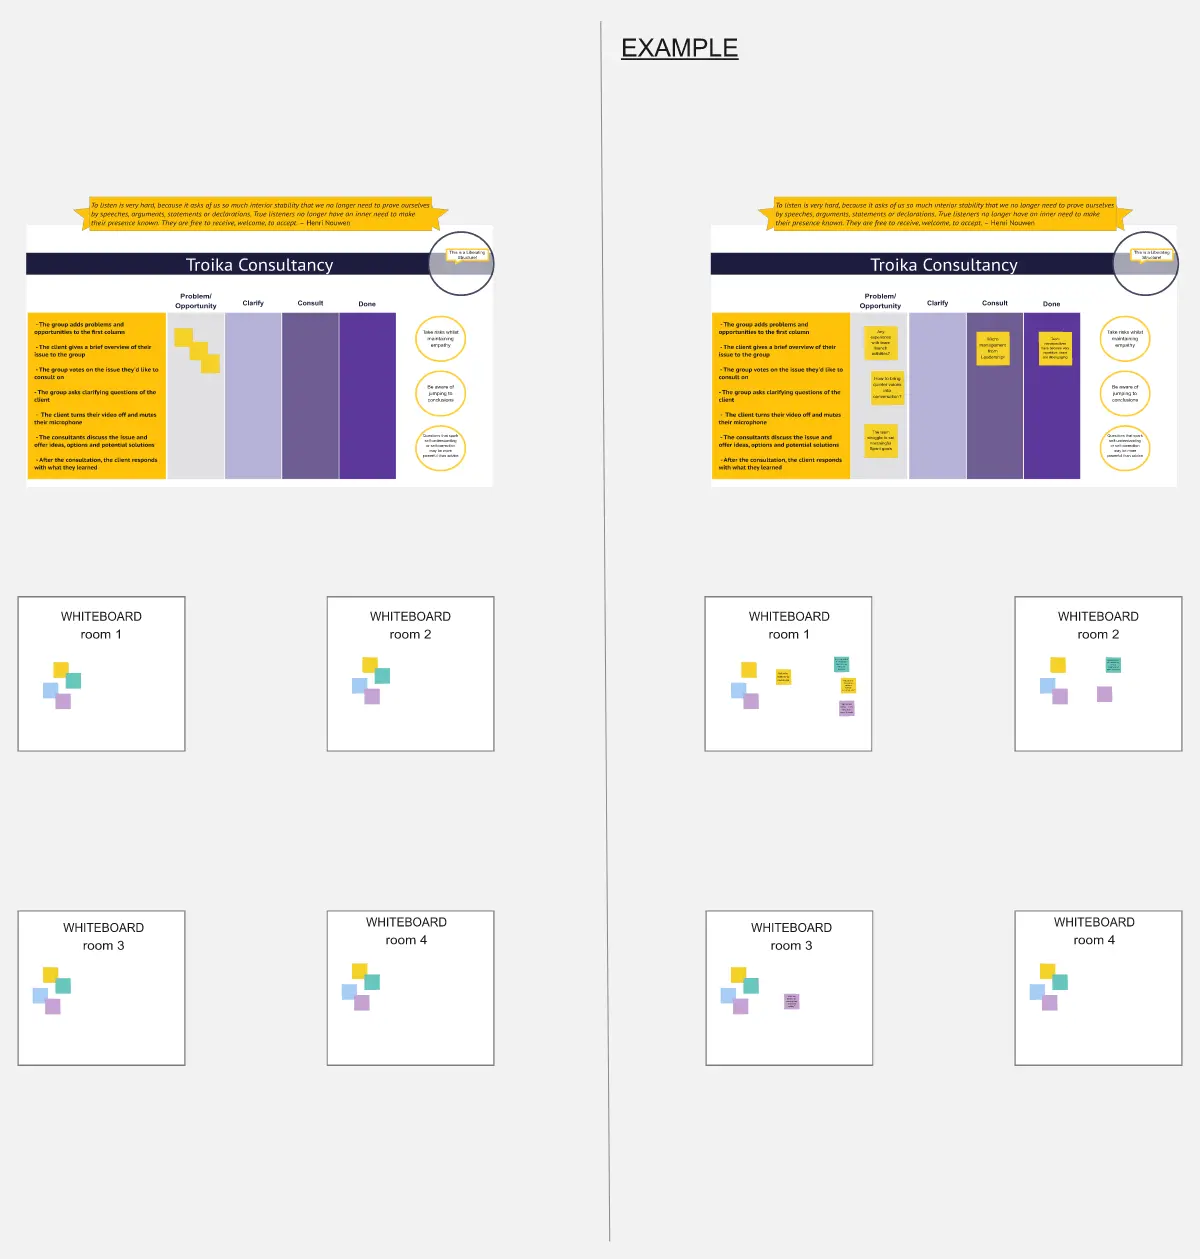
Facilitate workshops that actually produce insights. Interactive templates for brainstorming, prioritization, and strategic planning keep sessions focused and productive. Participants contribute ideas visually, vote on priorities, and leave with clear next steps—all captured in one organized workspace.
Collaborate in real-time or async. Whether you're in the room together or working across time zones, clients can review your frameworks, add feedback, and watch recommendations develop—creating buy-in throughout the process instead of just at the final presentation.
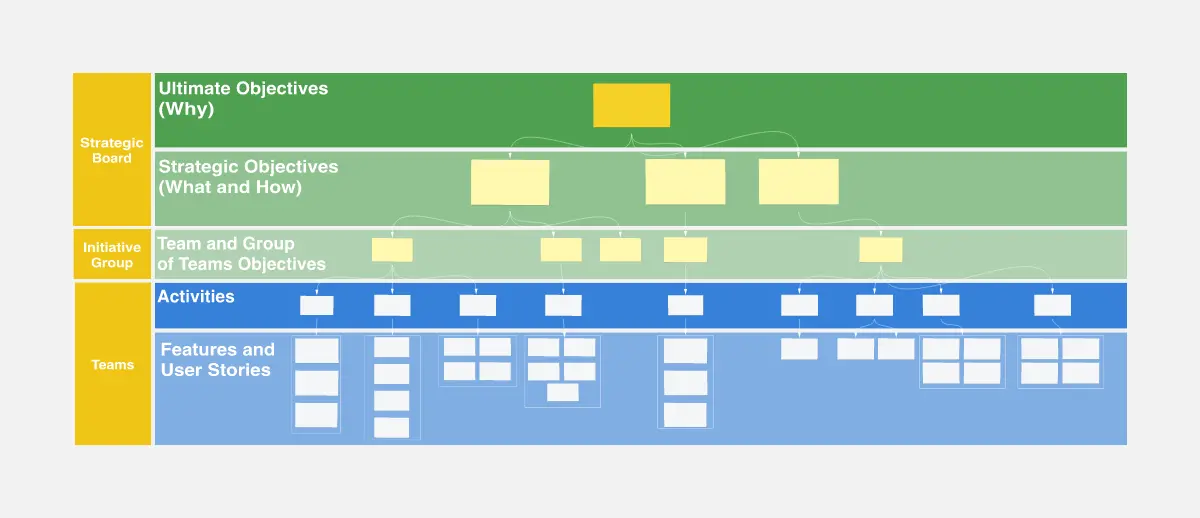
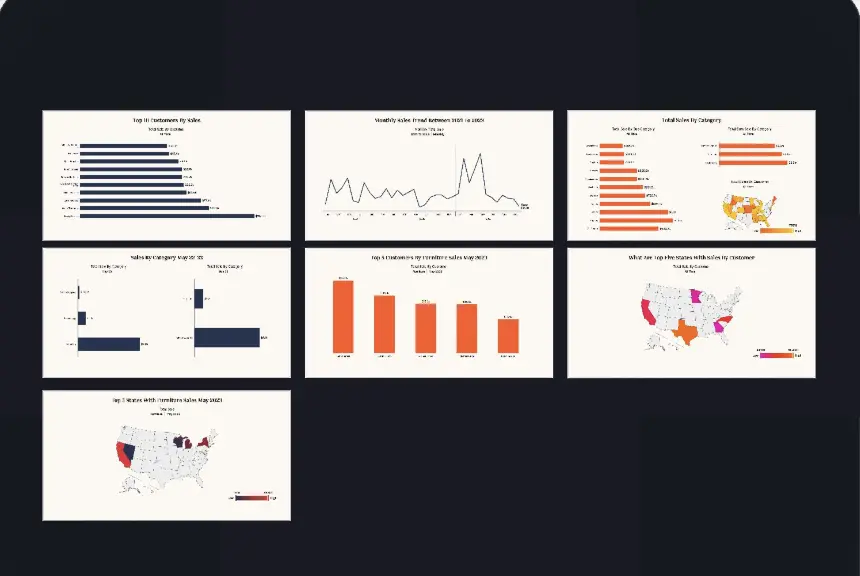
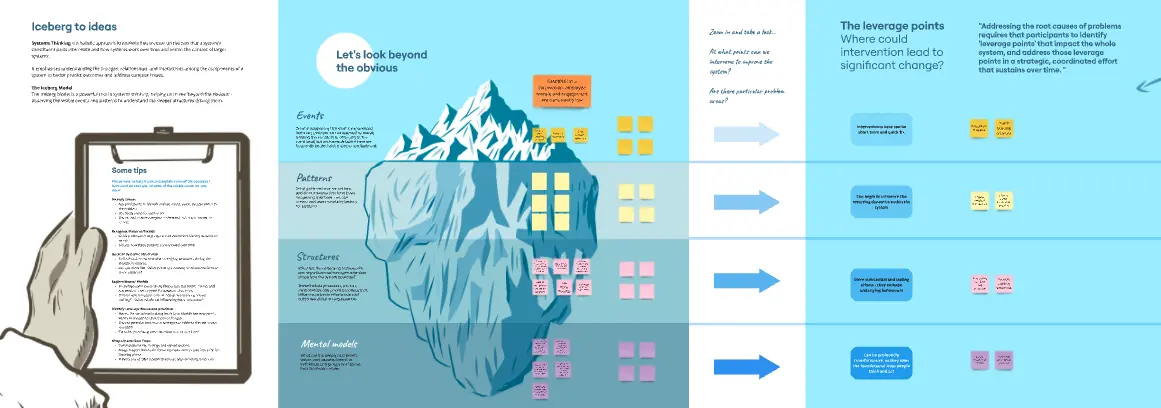
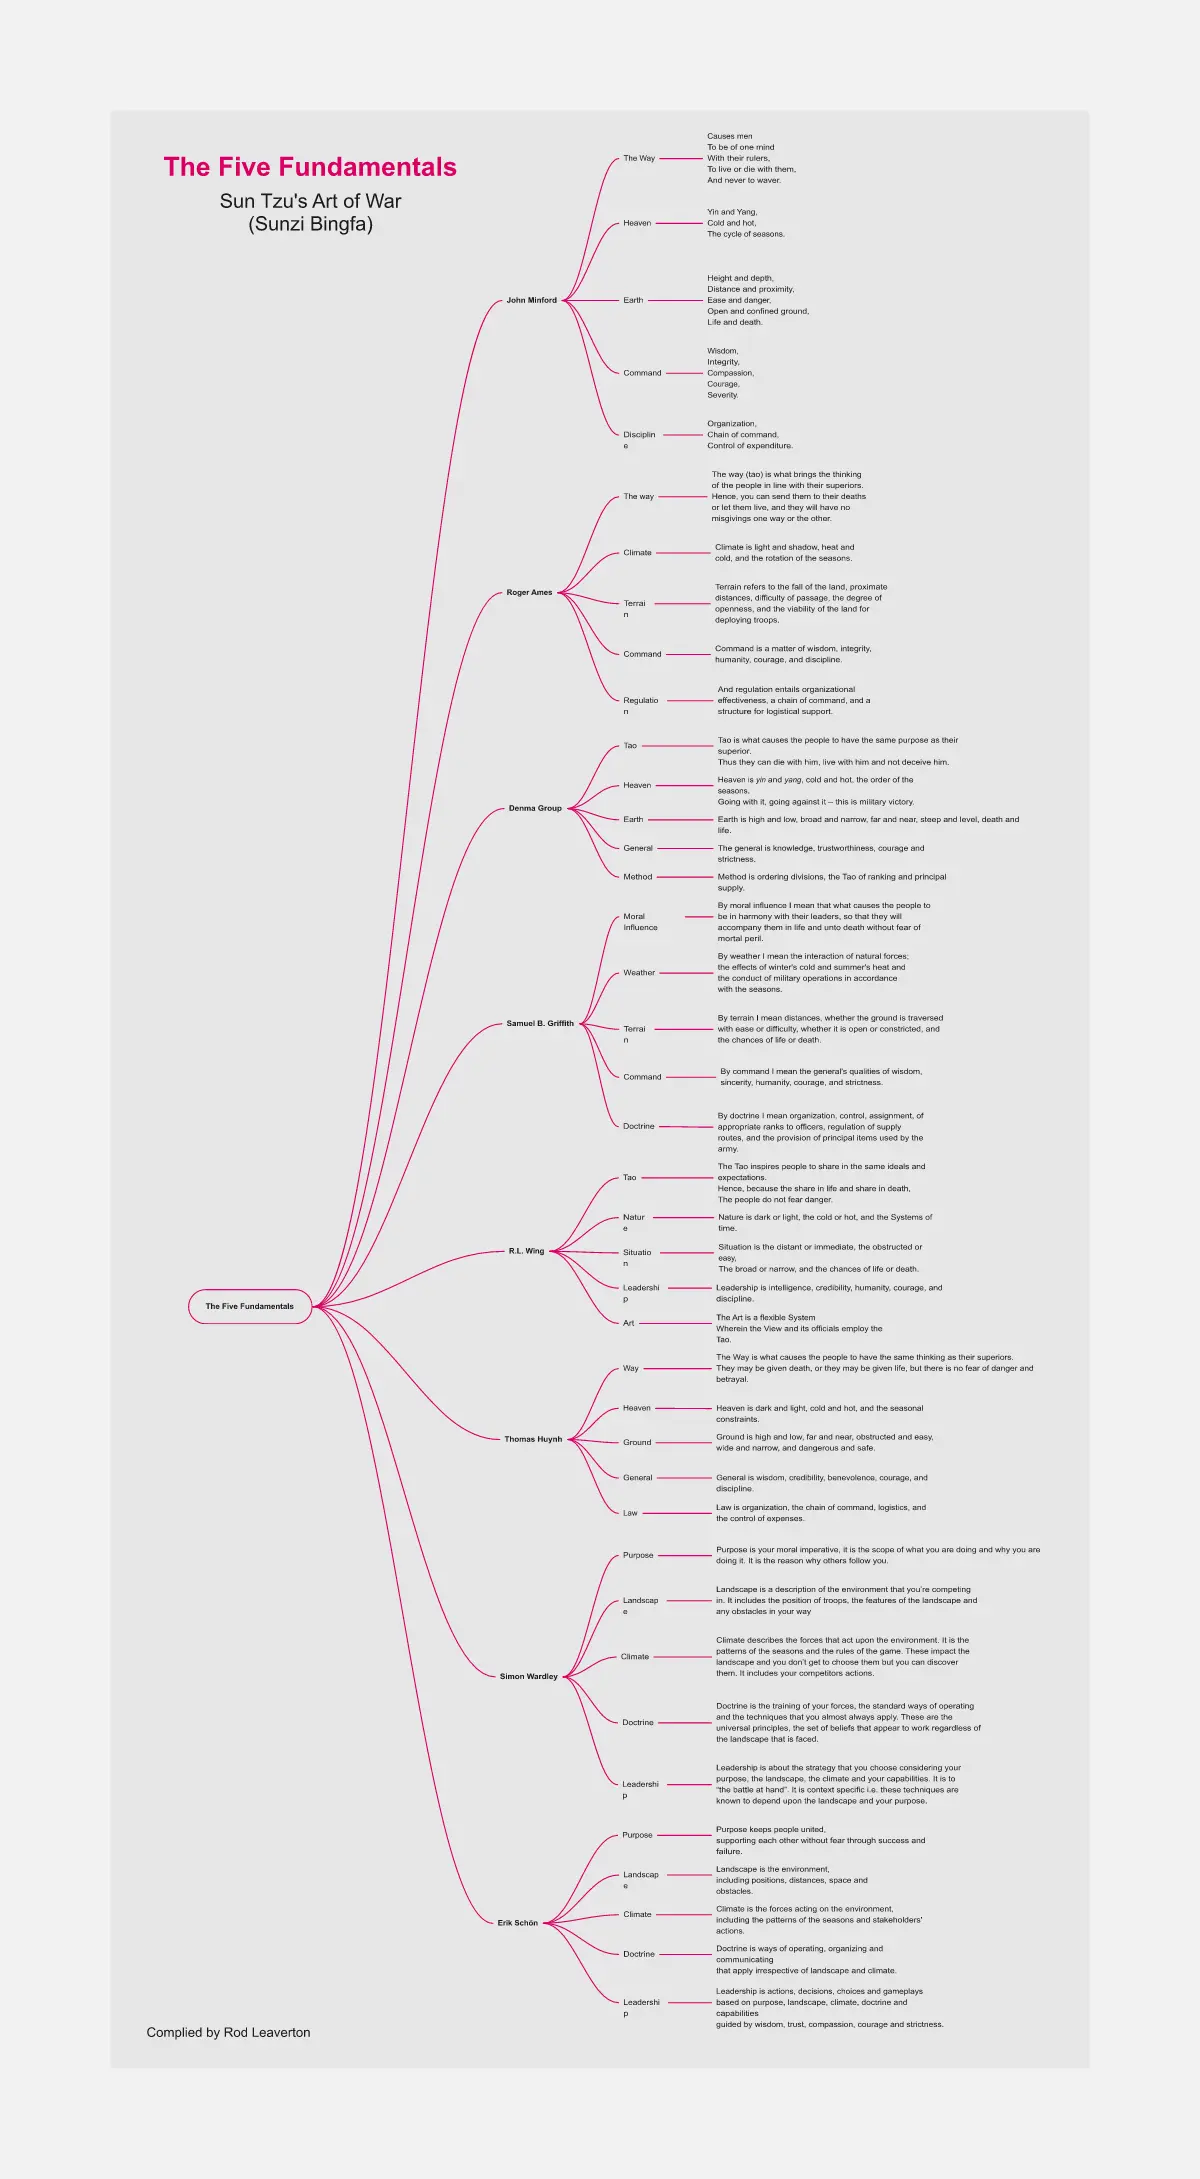
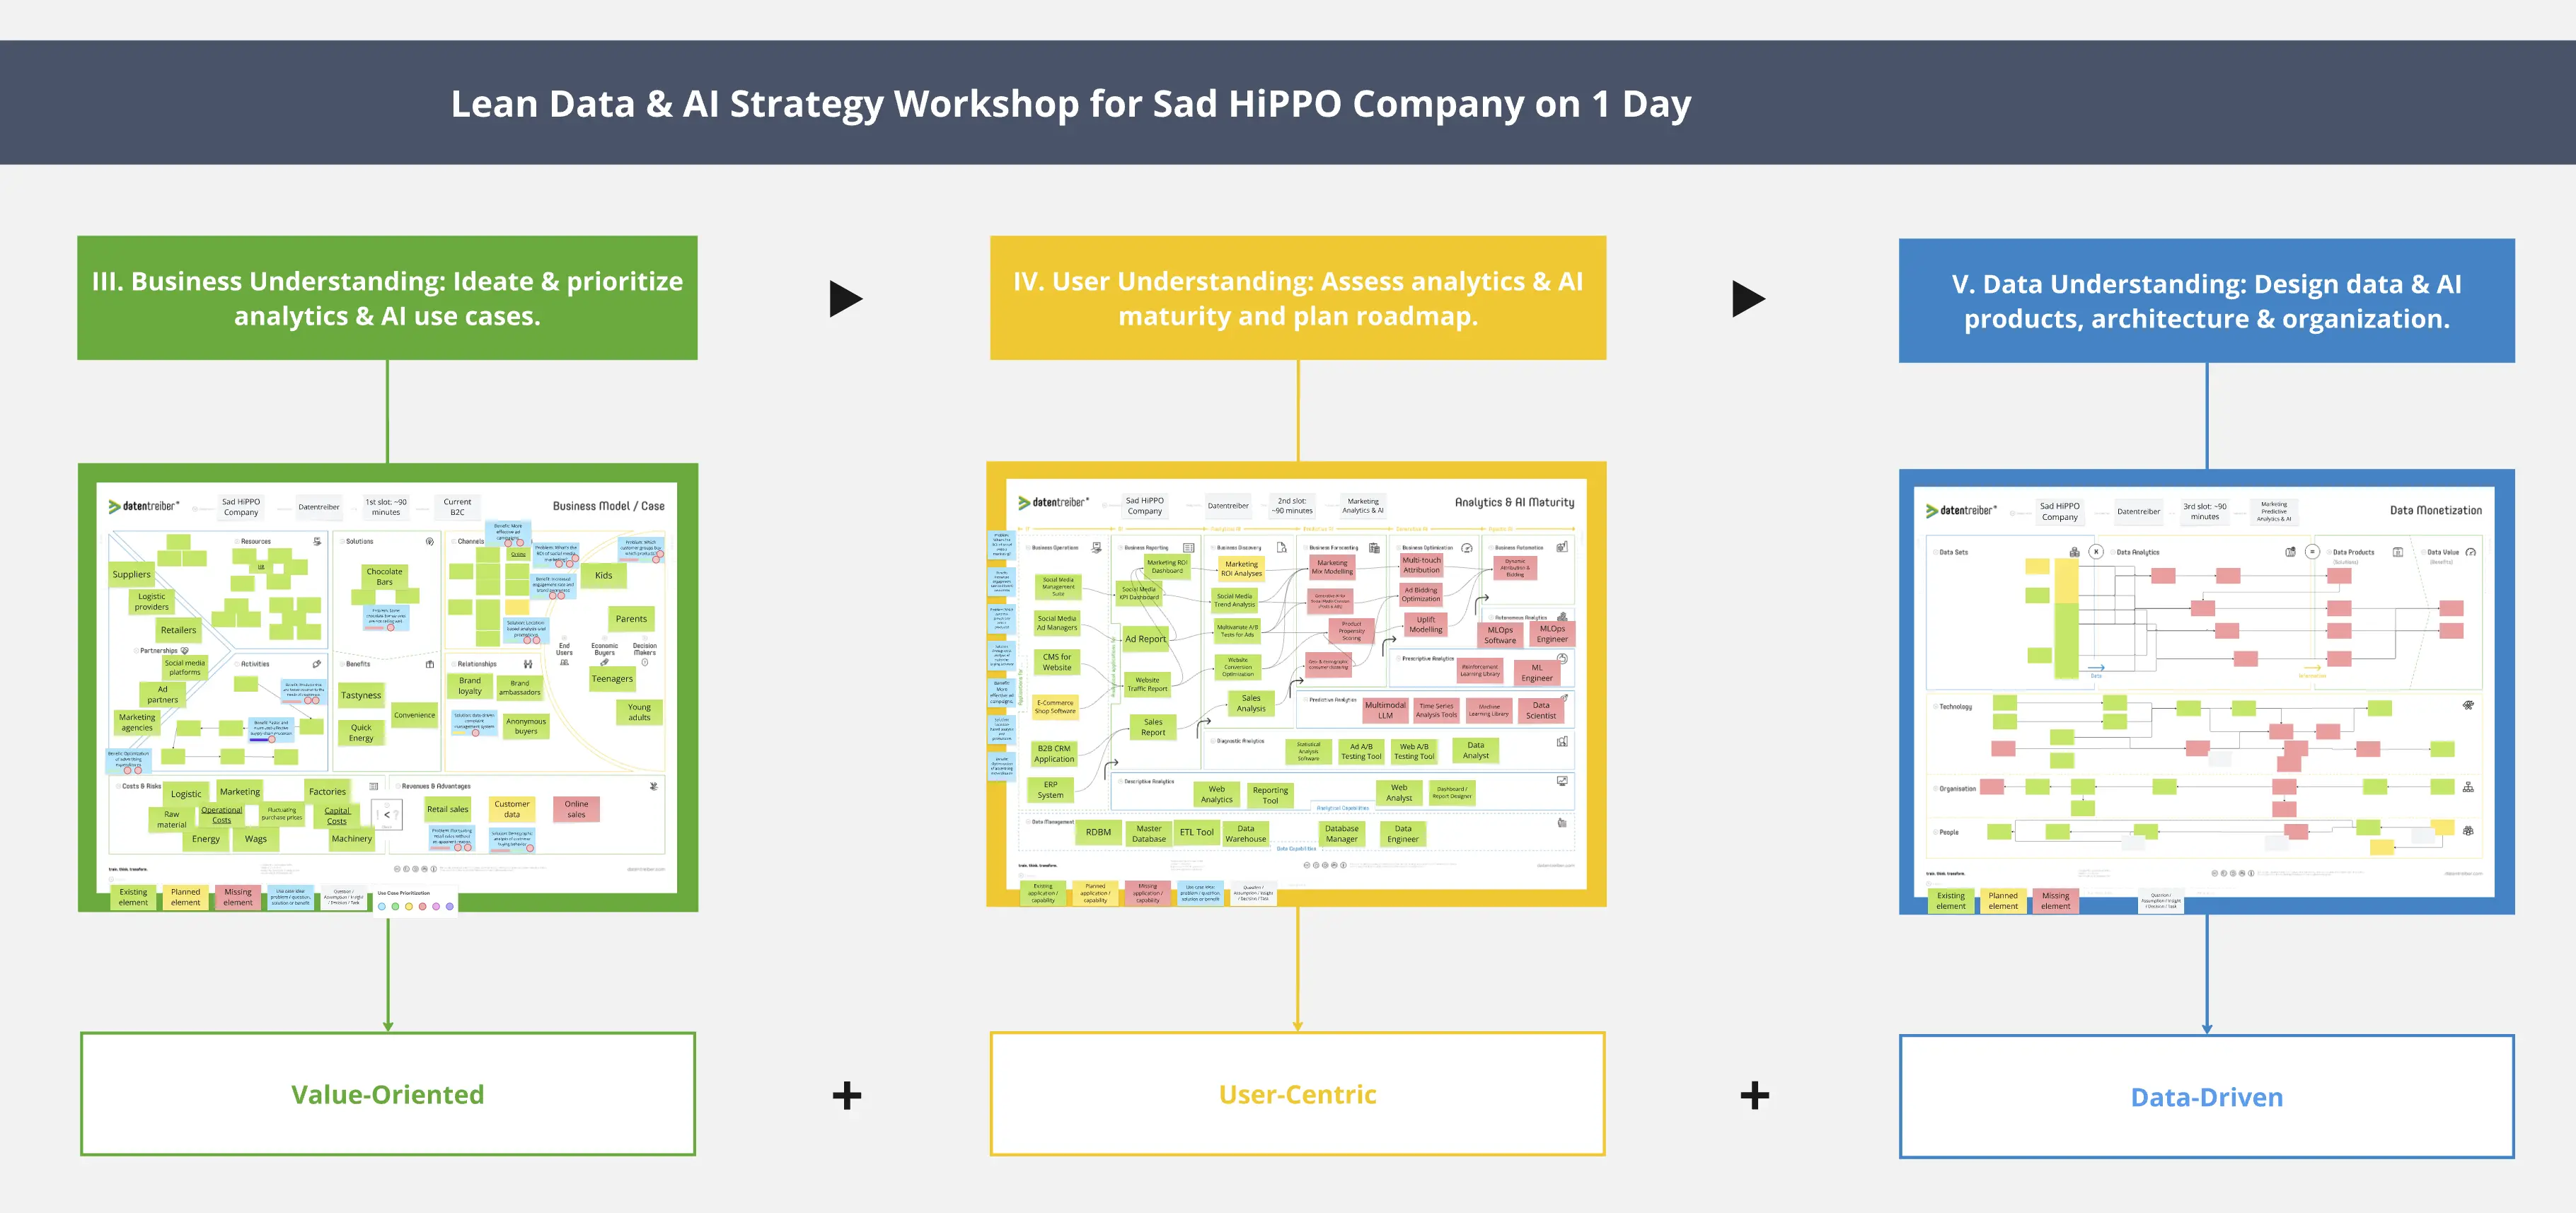
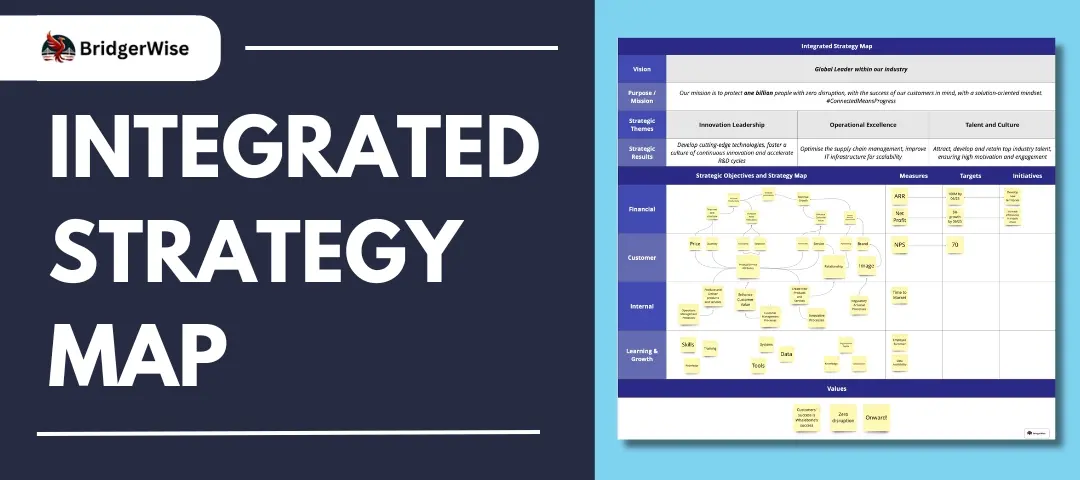
Translate complexity into clarity. Transform research and analysis into visual frameworks that executives grasp immediately. Map current-state processes, visualize future-state designs, and show exactly how to get from here to there.
Build your consulting IP library. When a workshop format works brilliantly, save it as a custom template. Build your own library of proven approaches that you can deploy across clients, establishing your signature methodology while saving hours on every engagement.
How to use the consultant templates
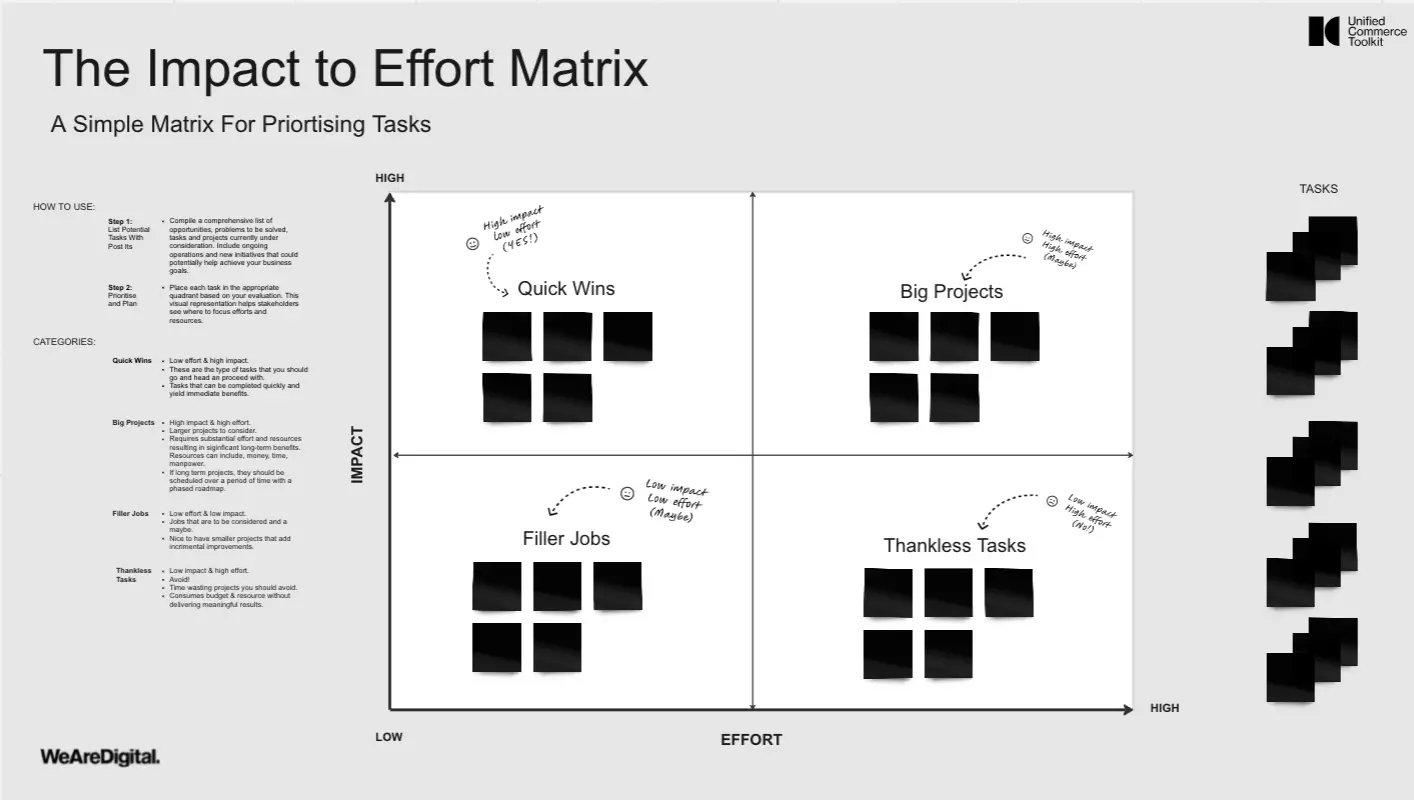
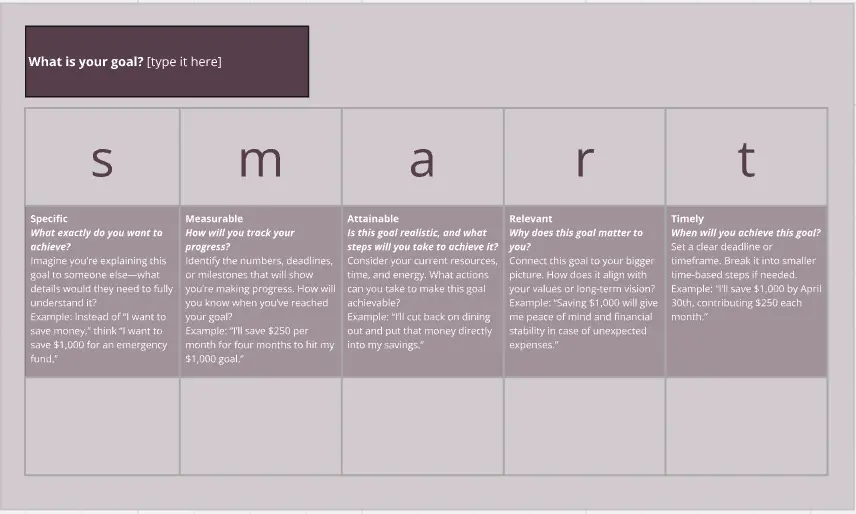
Step 1: Select your engagement framework. Choose a template that matches your current project phase—stakeholder mapping for discovery, business model canvas for strategy development, or SWOT analysis for assessment.
Step 2: Customize for your client context. Adapt the template to reflect your client's industry, challenges, and vocabulary. The template provides the structure—you bring the tailored intelligence.
Step 3: Collaborate during discovery. Share your board with stakeholders. Use it during workshops to capture insights in real-time, or send it for async input when schedules don't align.
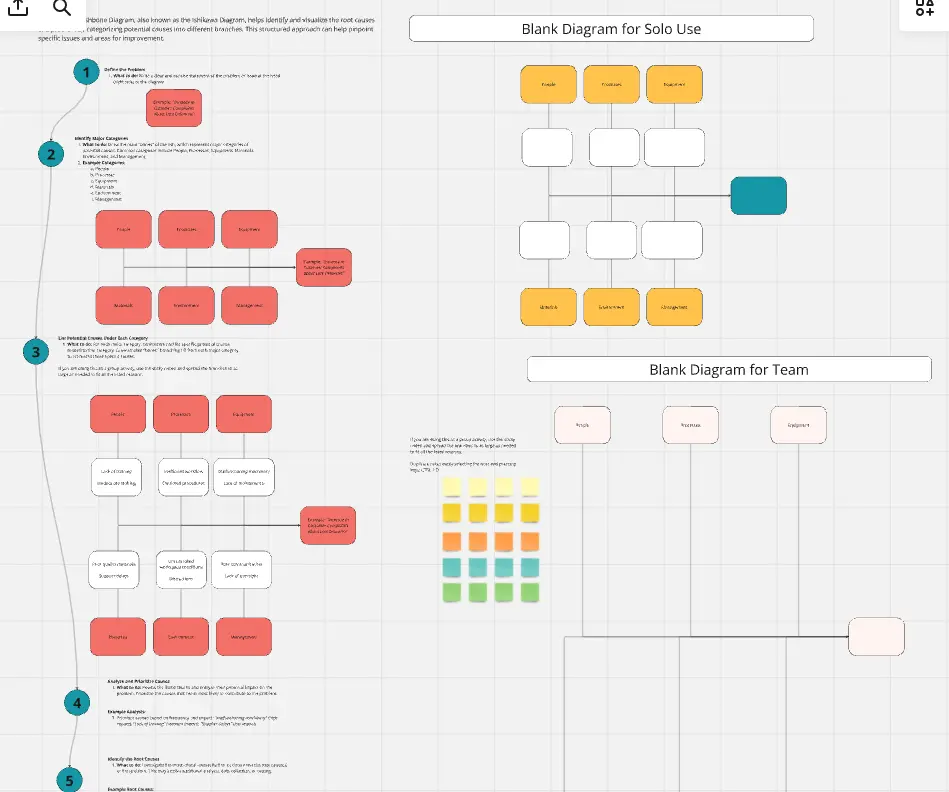
Step 4: Build recommendations visually. Develop your strategic recommendations right on the canvas. Map dependencies, show cause-and-effect relationships, and create visual roadmaps that make your solutions immediately understandable.
Step 5: Present and iterate. Walk clients through your analysis using presentation mode. When questions arise, adapt your frameworks on the spot and capture decisions directly on the board.
FAQ about consultant templates
How does Miro AI help with consulting work?
Miro AI accelerates your process by generating initial framework content, summarizing stakeholder inputs, and suggesting structure for your analyses. Use AI to populate templates with draft content, synthesize discovery notes into key themes, and generate multiple strategic options to explore with clients.
Can I use these templates with clients who aren't familiar with Miro?
Absolutely. Miro's intuitive interface means clients can jump in and contribute without training. For clients who prefer to stay hands-off, use the templates yourself and share read-only views or export polished PDFs.
How do consultant templates differ from general business templates?
Consultant templates are designed specifically for client-facing work and engagement delivery. They emphasize frameworks that facilitate discovery, analysis, and recommendations—the core activities of consulting. They're built to be customizable quickly across different clients while maintaining professional polish.
Can I protect confidential client information in Miro?
Yes. Create separate boards for each client engagement and control exactly who has access. Many consultants create template boards they reuse, then duplicate them into client-specific workspaces with appropriate access restrictions.
Ready to stop recreating your process from scratch? Explore the consultant templates and transform how you work with clients.