Results for
ERD diagram
411 templates
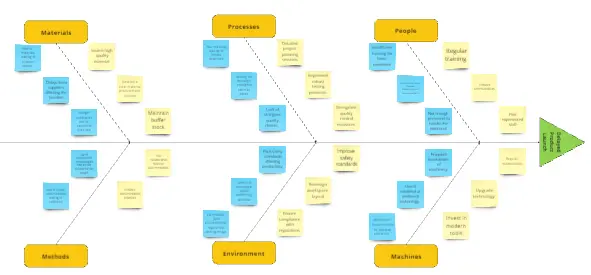
Fishbone Diagram for Software Development
6 likes45 uses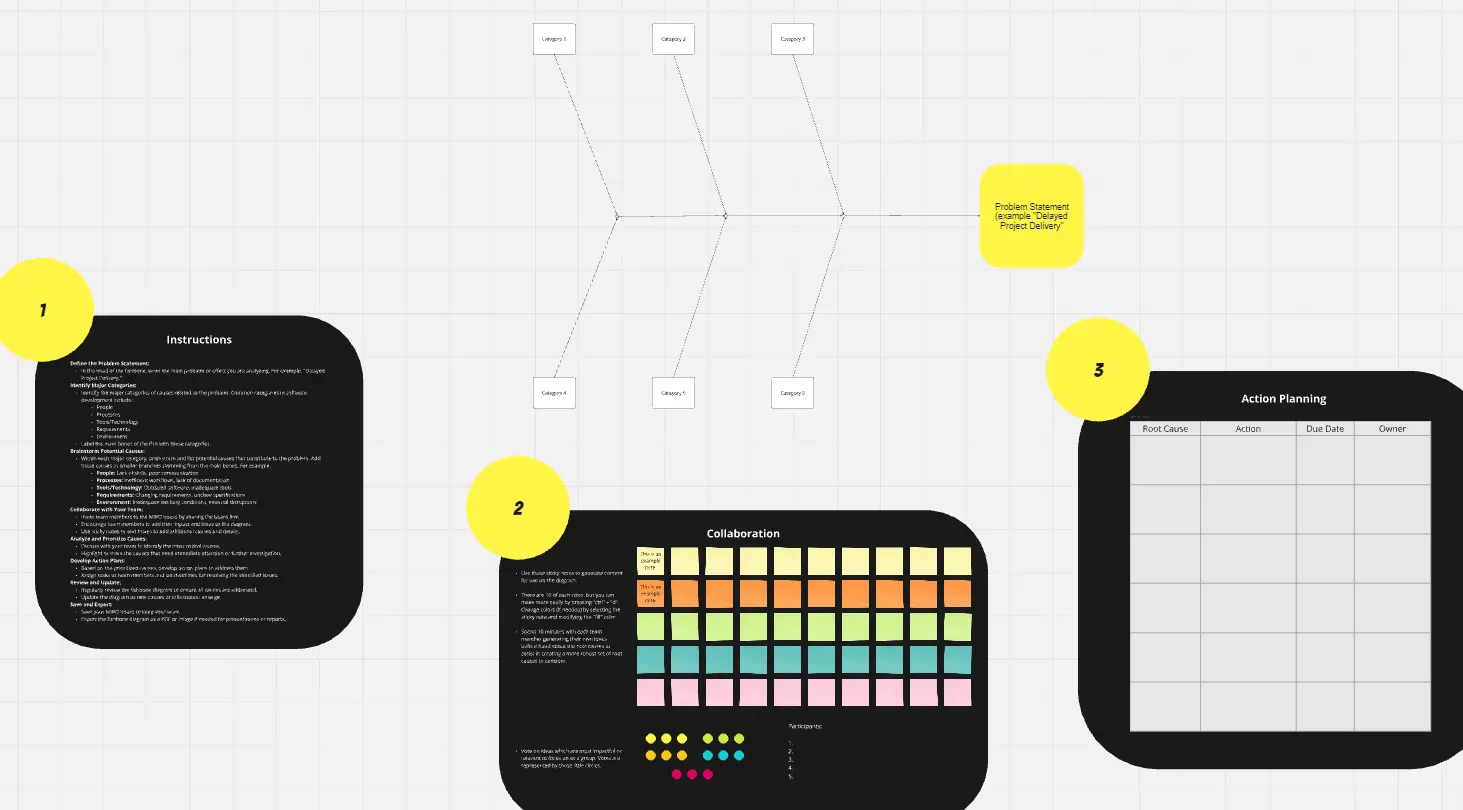
Login Sequence Diagram Template
1 likes51 uses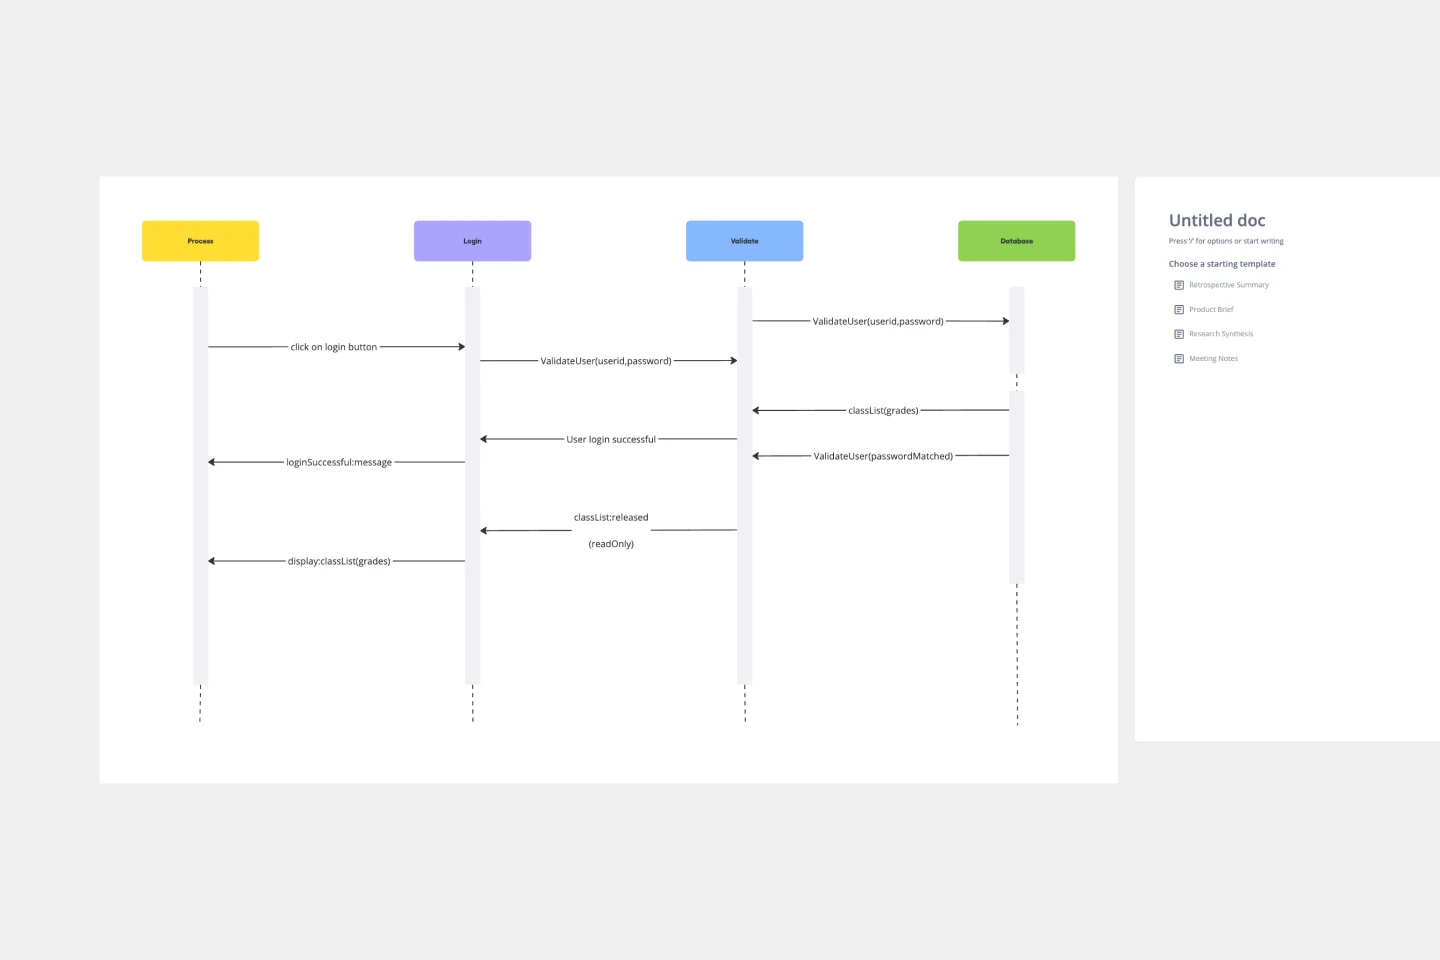
Dependency Diagrams Educational Board
110 likes1.2K uses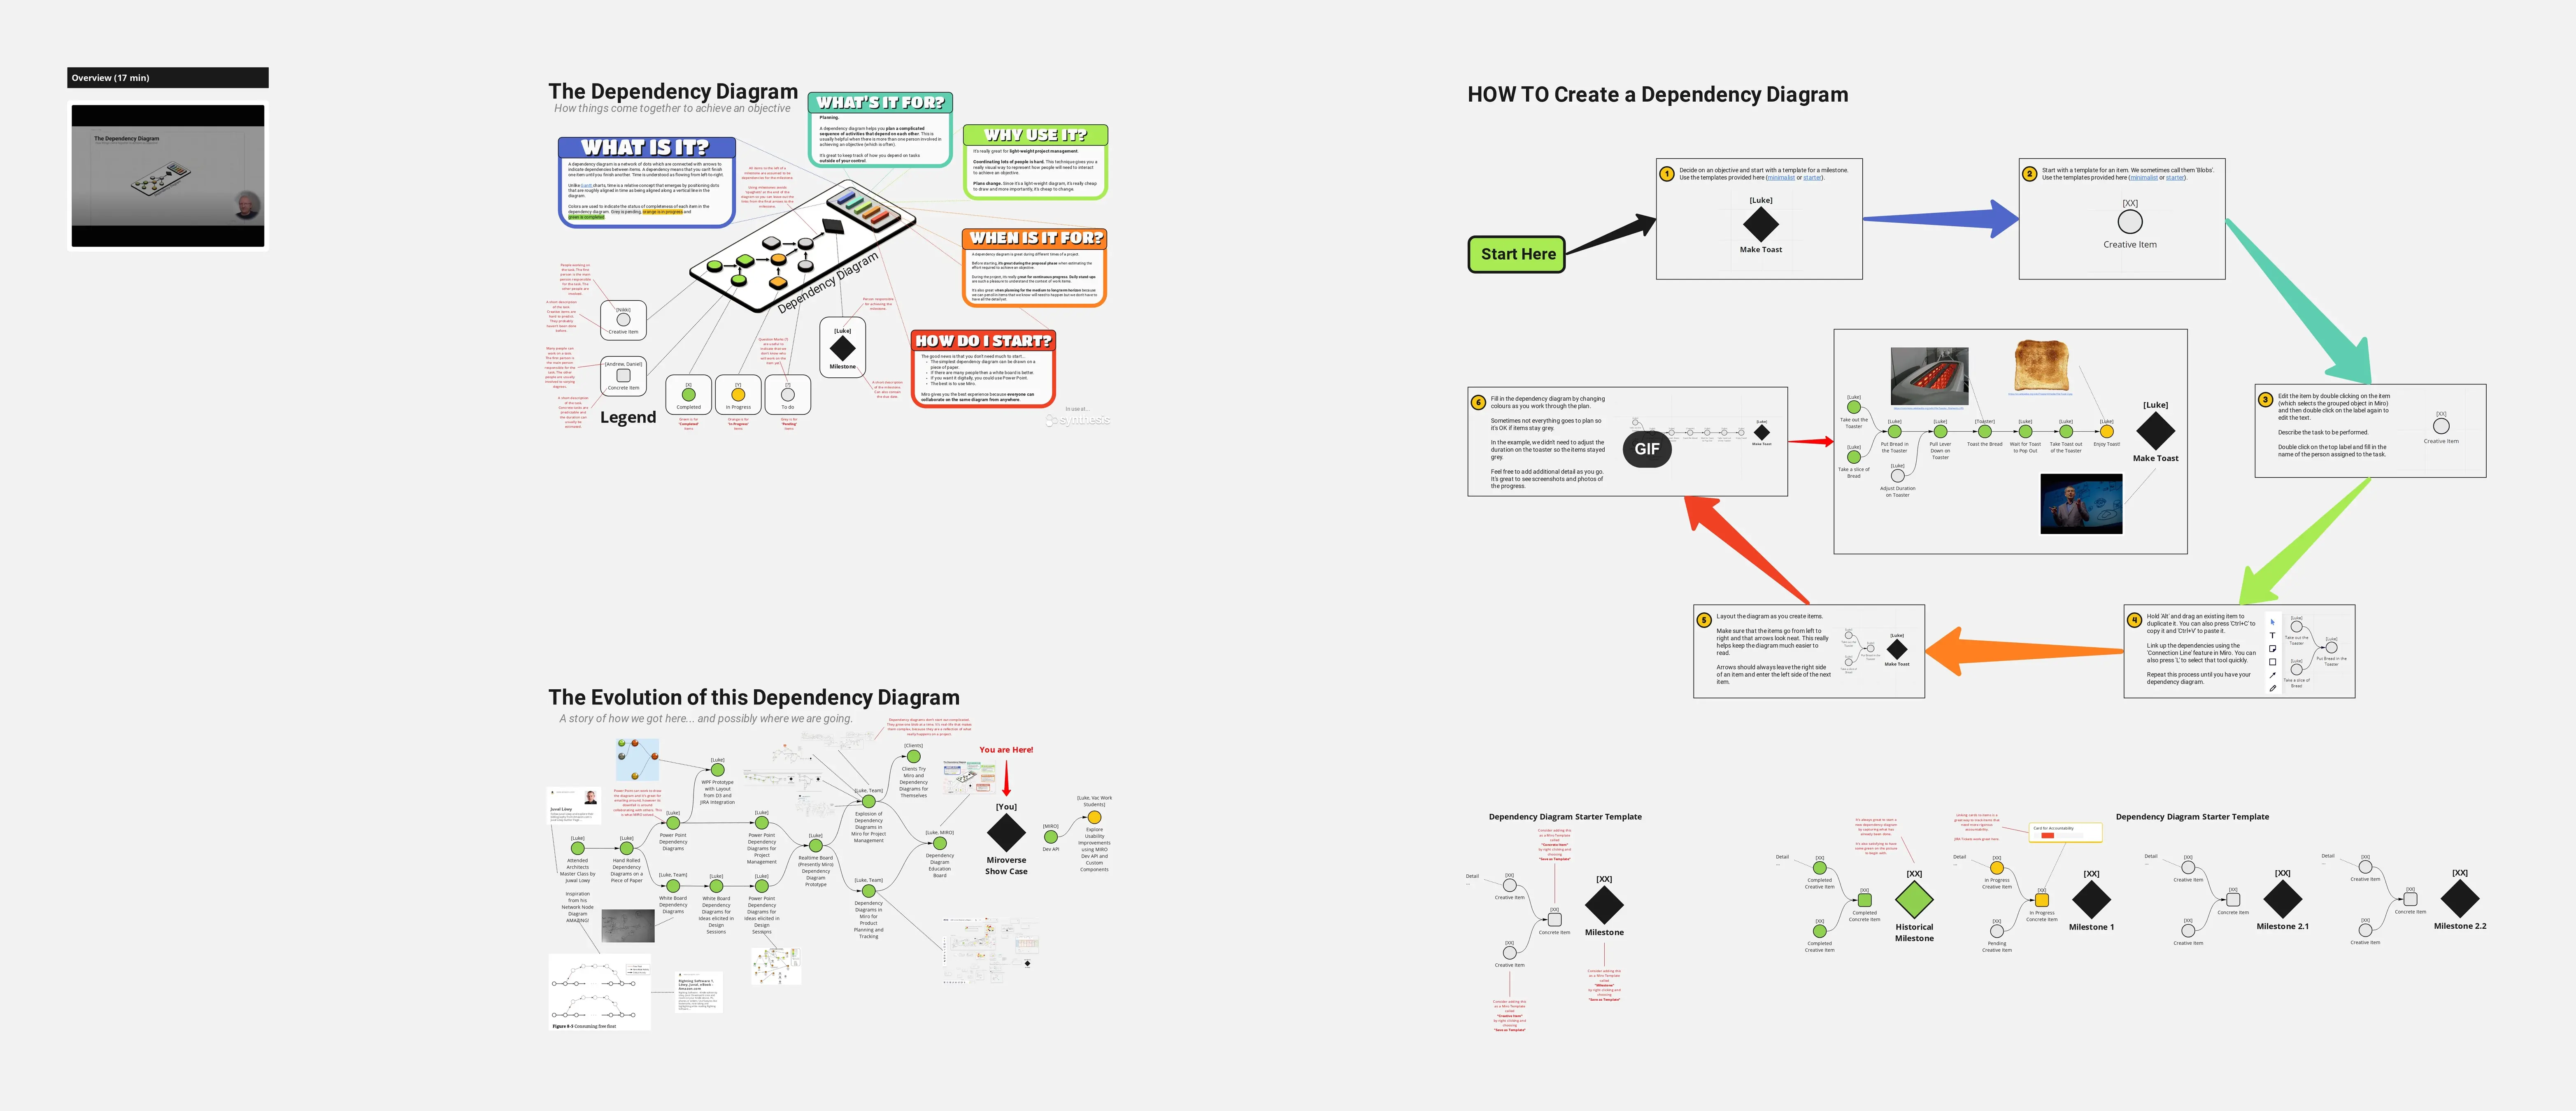
Use Case Diagram Template
1 likes930 uses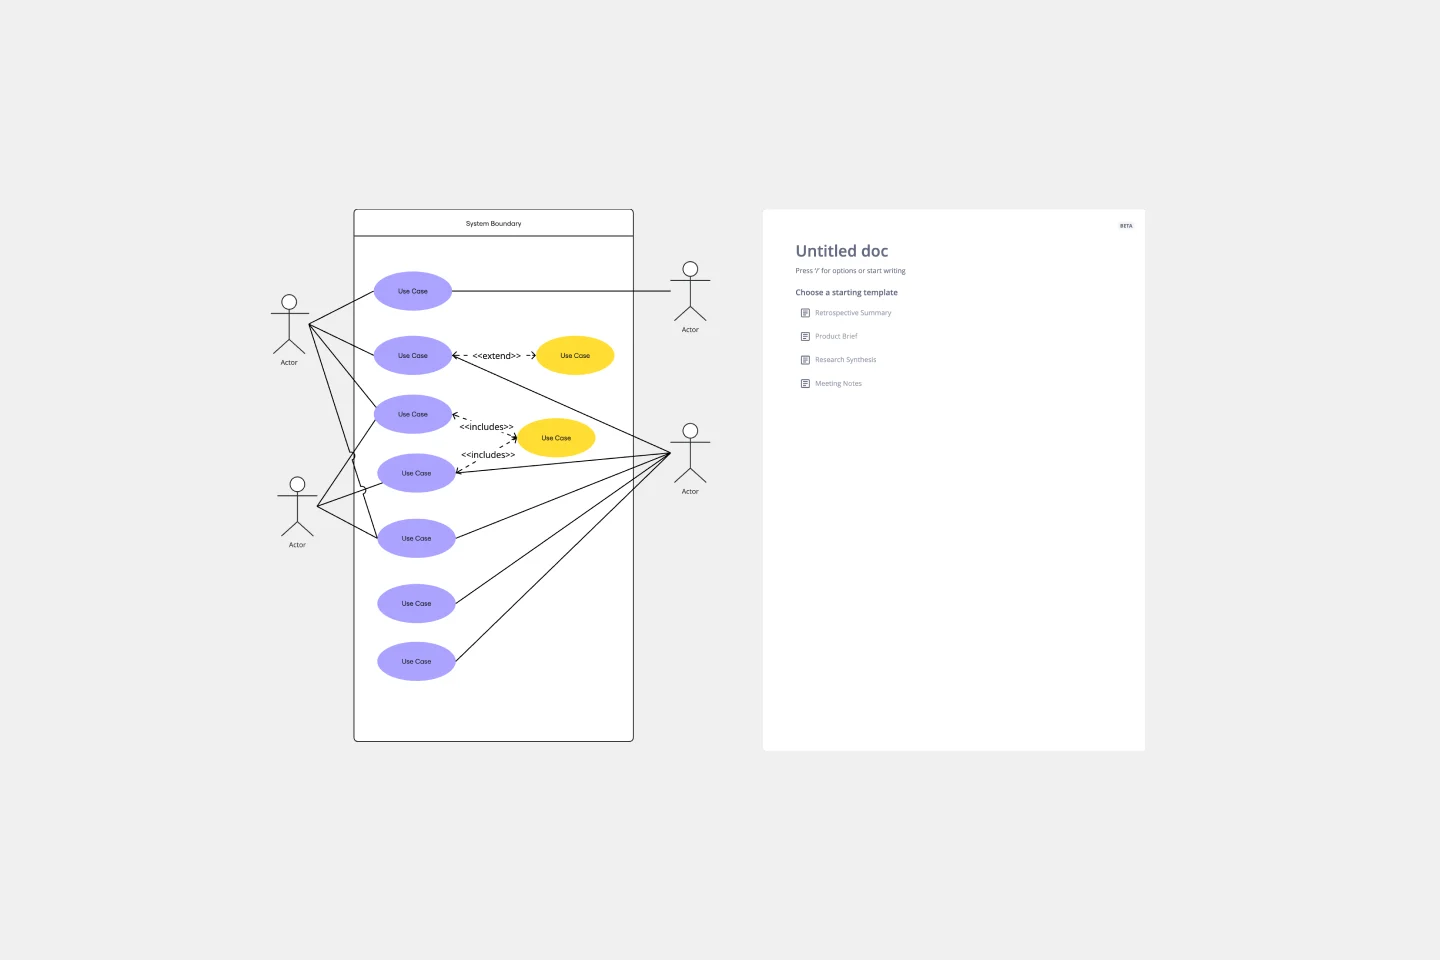
Three-Circle Venn Diagram
10 likes63 uses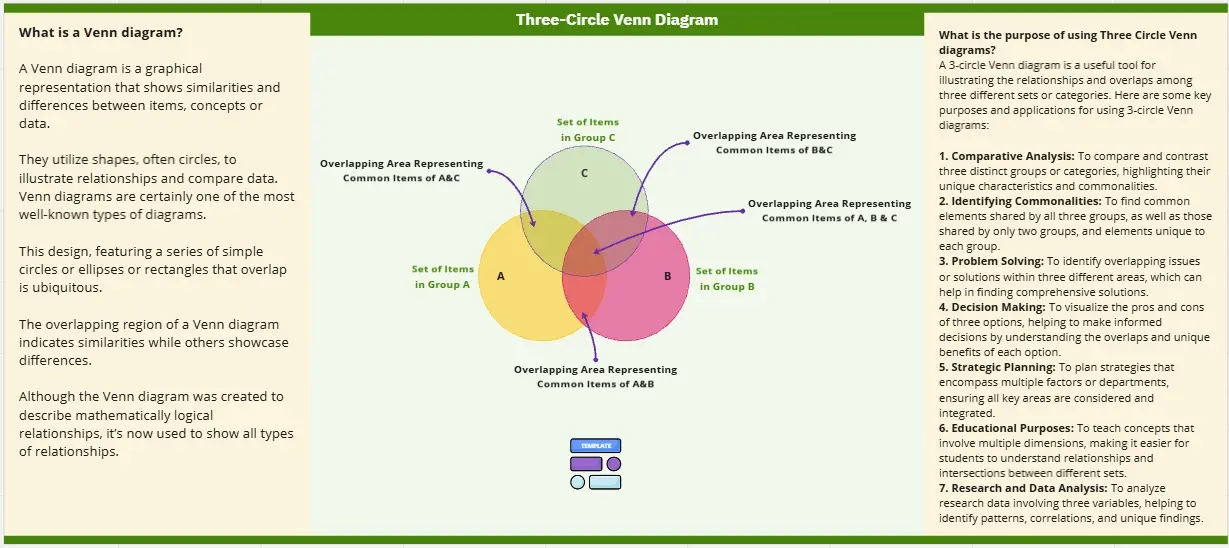
Fishbone Diagram for Marketing
1 likes13 uses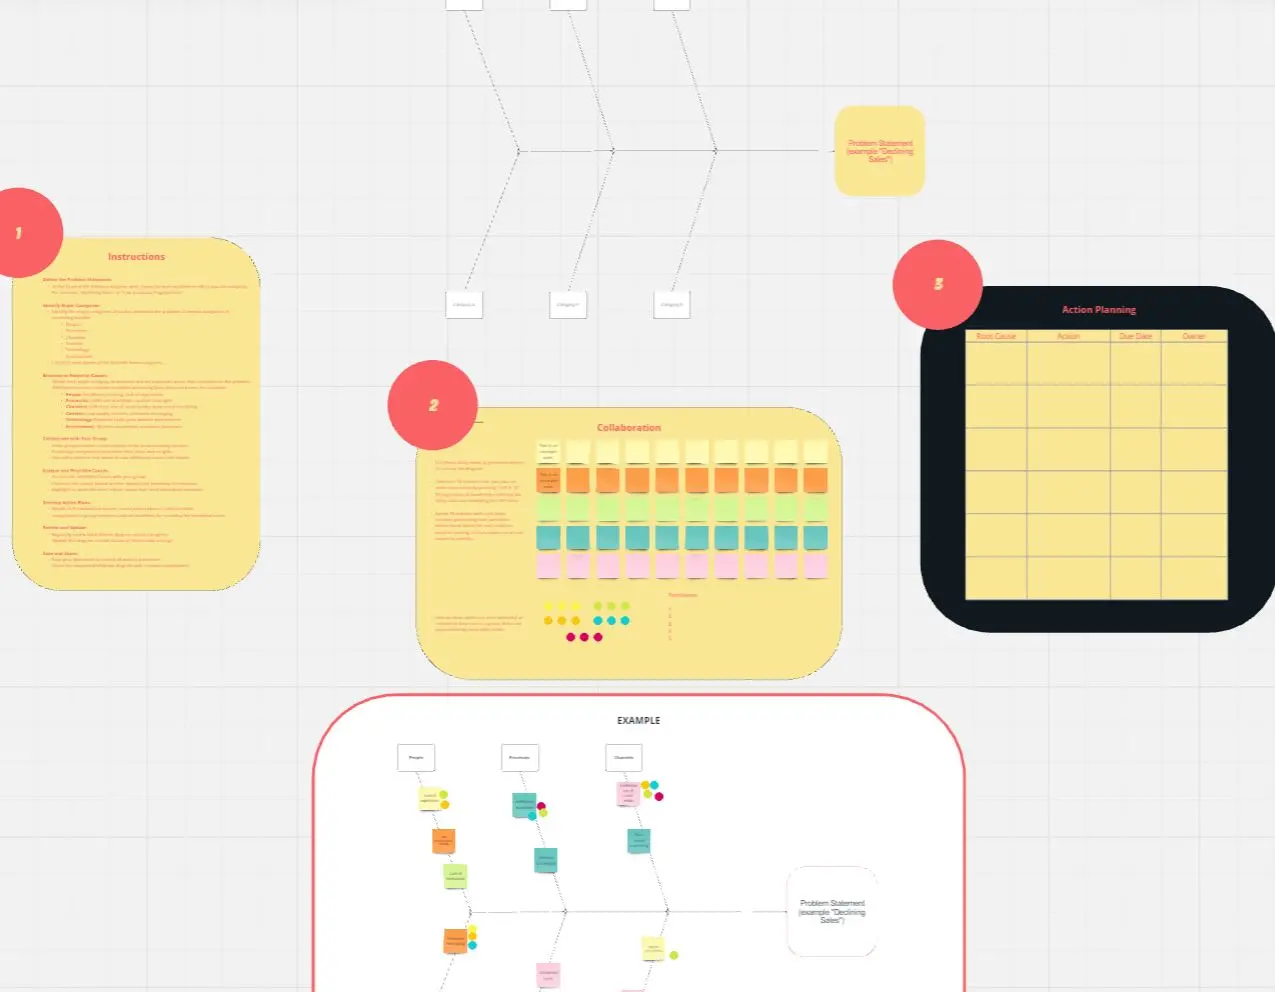
5-Circle Venn Diagram Template
2 likes330 uses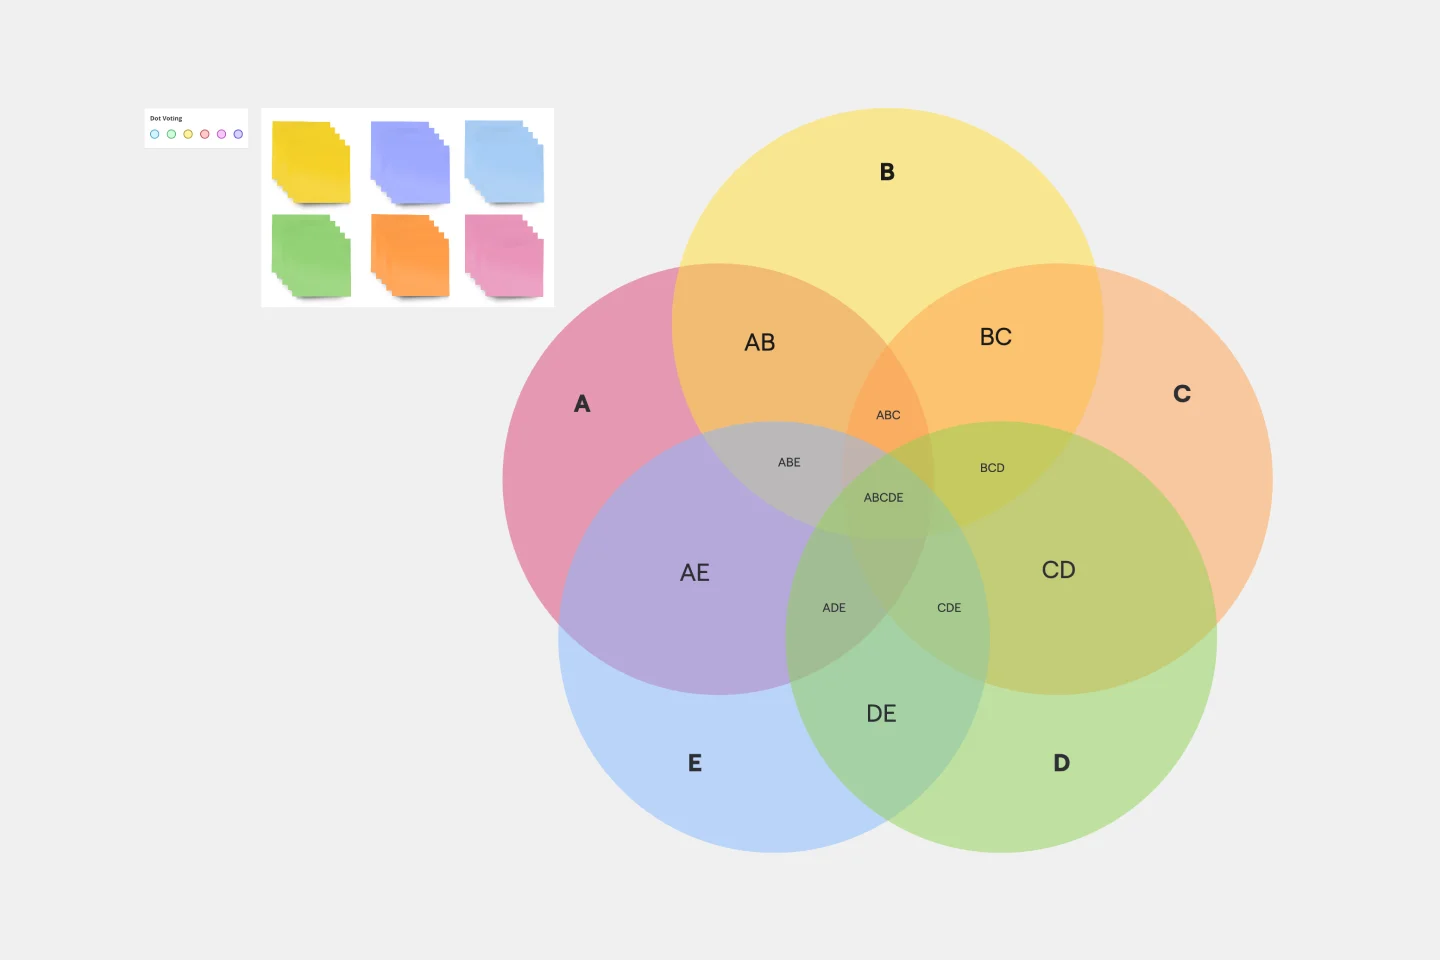
Cisco Data Network Diagram Template
1 likes84 uses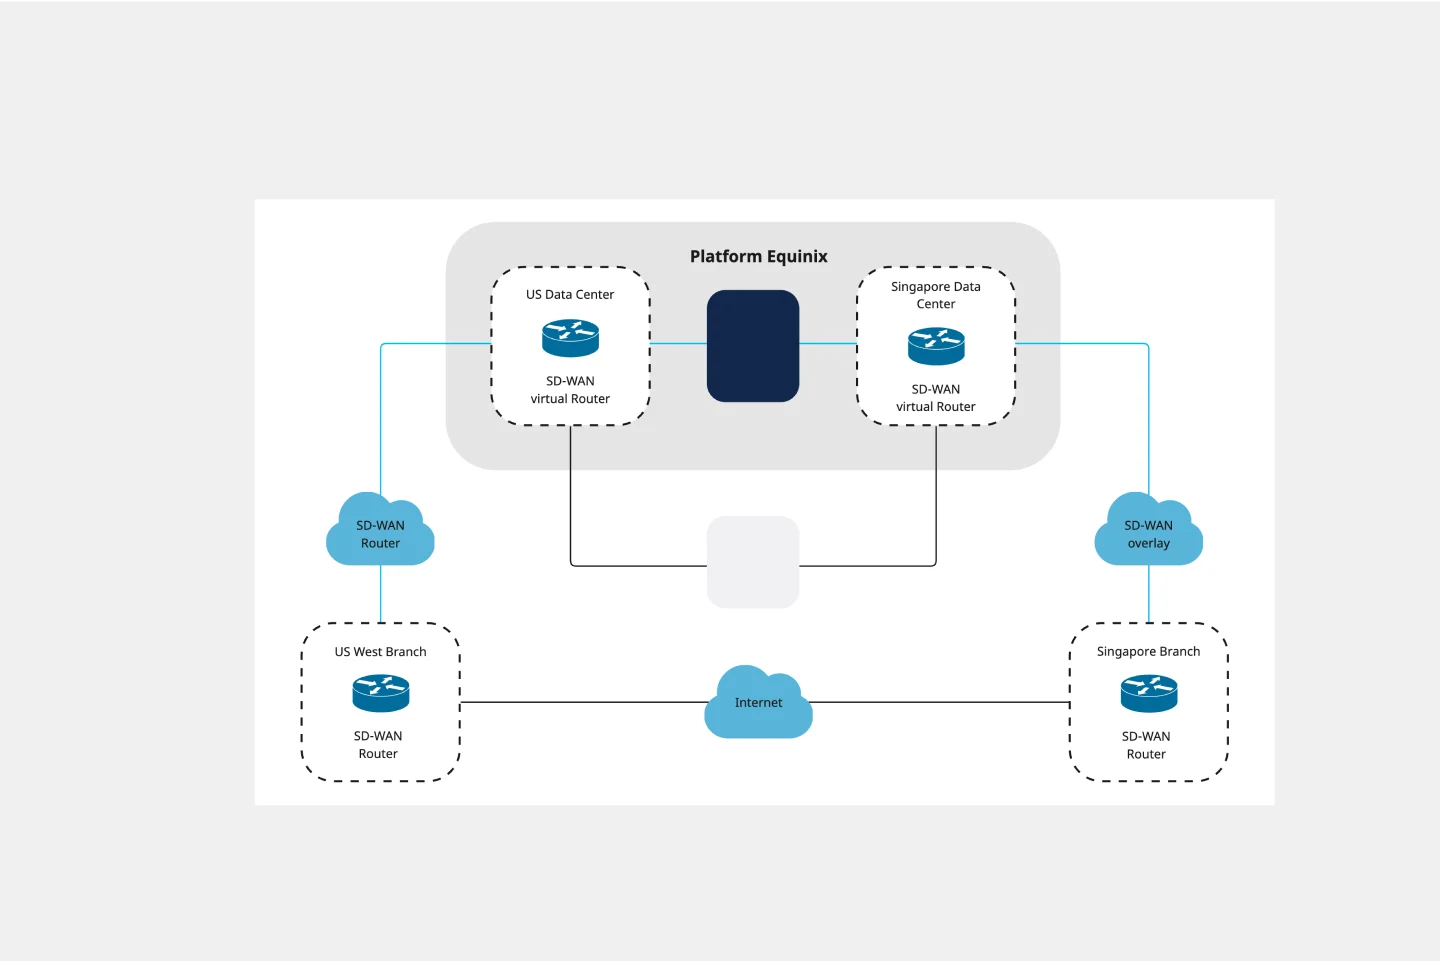
Affinity Diagram
17 likes180 uses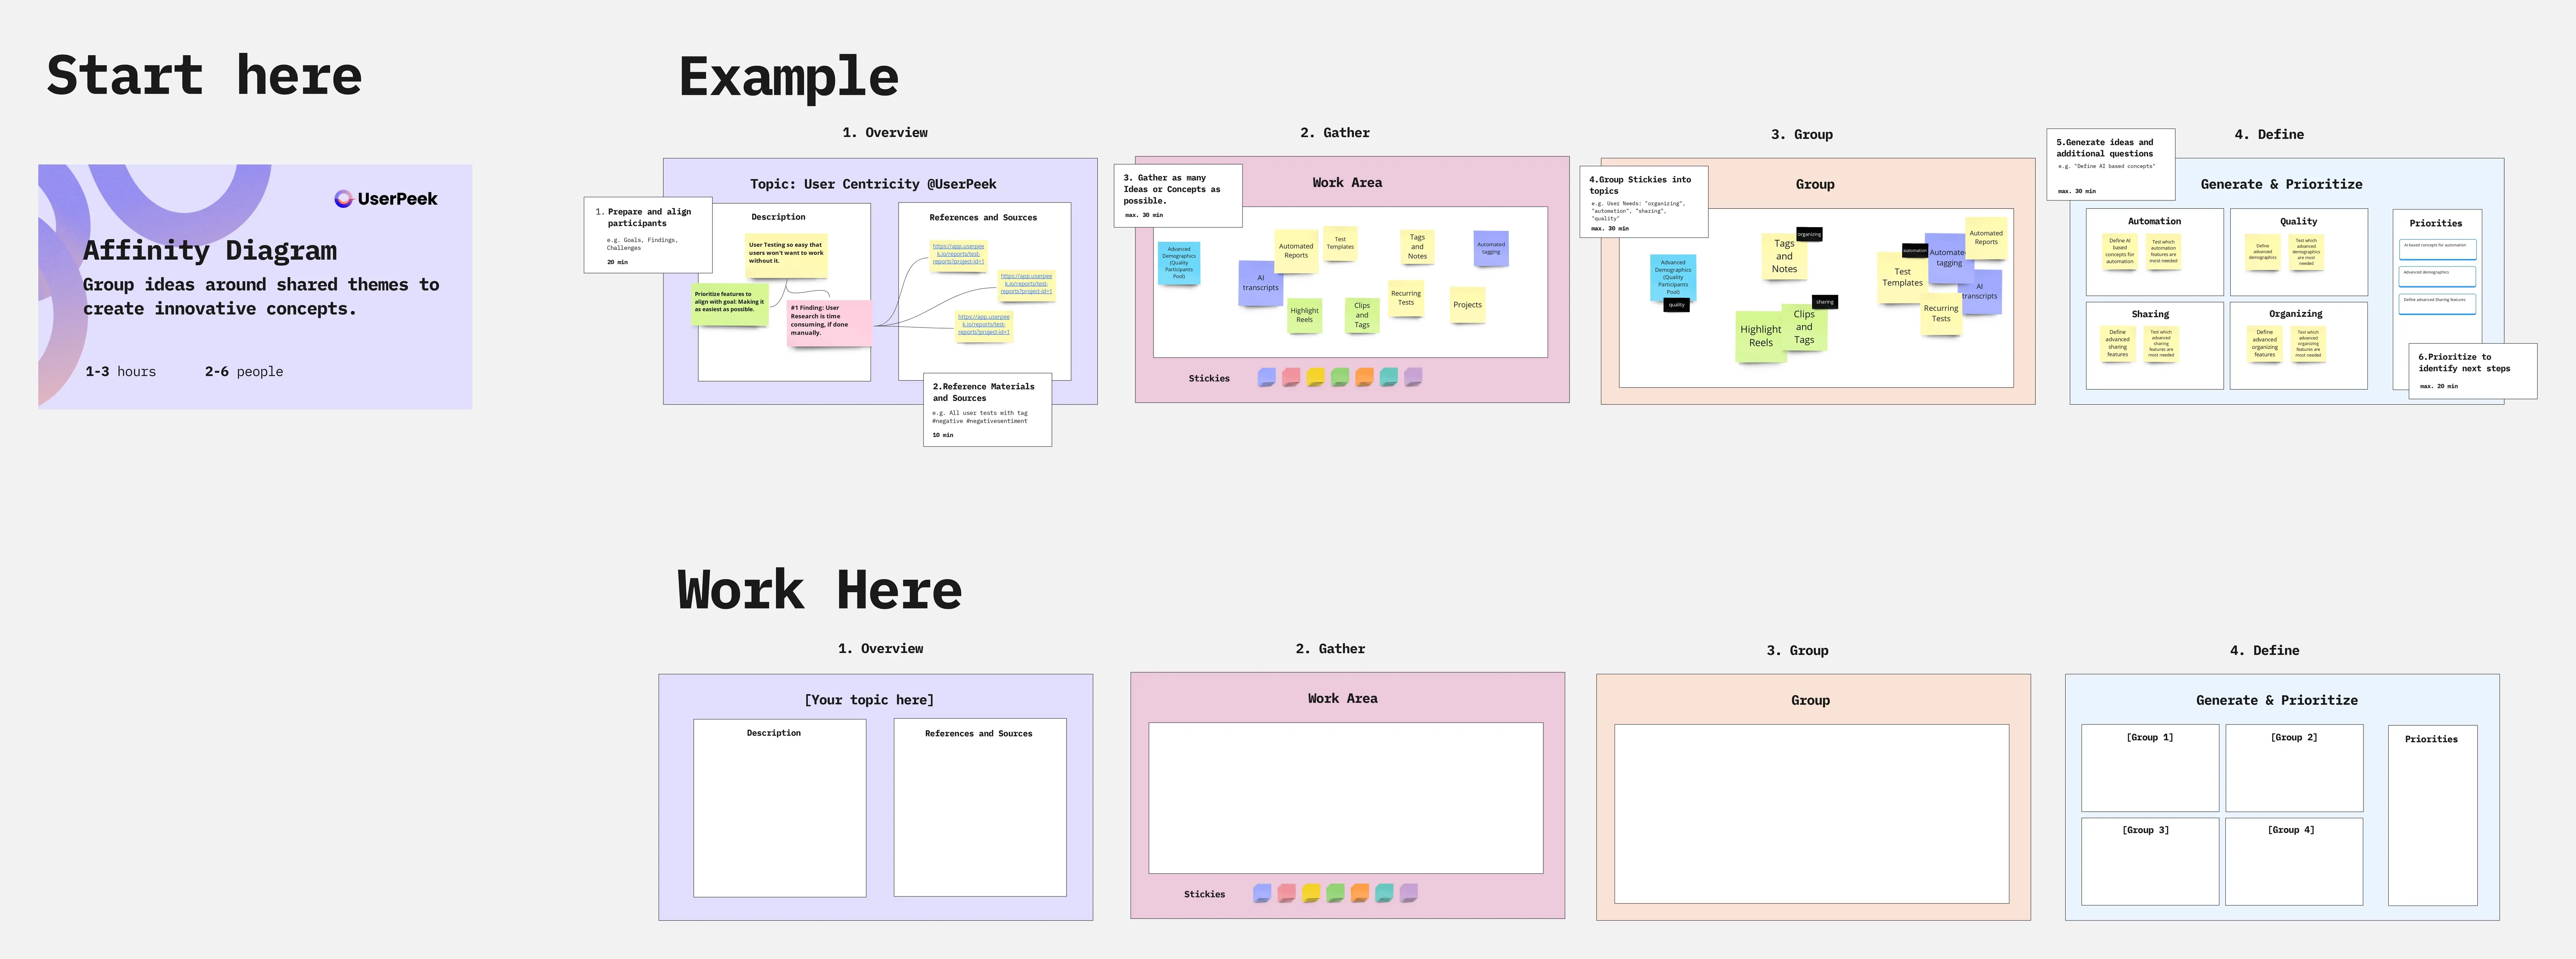
Casual Loop Diagram
47 likes540 uses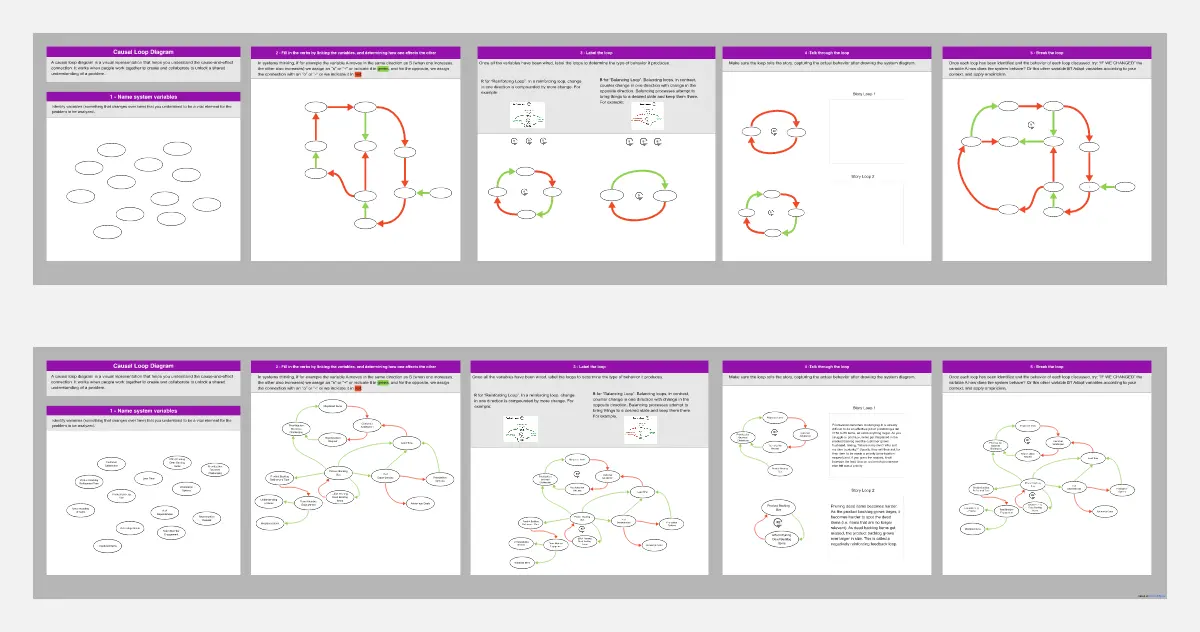
2-Circle Venn Diagram Template
0 likes75 uses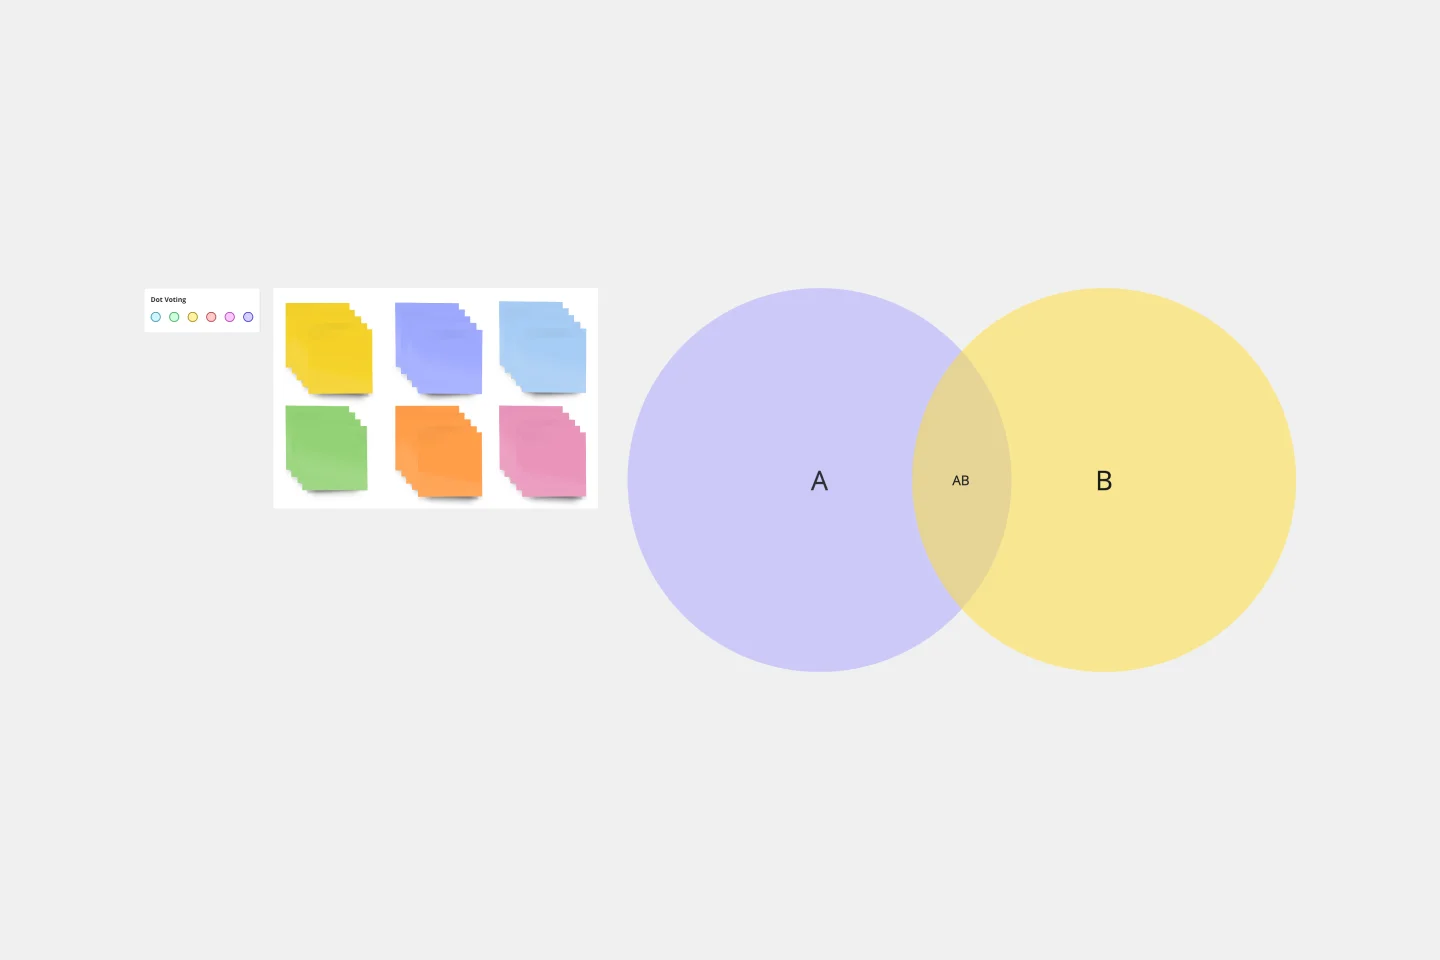
4-Circle Venn Diagram Template
1 likes159 uses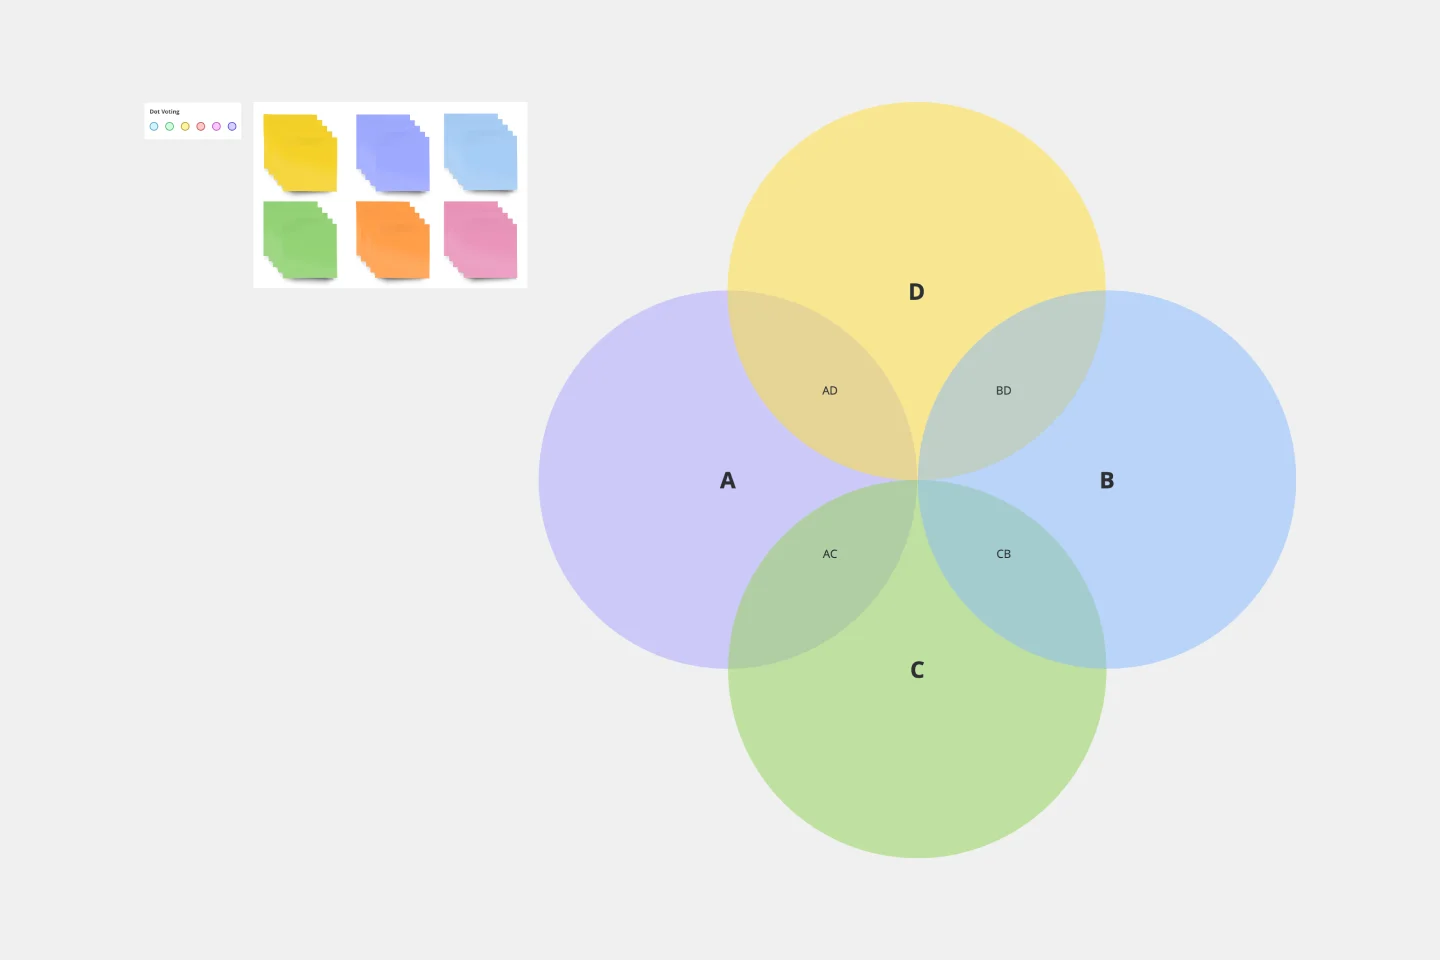
Cause and Effect Diagram Template
2 likes146 uses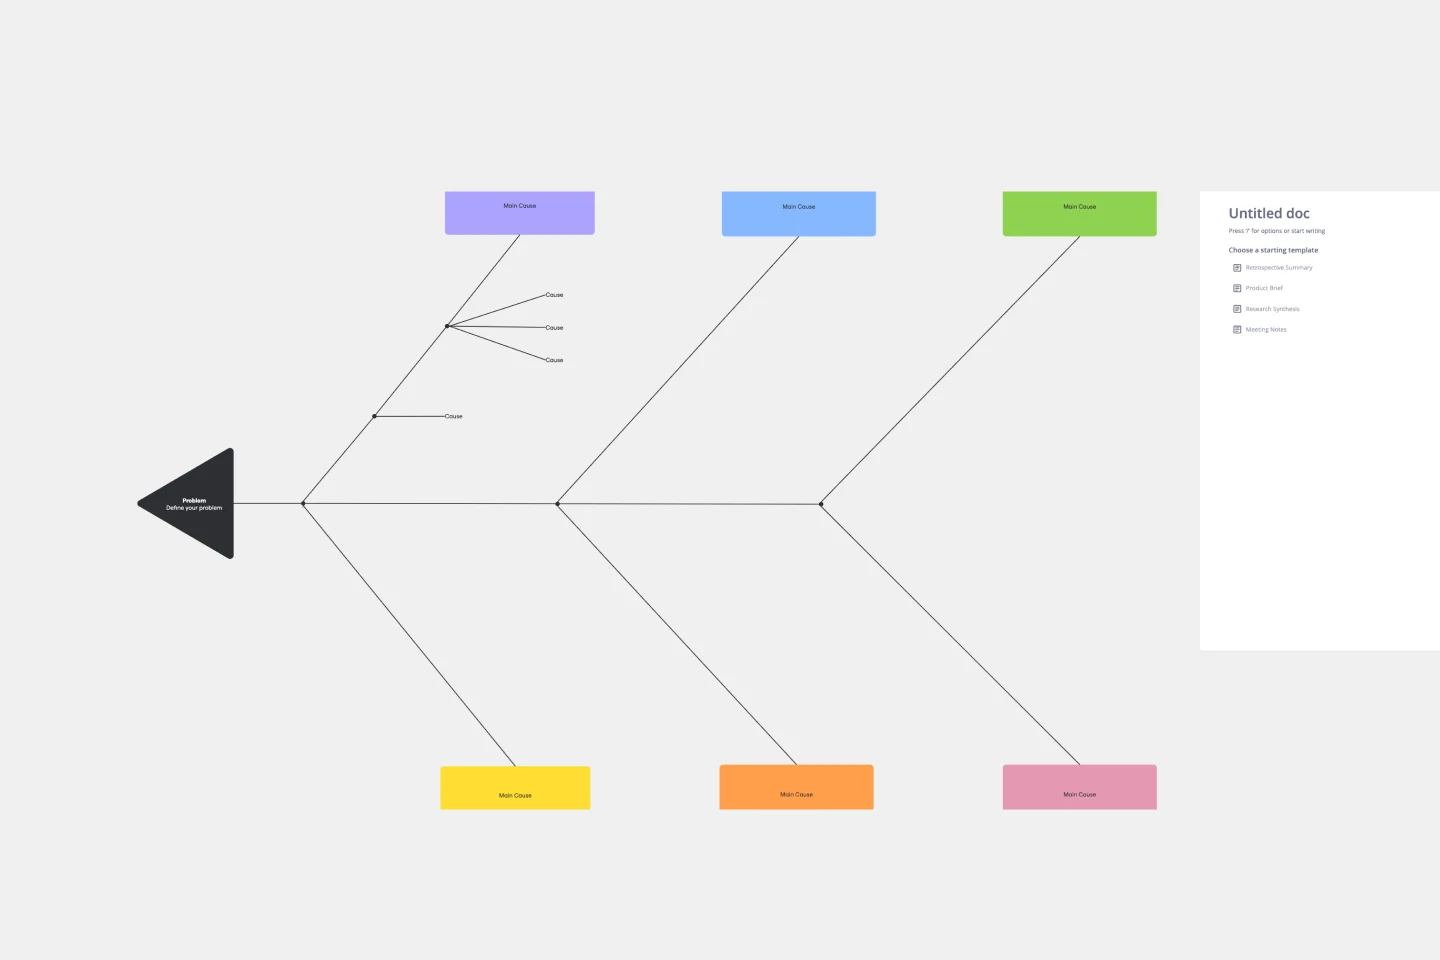
🖌️ Isometric Diagram 3D
28 likes511 uses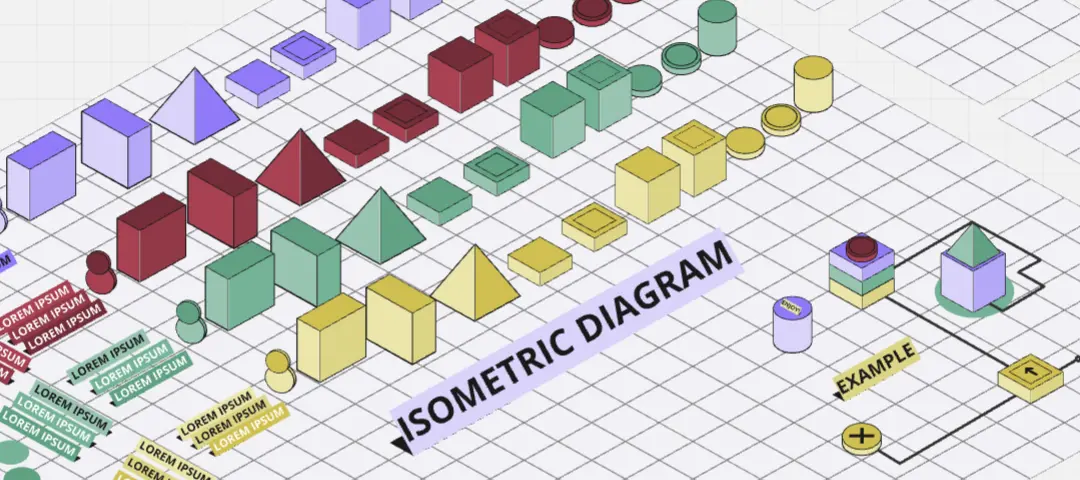
Google Cloud Architecture Diagram Template
2 likes319 uses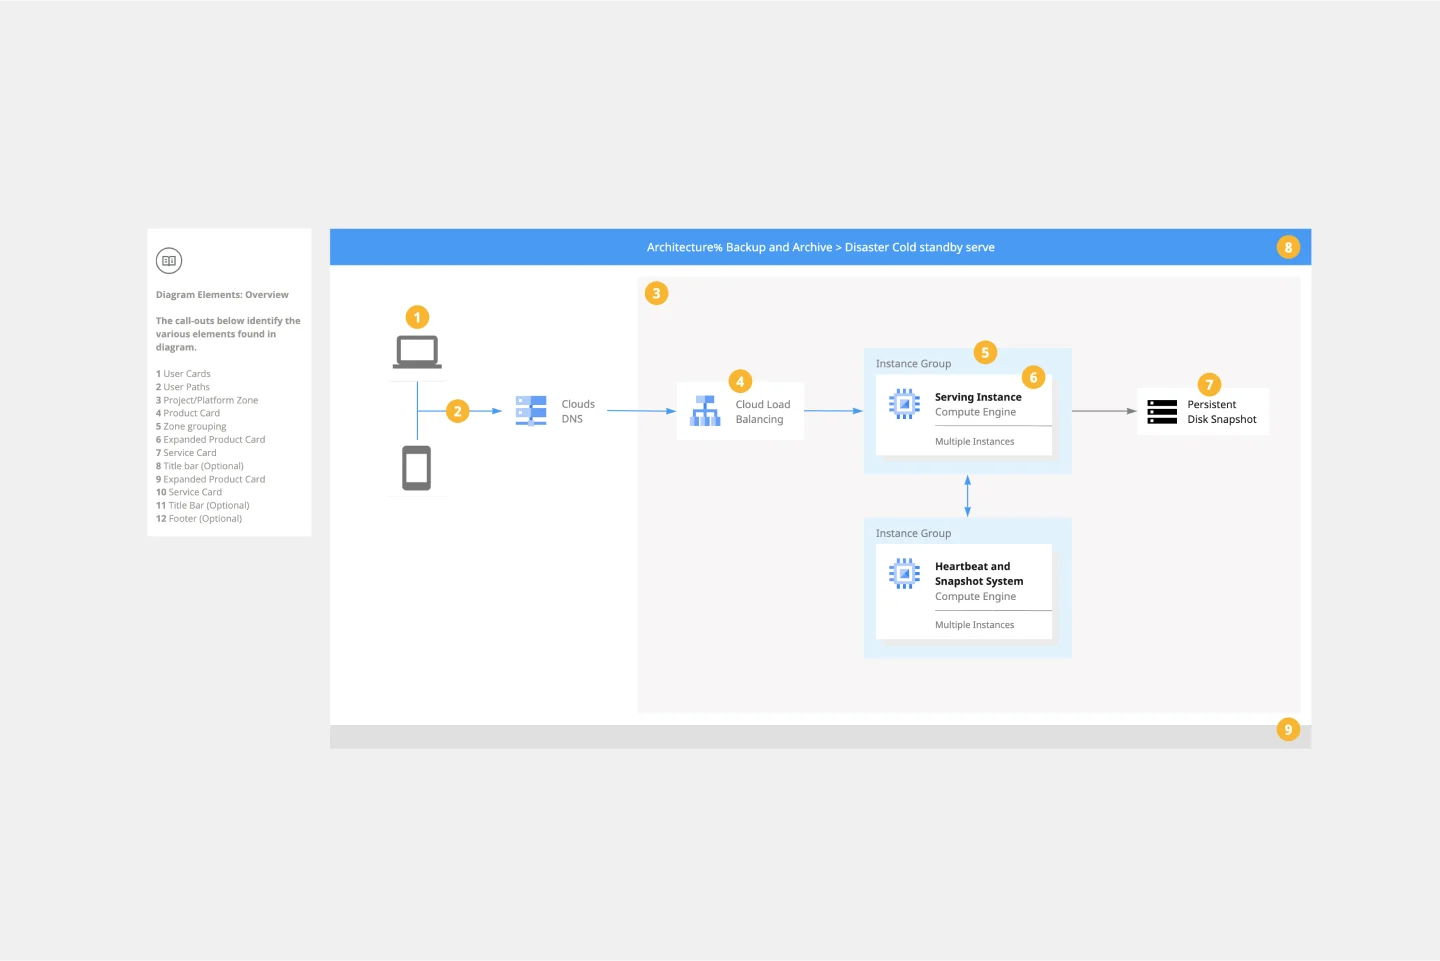
Interrelationship Diagram
25 likes222 uses
UML State Machine Diagram Template
2 likes118 uses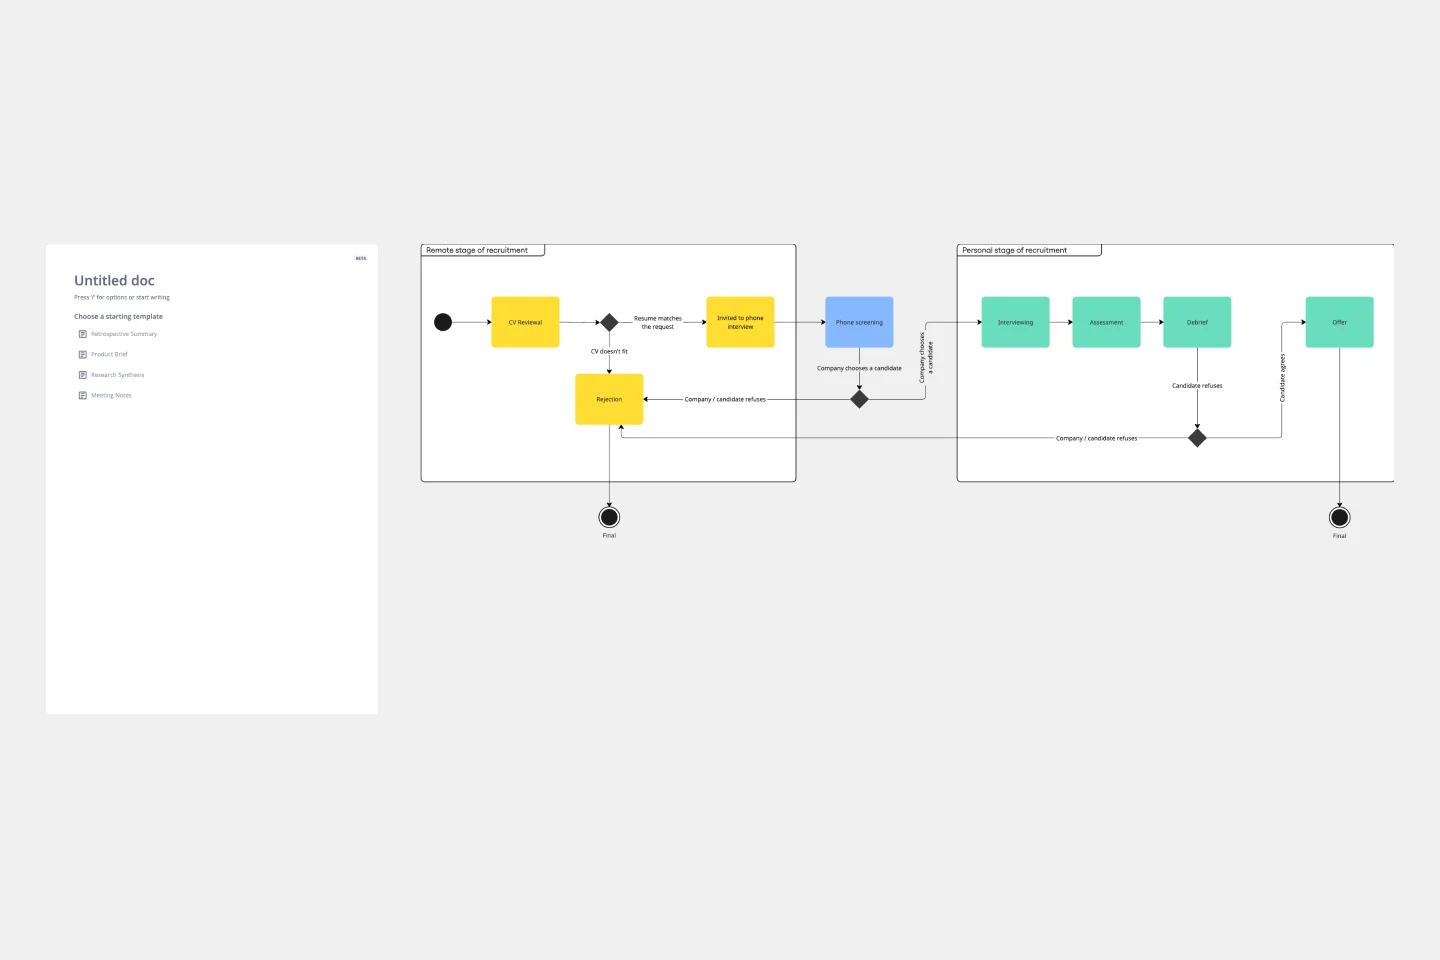
Bull's Eye Diagram Template
2 likes111 uses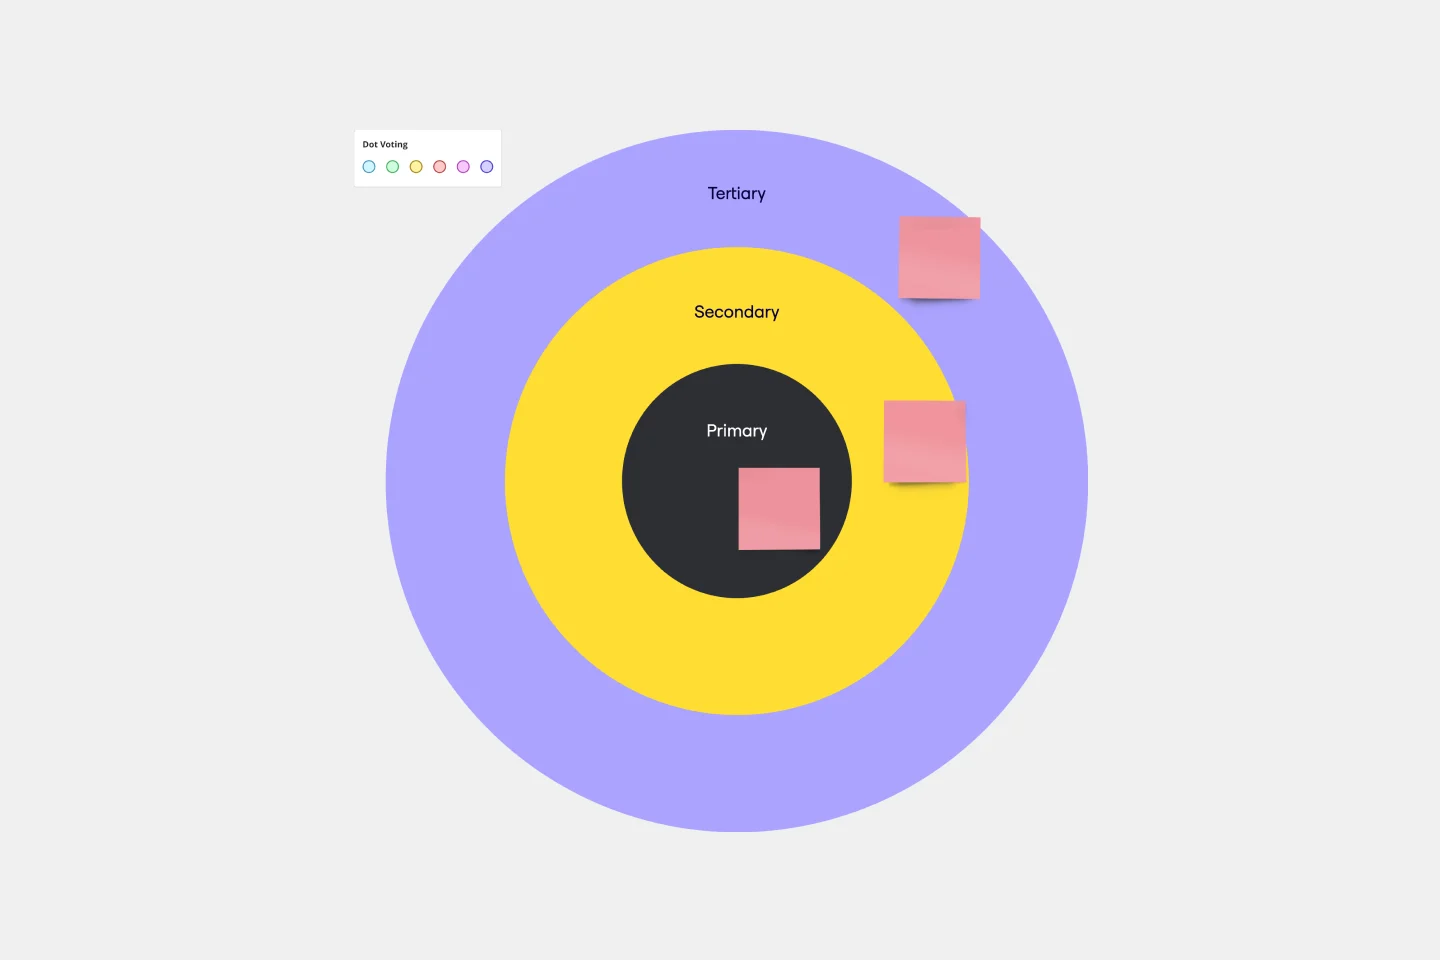
Venn Diagram Practical Applications
8 likes26 uses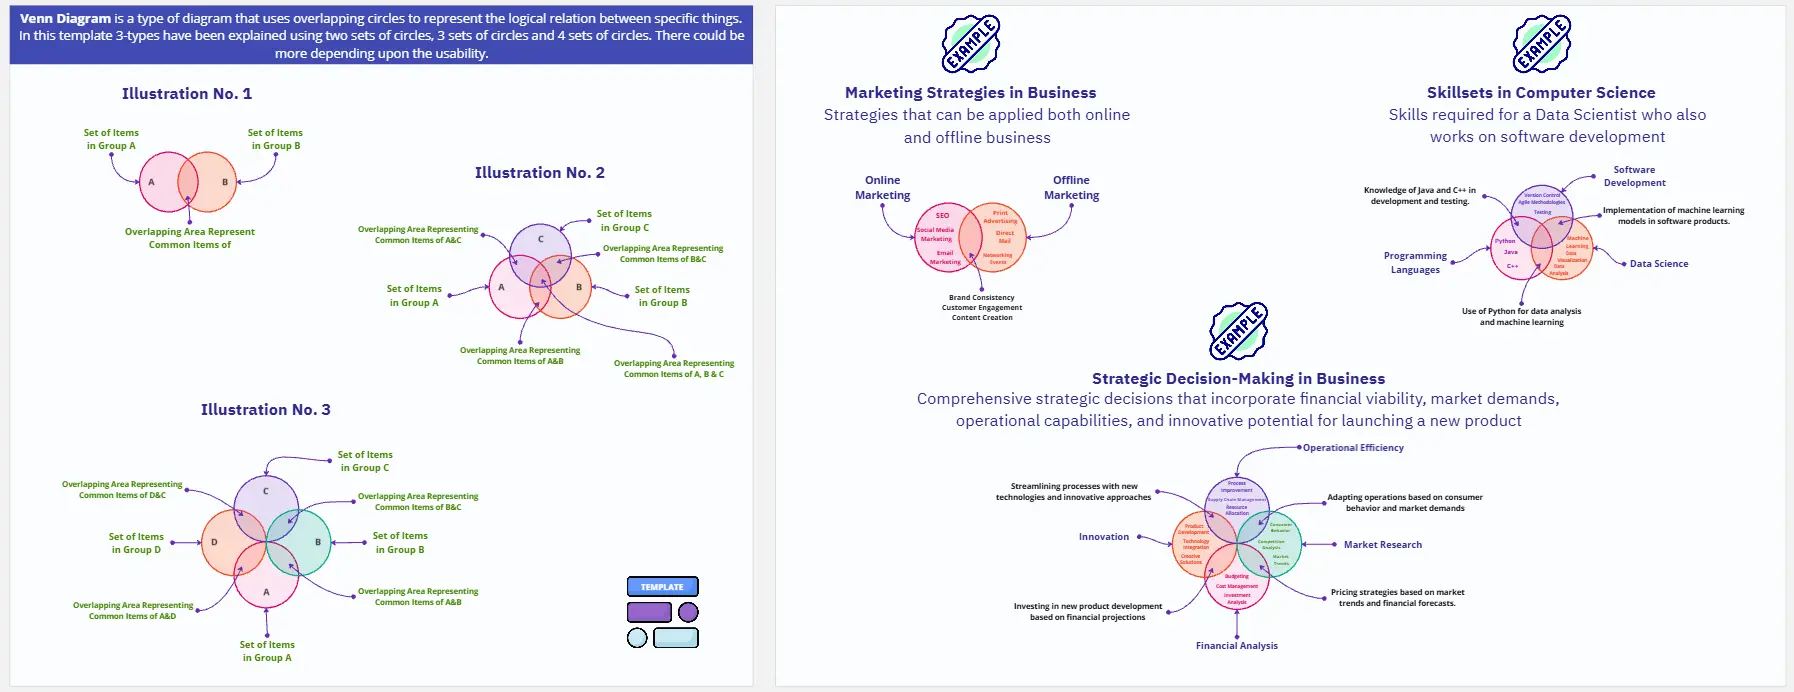
Solar System Diagram
31 likes138 uses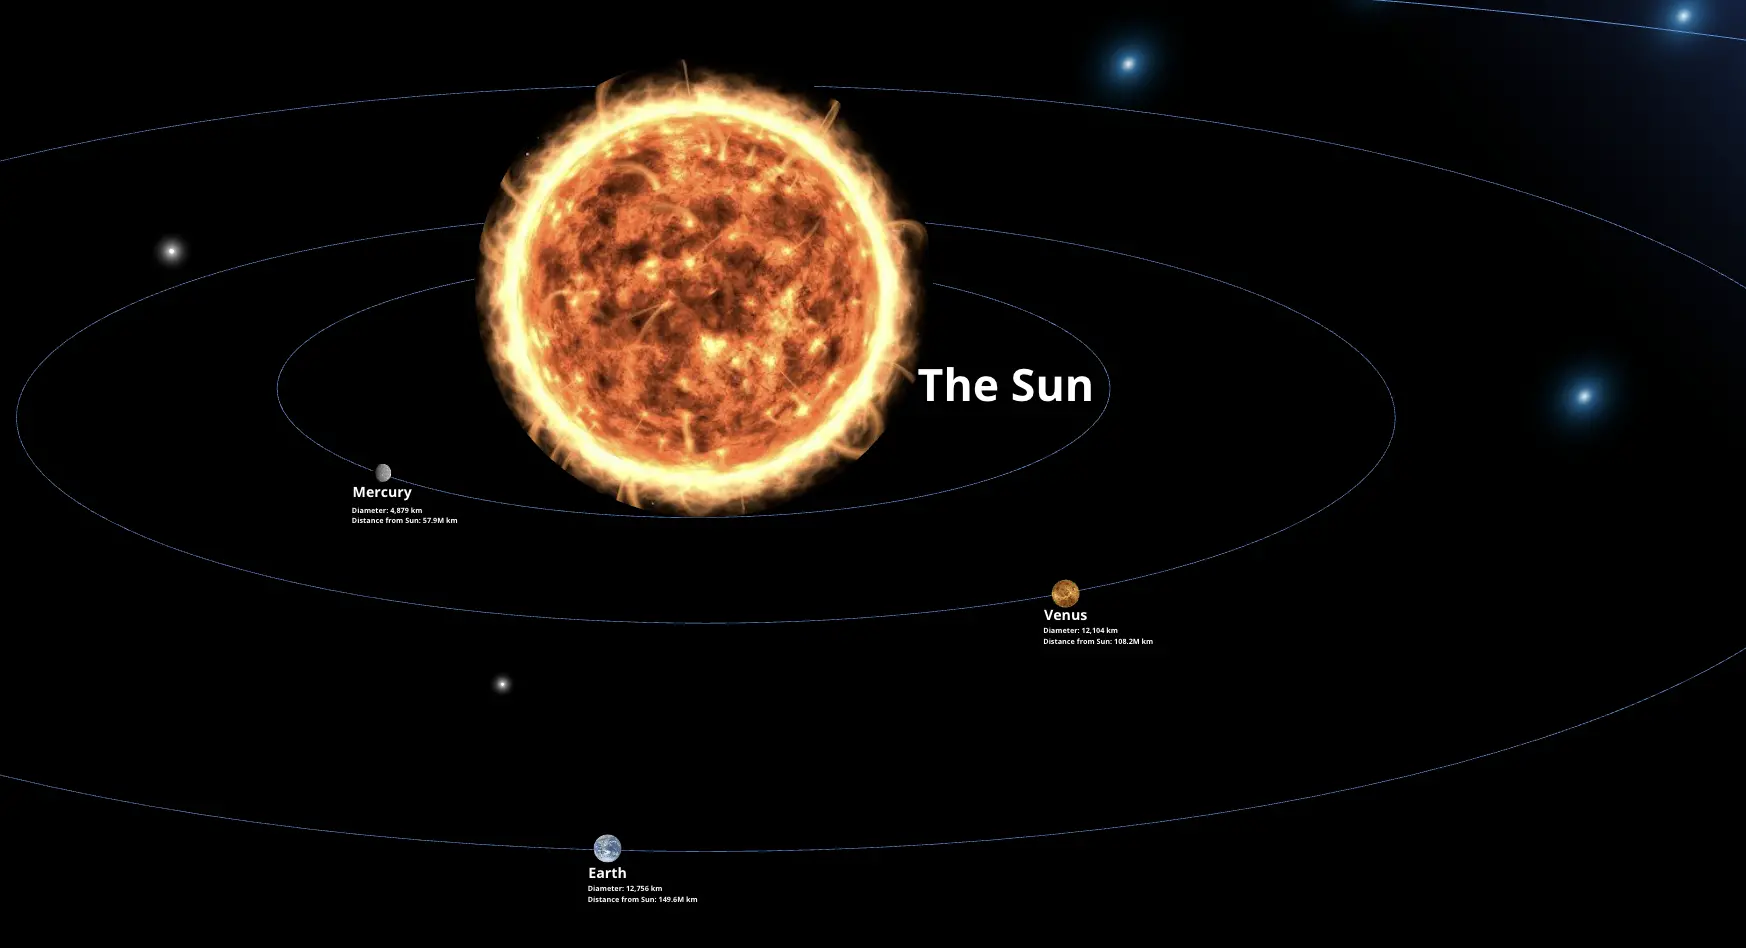
Venn Diagram for Marketing Analysis
23 likes34 uses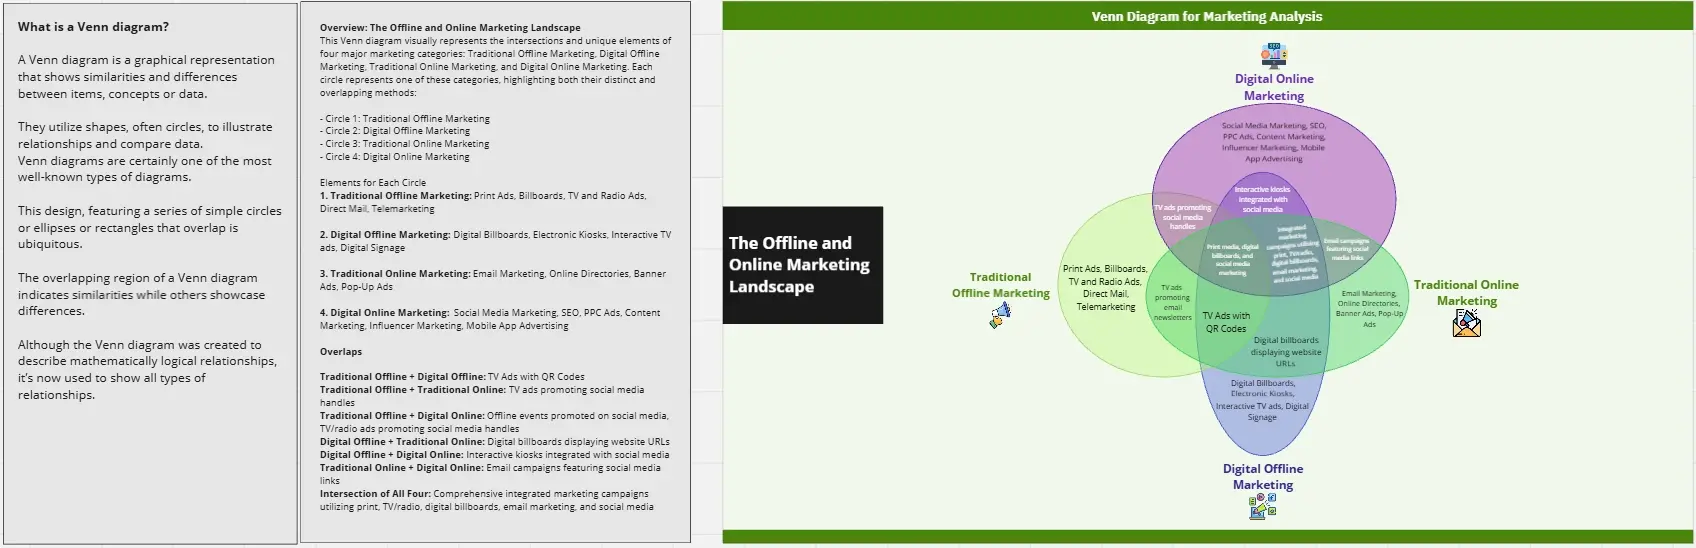
UML Sequence Diagram AI Template
1 likes30 uses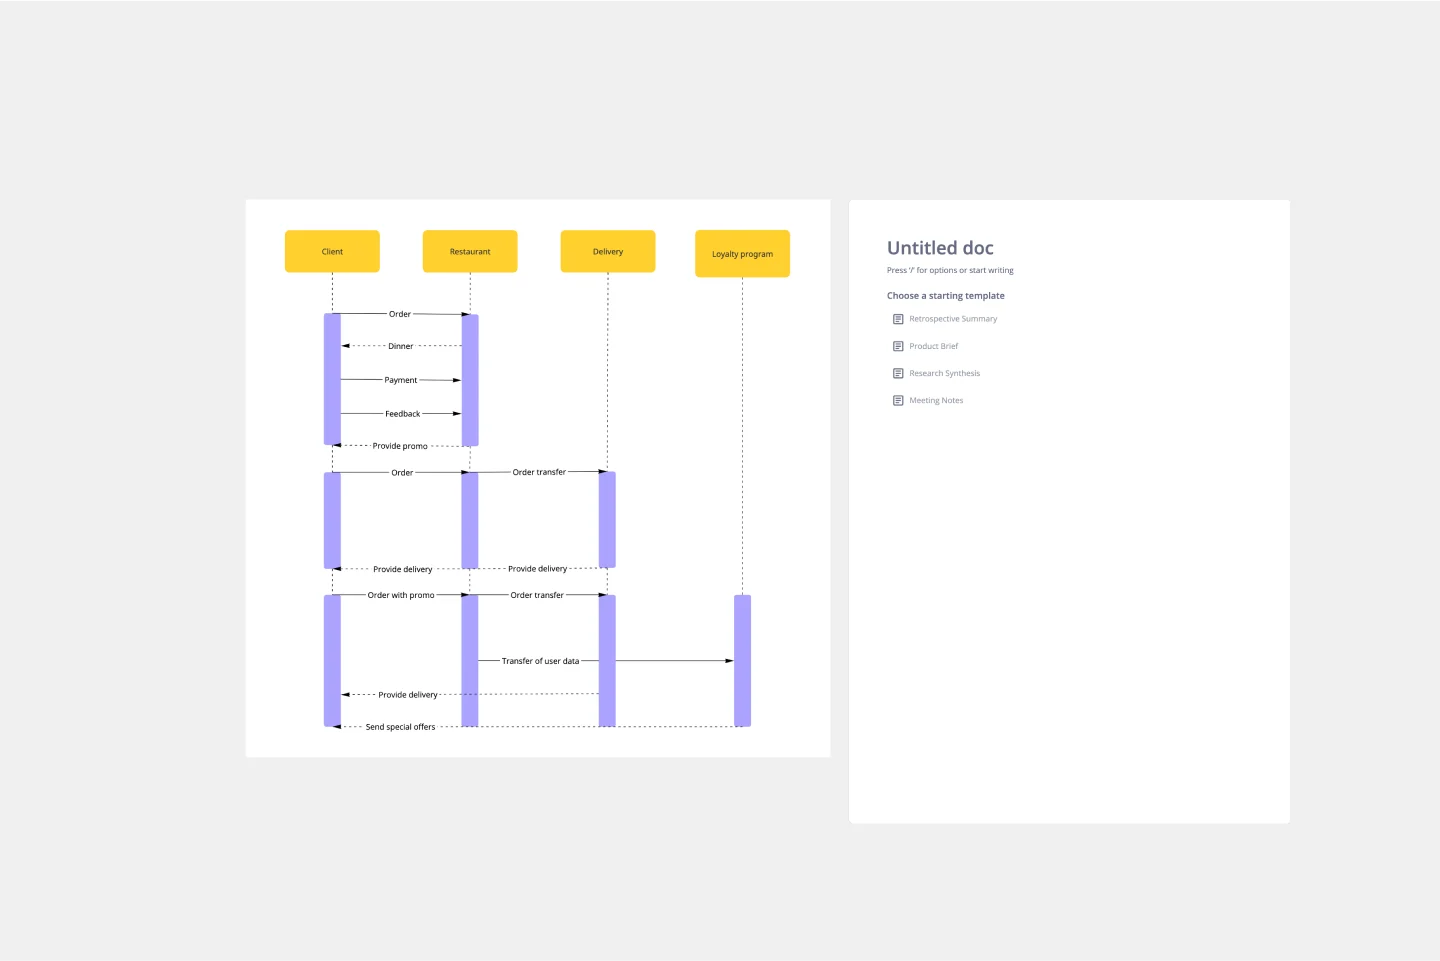
5-Set Venn Diagram
6 likes105 uses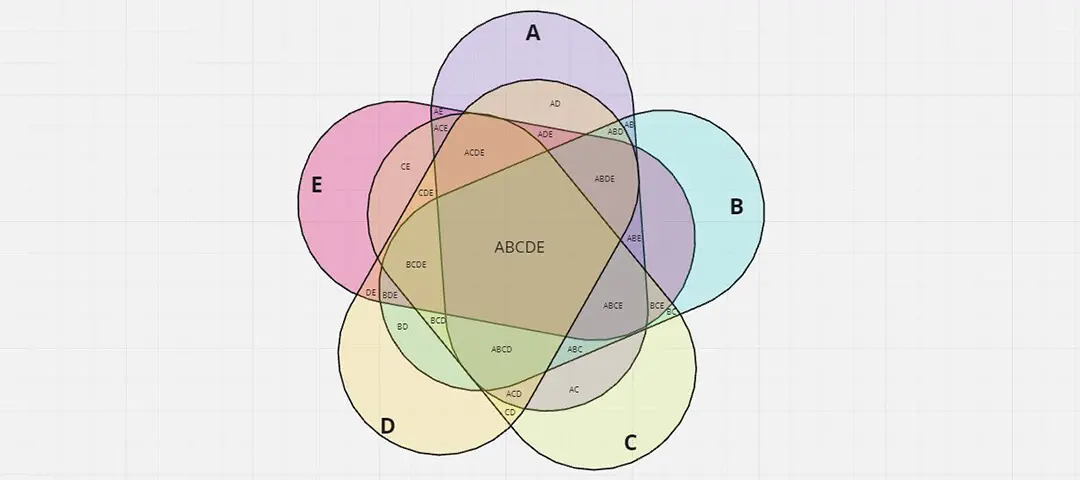
Fishbone Diagram for Process Improvement
15 likes92 uses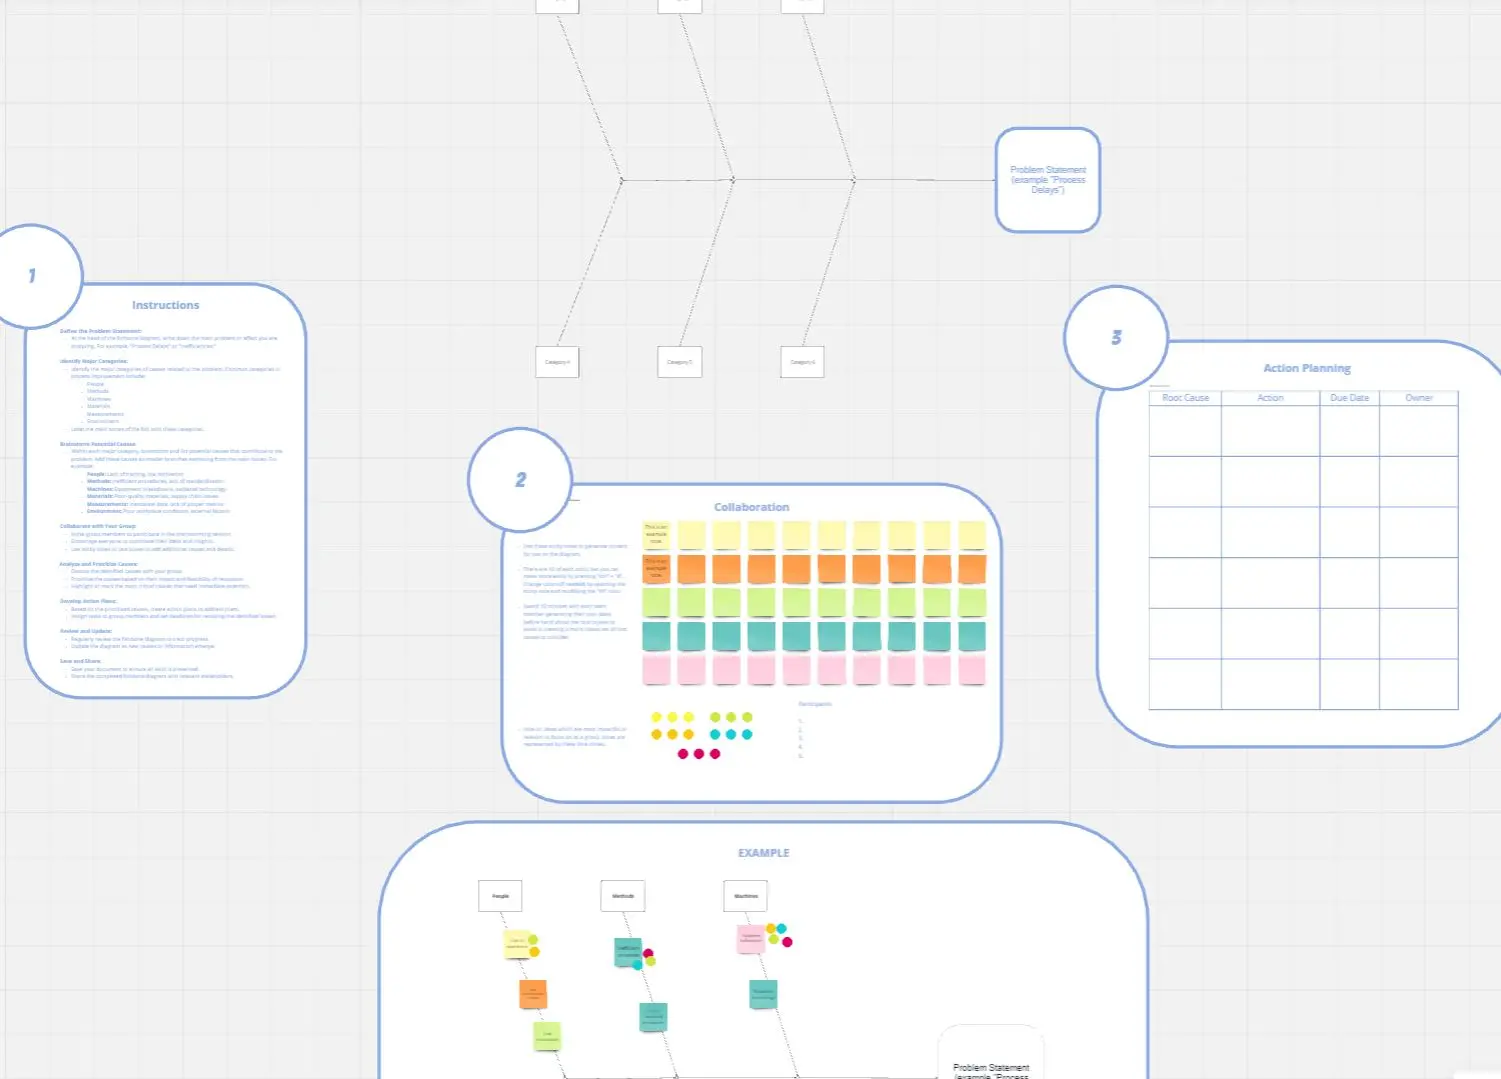
Fishbone Diagram for Service Improvement
4 likes27 uses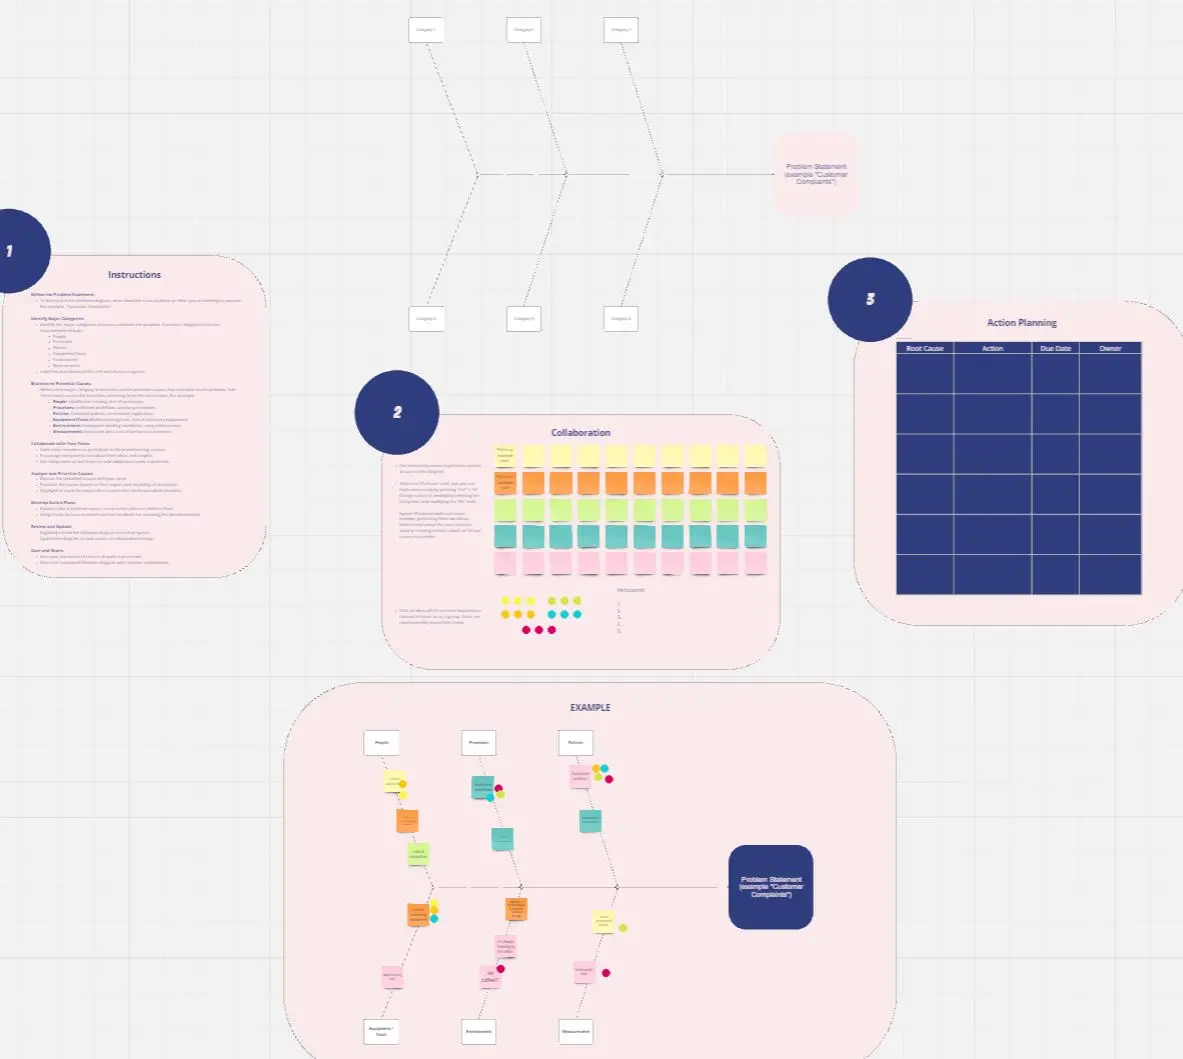
Fishbone Diagram for Quality Control
6 likes45 uses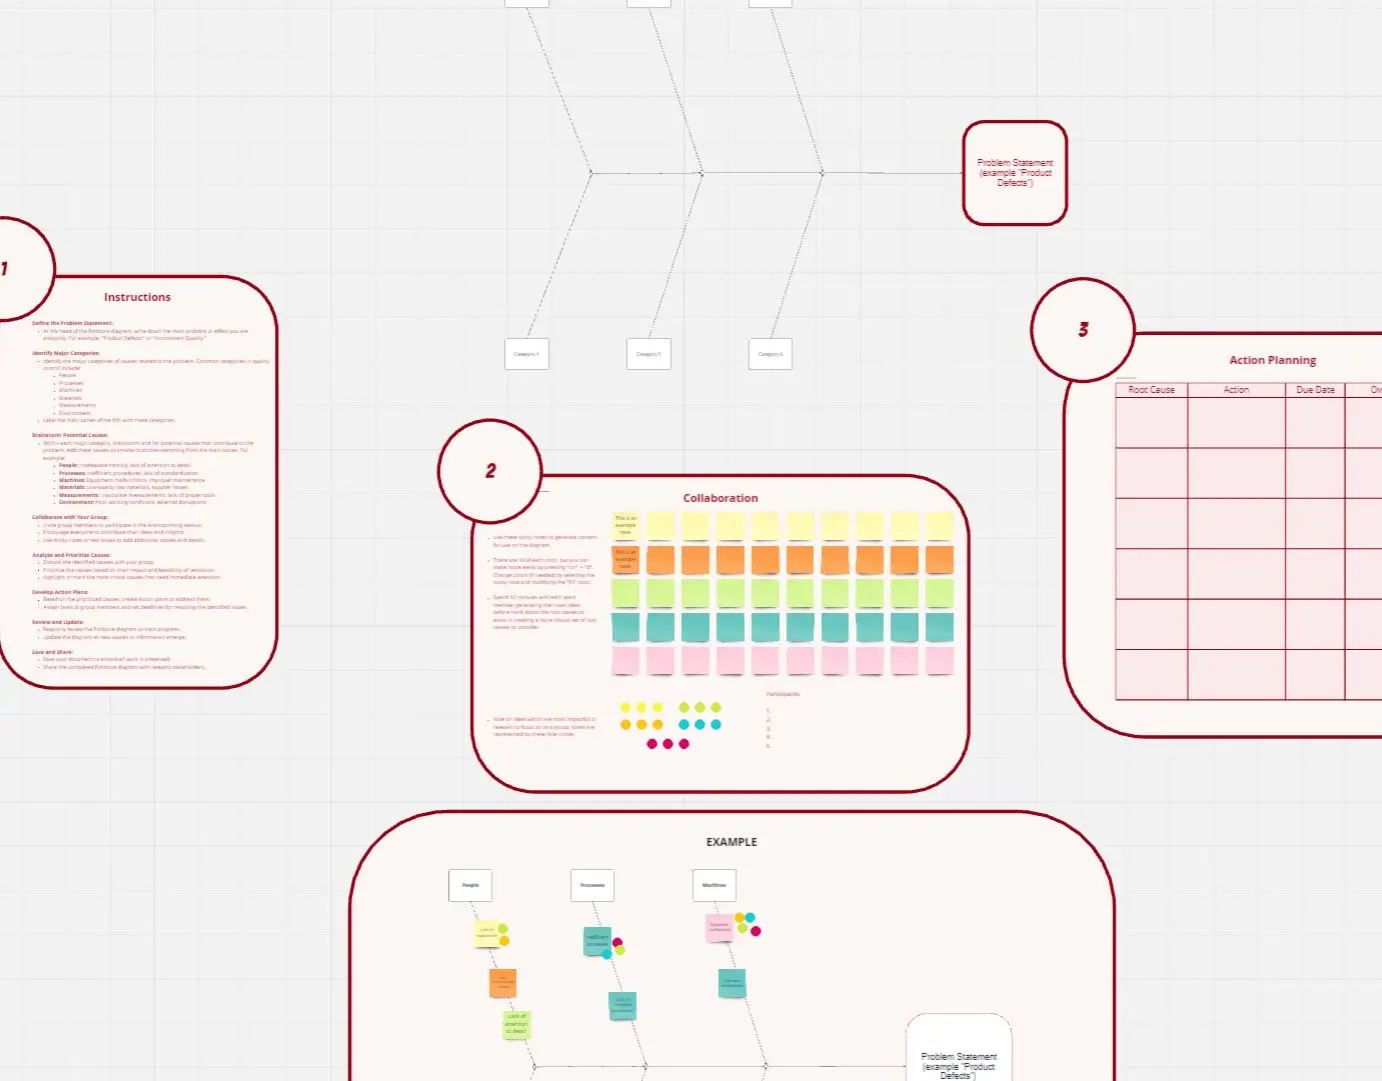
User Role Diagram
5 likes91 uses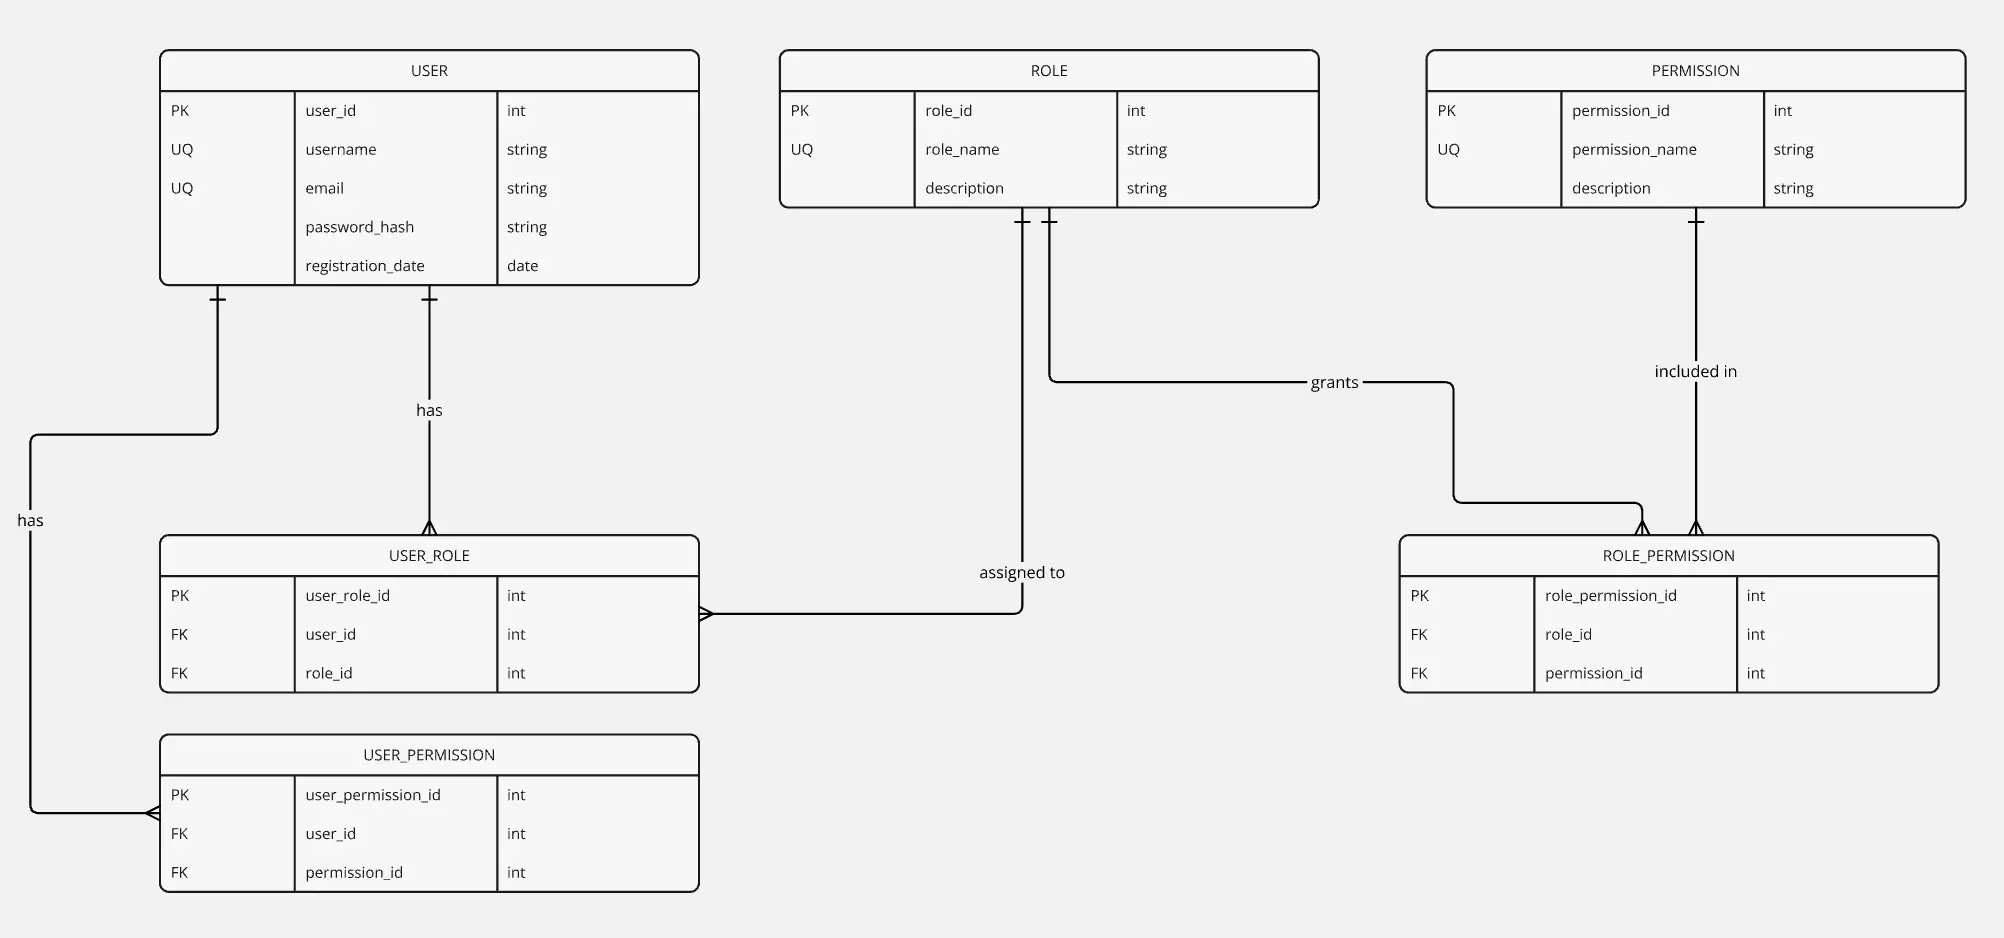
Simple Information Architecture Diagram
20 likes319 uses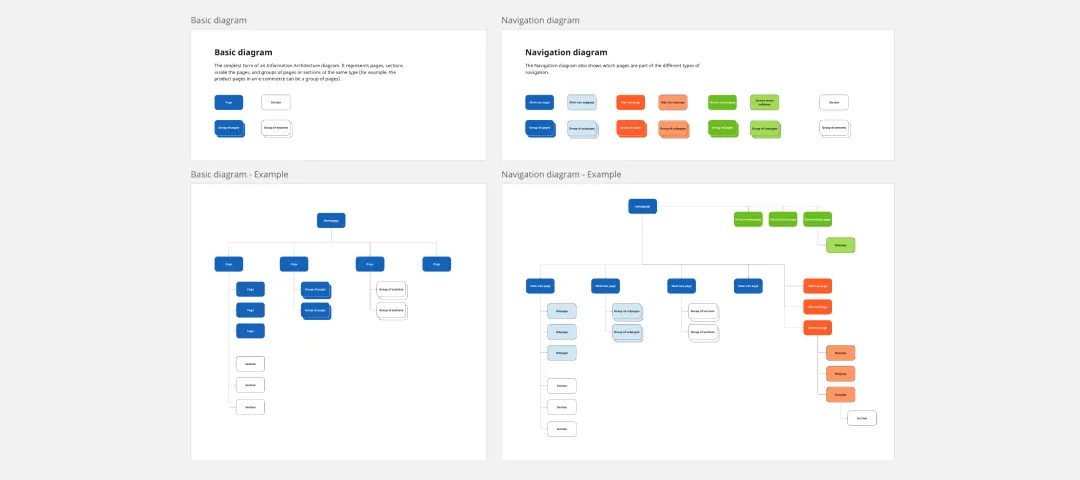
Venn Diagram for Research
11 likes85 uses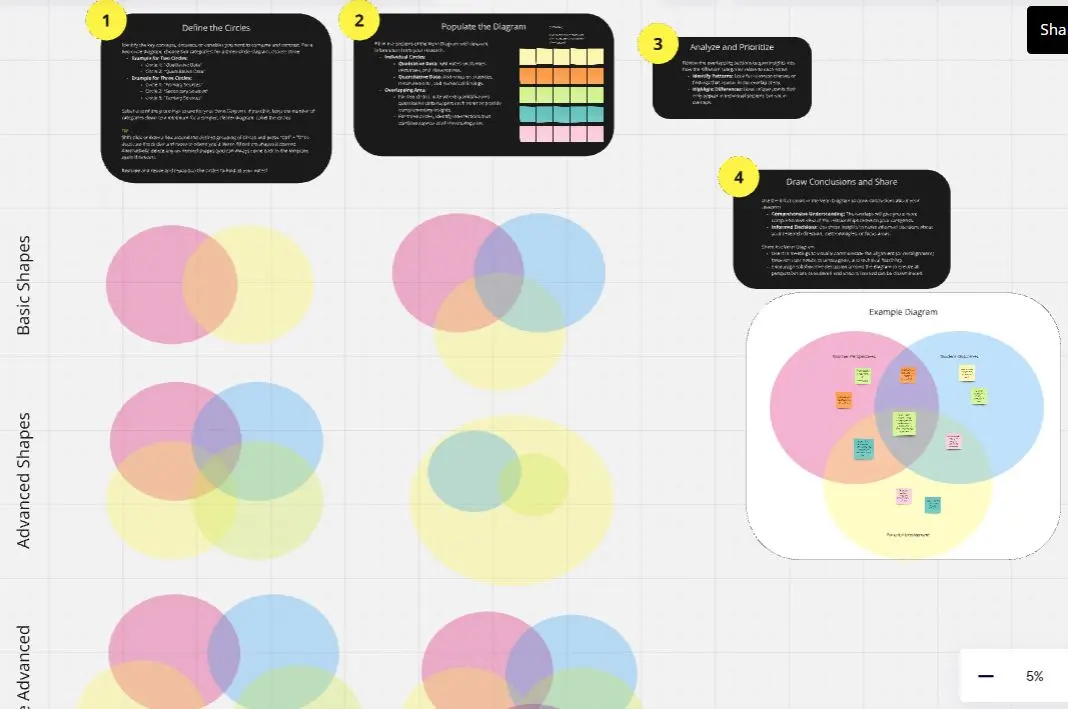
System Context Diagram
45 likes313 uses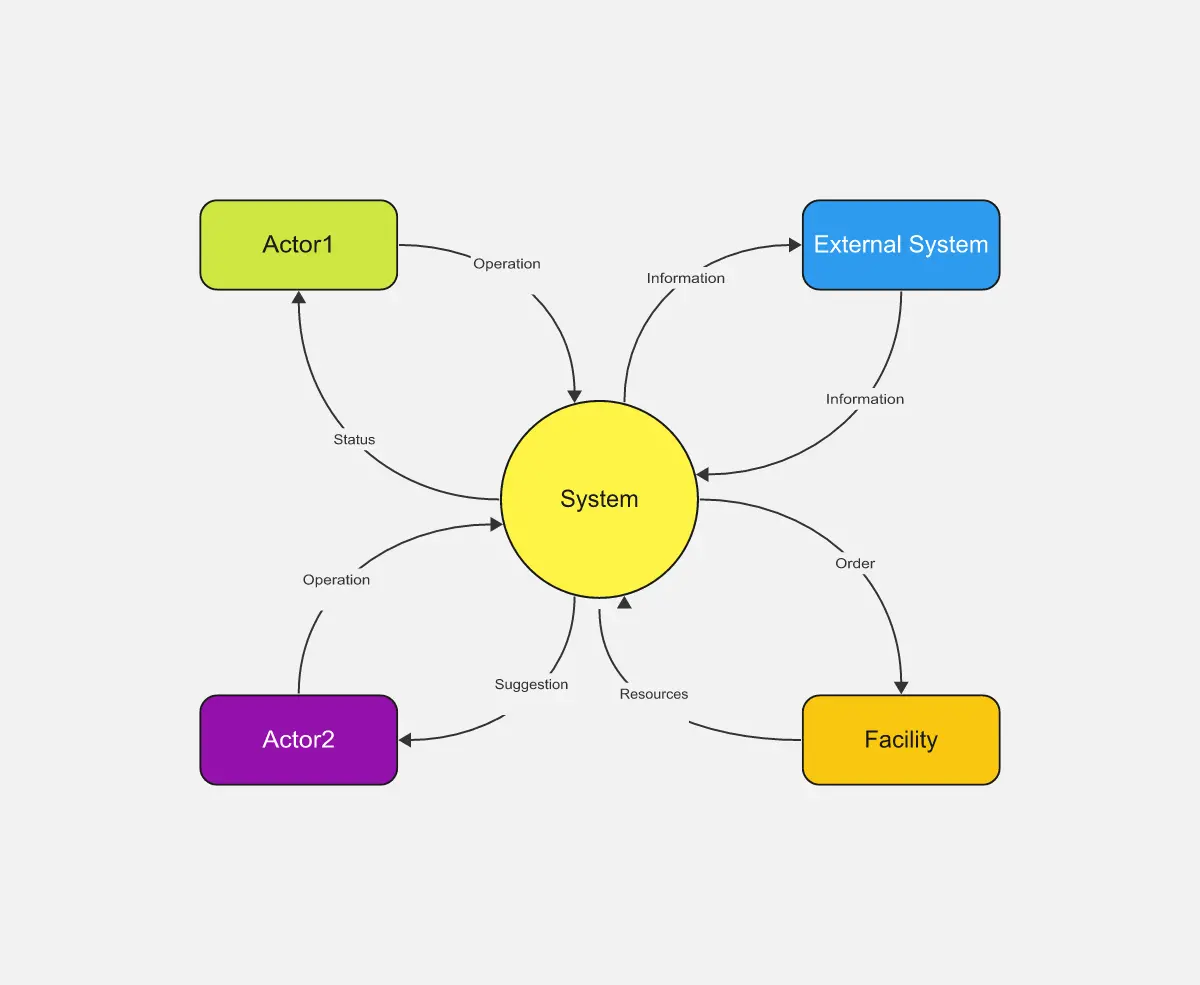
Swim Lane Diagram with Data
201 likes2.9K uses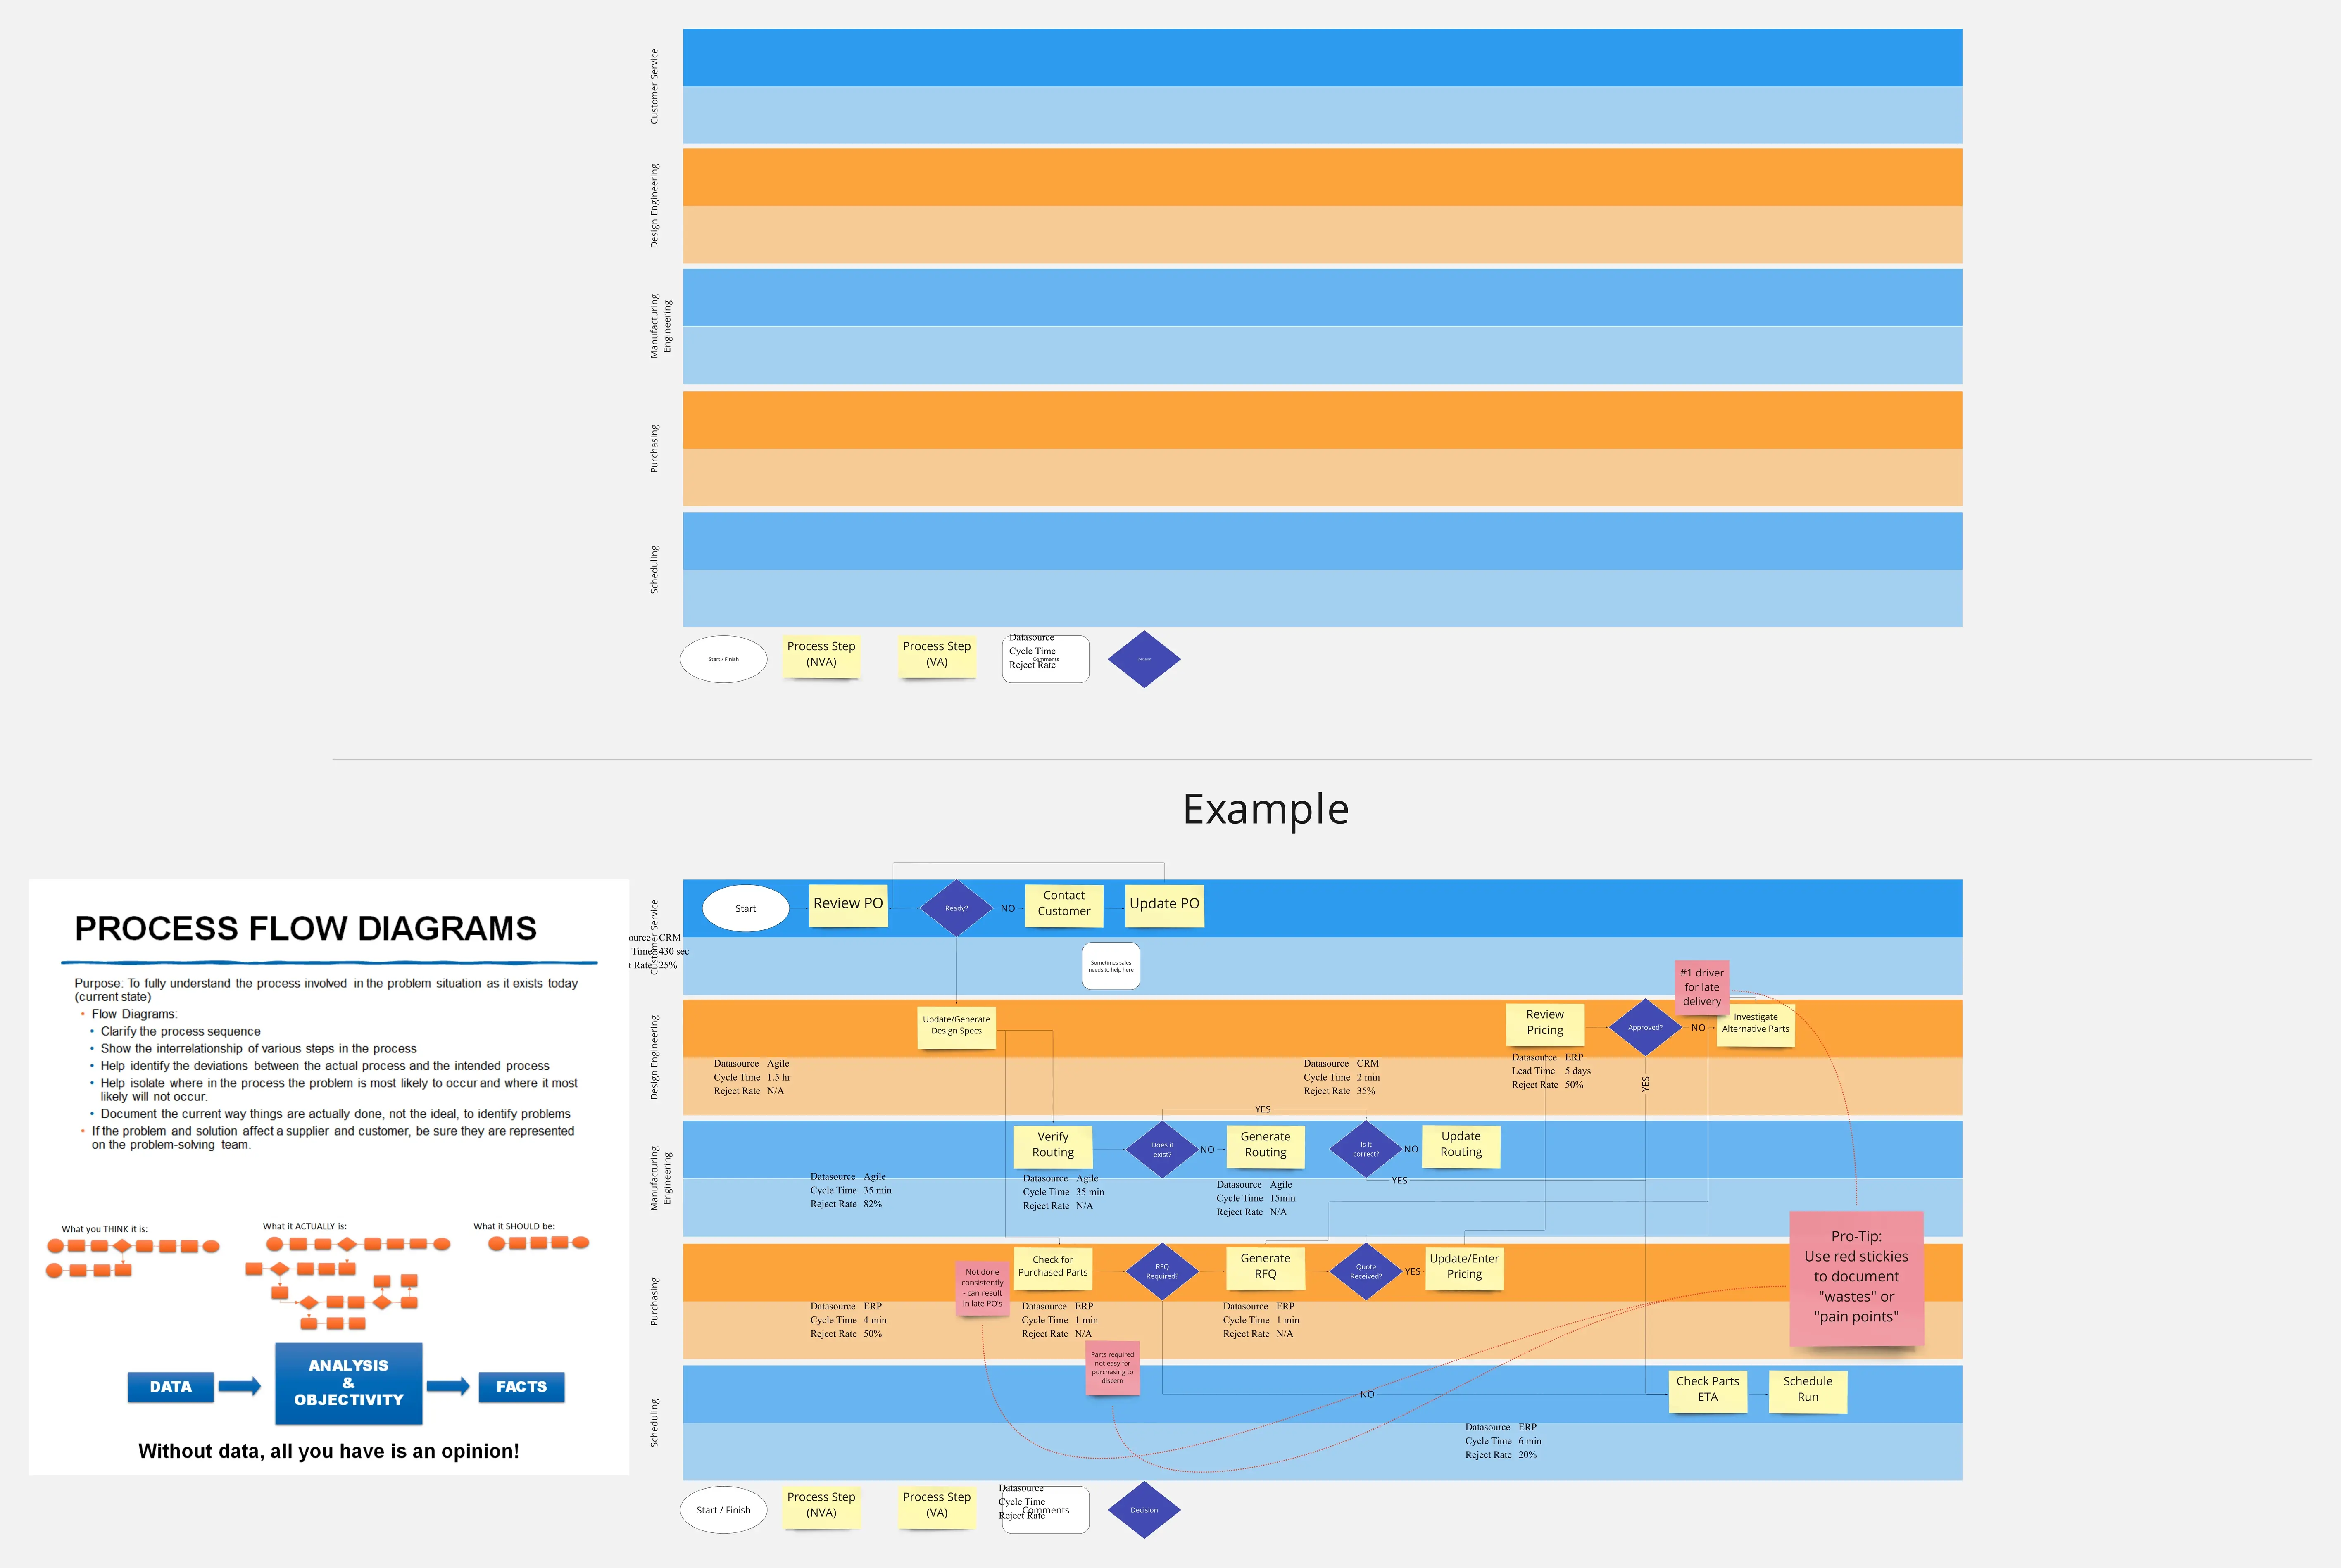
Causes Diagram
4 likes8 uses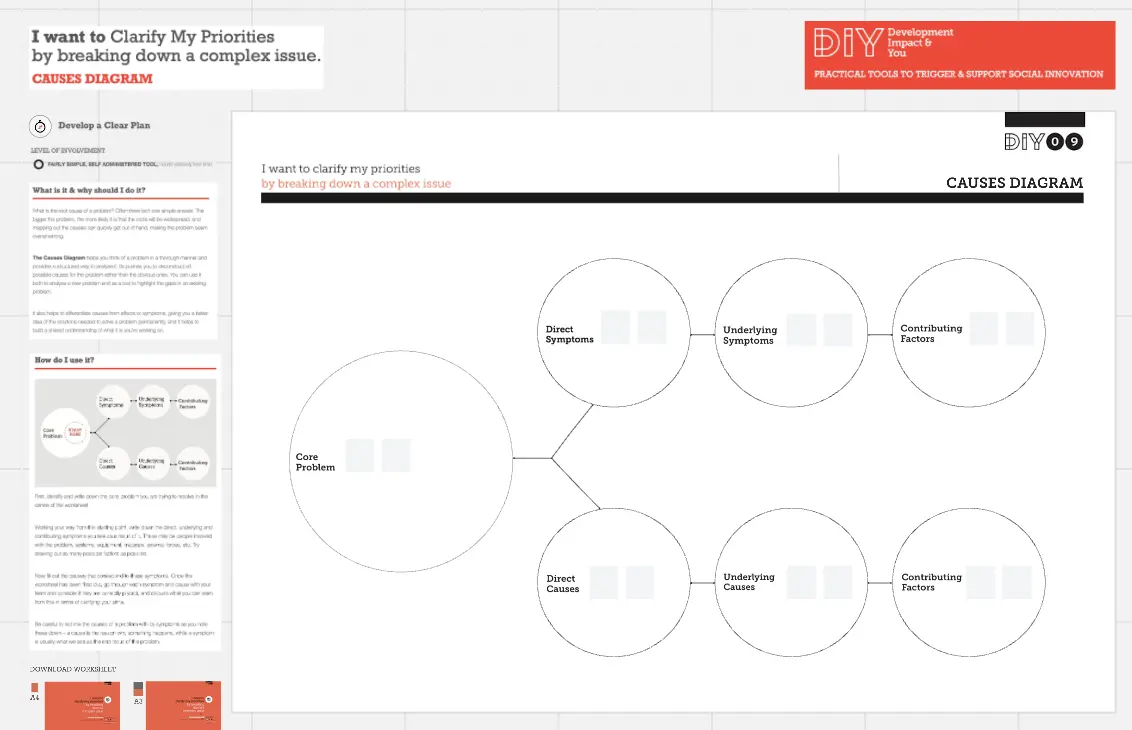
Venn Diagram for Non-Fiction Books
4 likes17 uses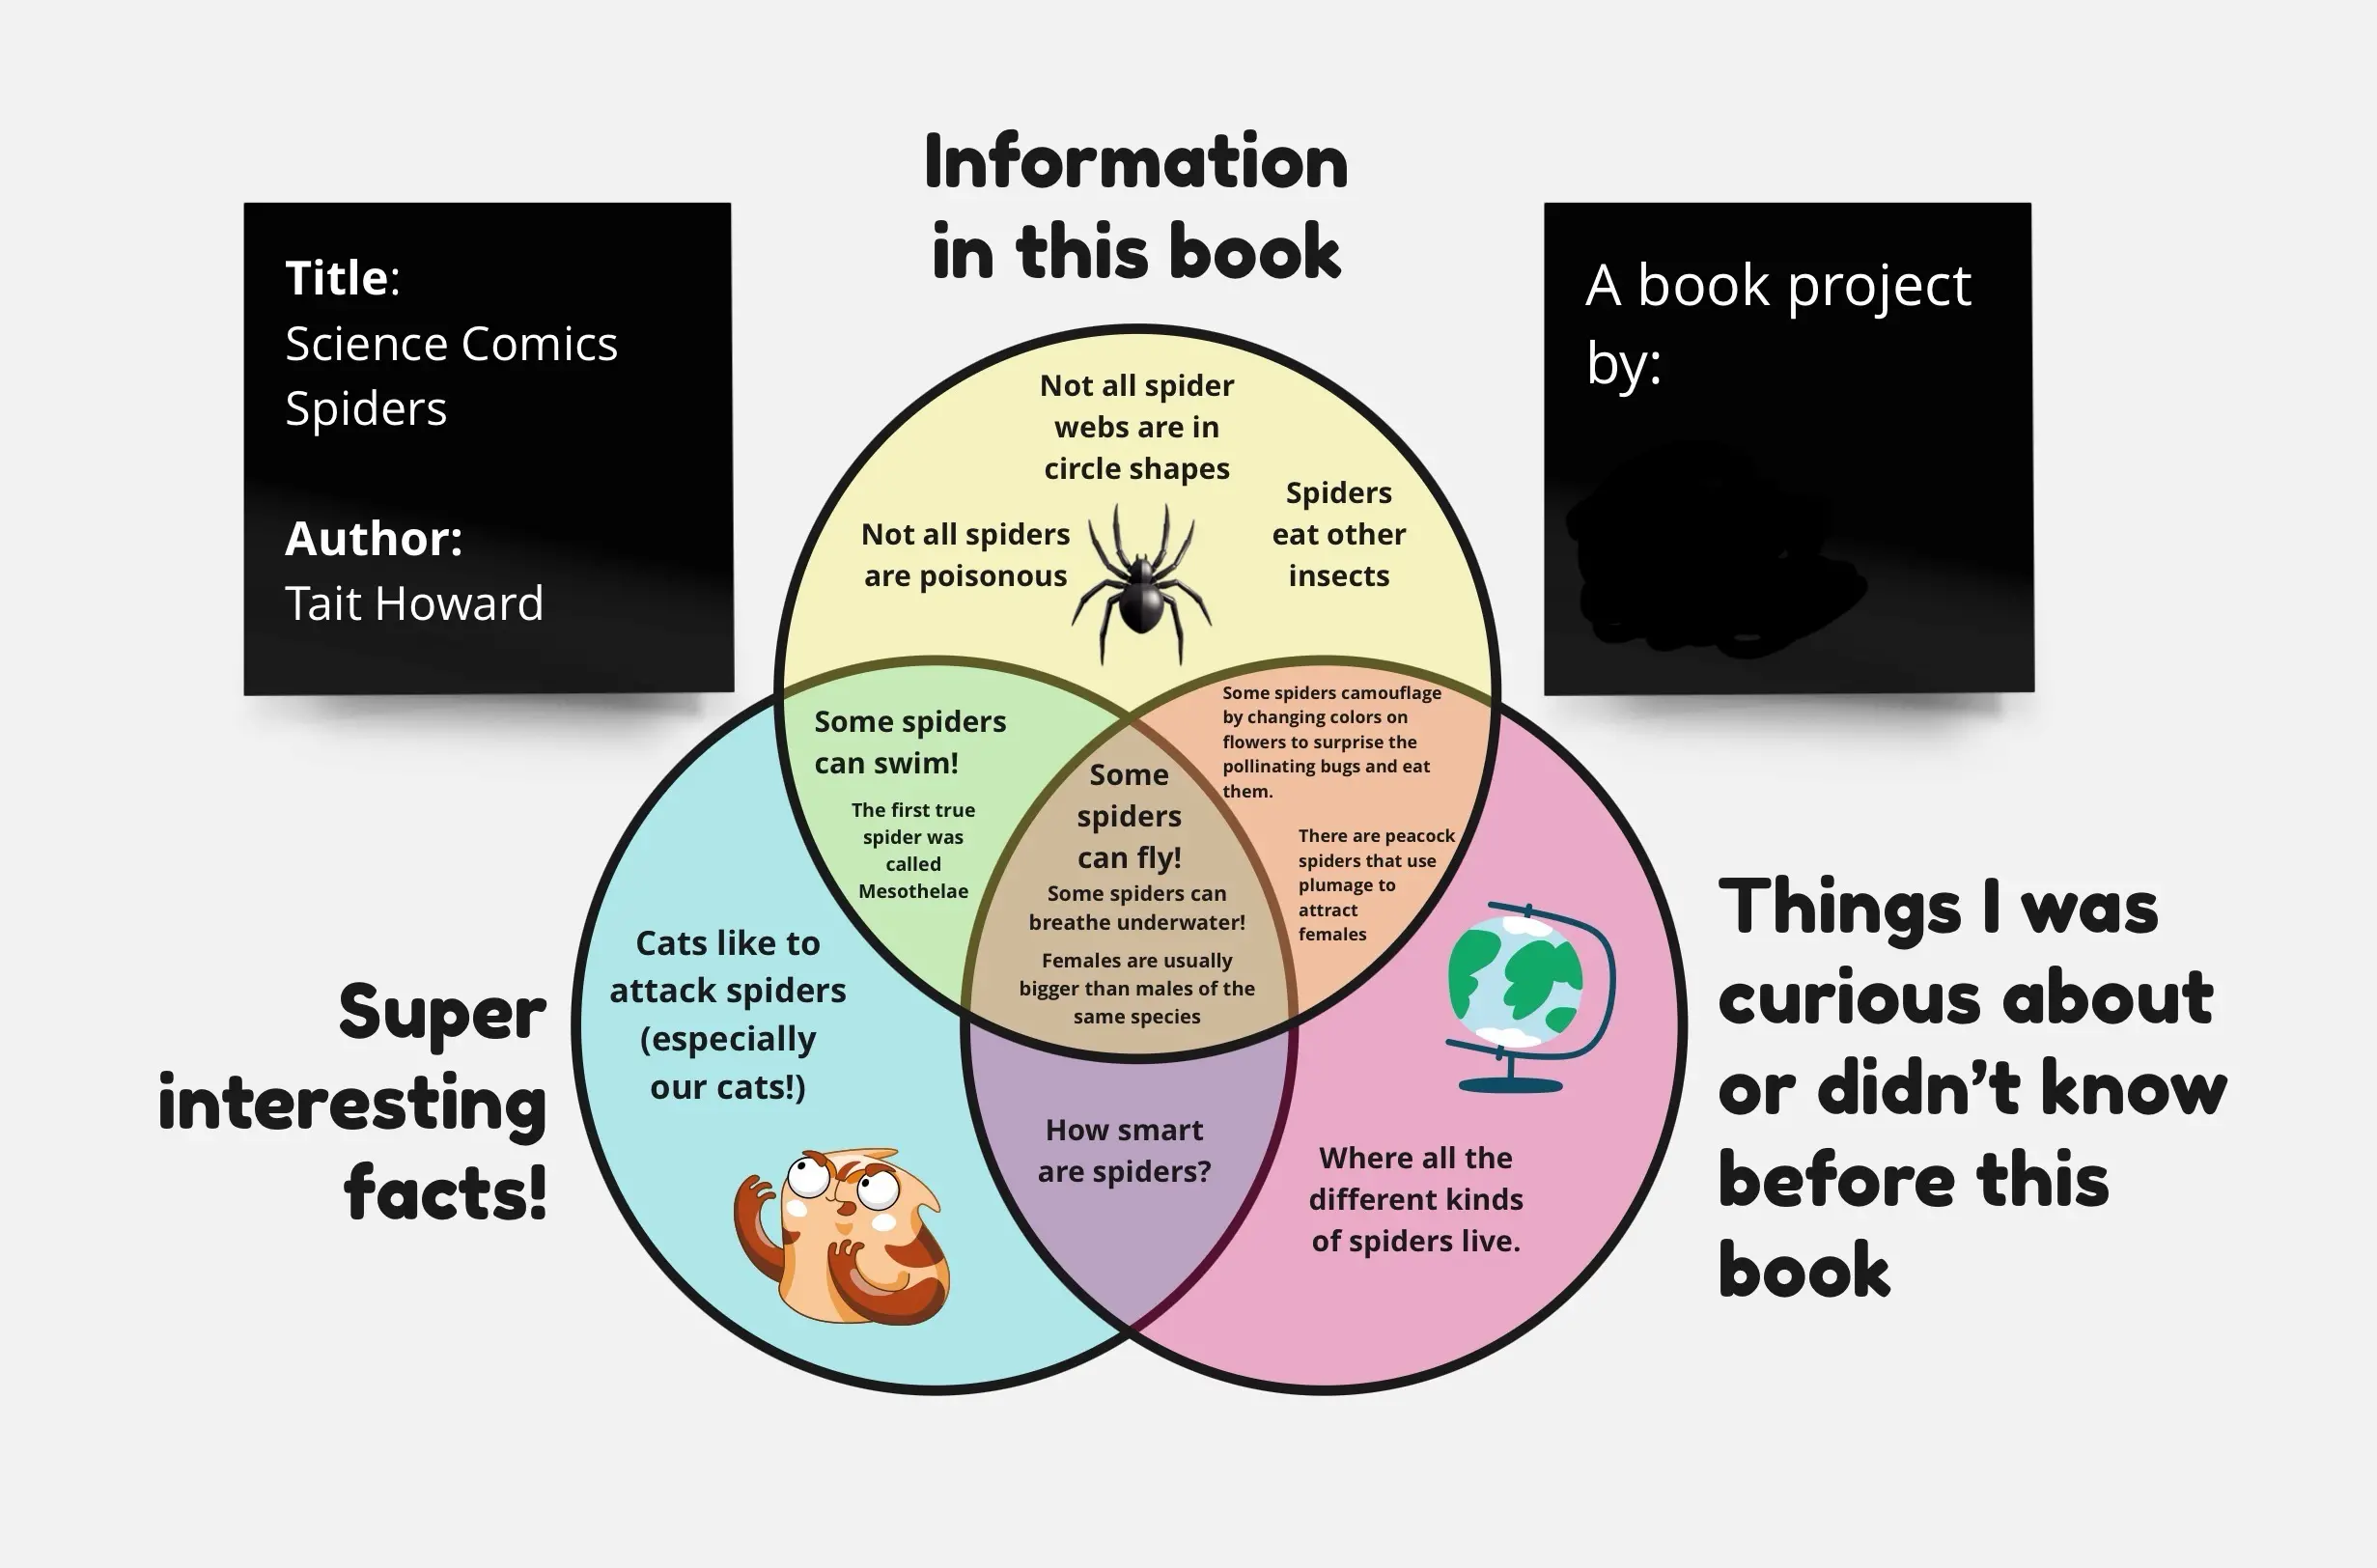
Fishbone Diagram for Root Cause Analysis
19 likes107 uses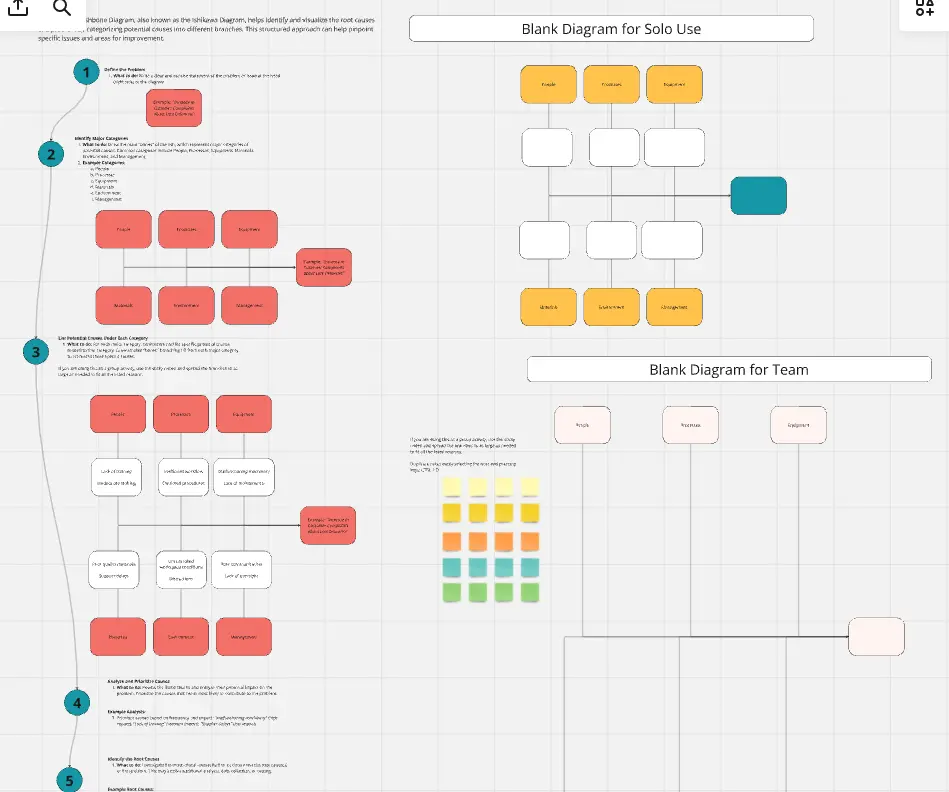
Enterprise Orbit - Diagram
0 likes0 uses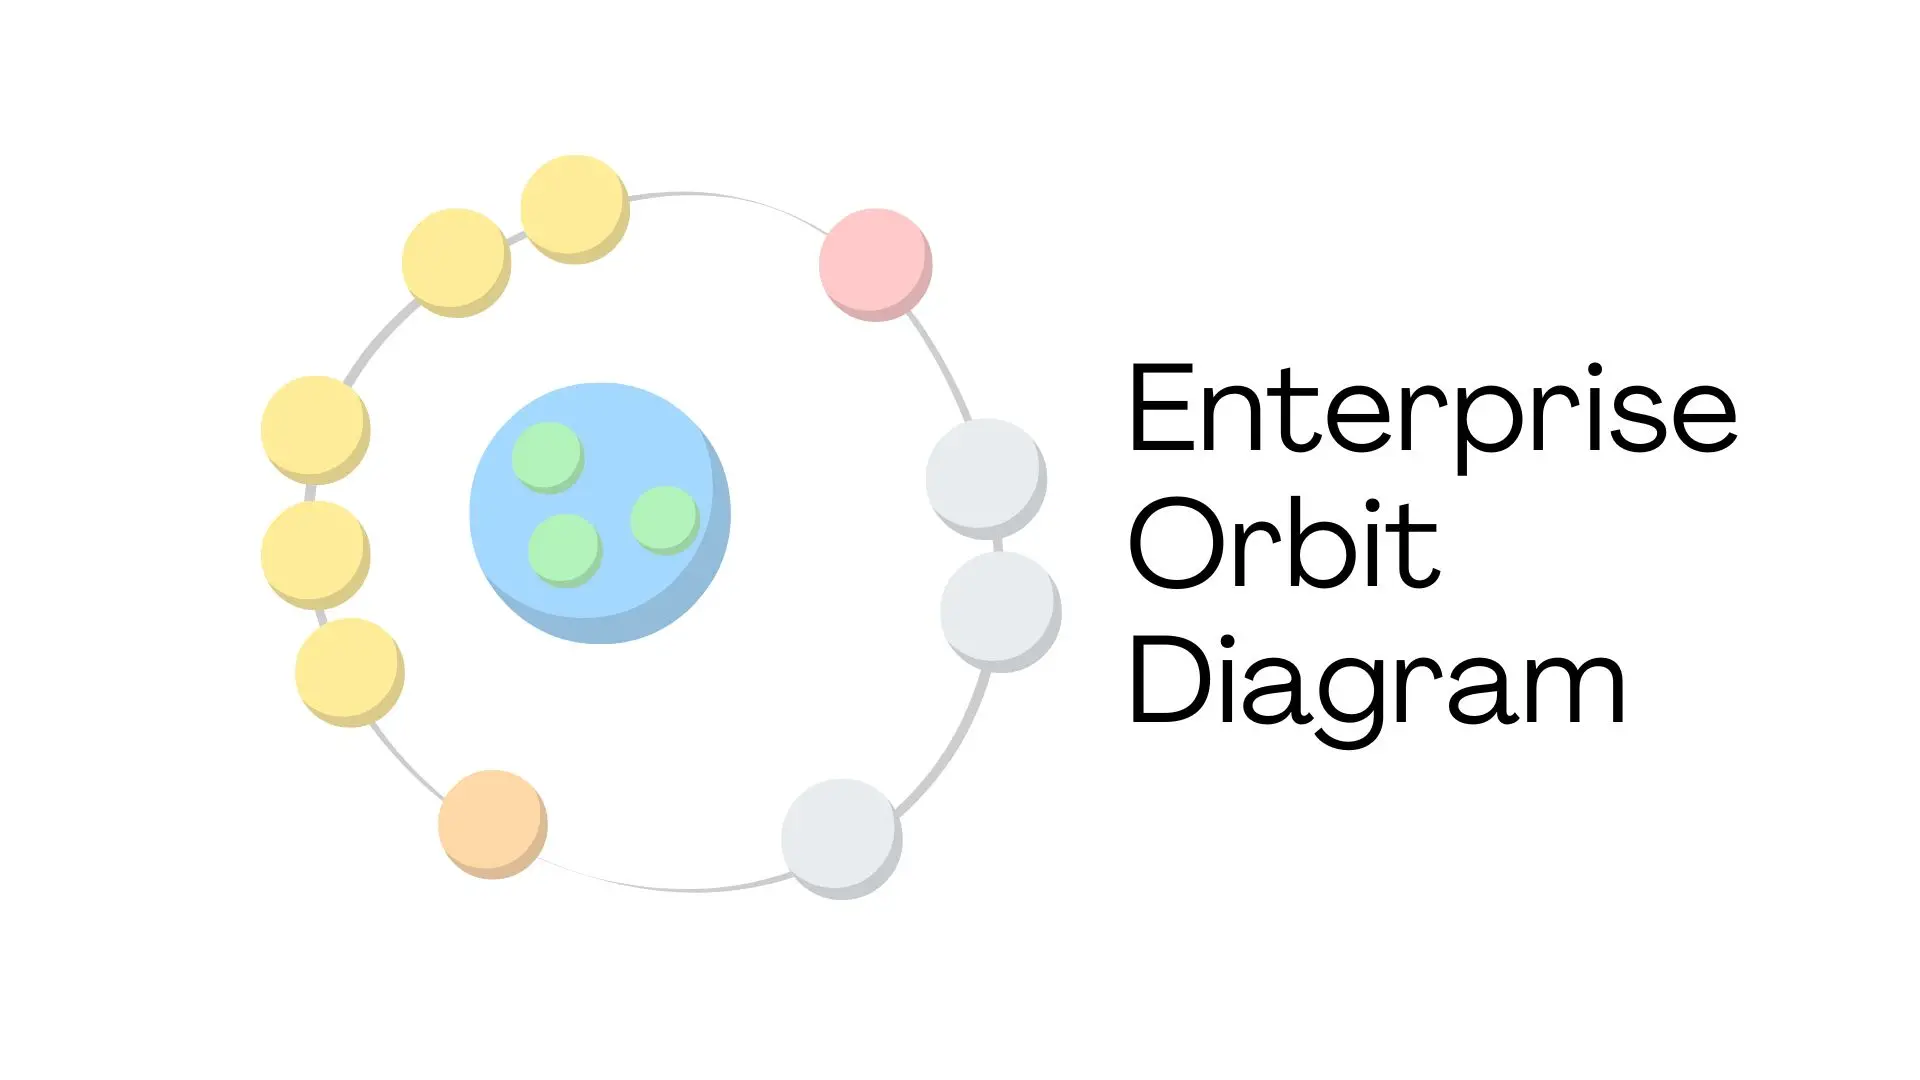
Fishbone Diagram for Product Development
13 likes197 uses