Event Planning Gantt Chart
A comprehensive project management tool designed to visualize and track all phases of event planning from initial concept through post-event activities. This template enables teams to monitor task progress, manage dependencies, and ensure timely execution of deliverables across multiple platforms and stakeholders.
Structure
Header Information
Project Title
Company Name
Project Manager
Project Start Date
Core Task Fields
Each task entry captures:
Task/Activity: Specific action or deliverable
Start Date: Task initiation date
End Date: Task completion date
Status: Completed, In Progress, or Not Started
Platform/Tool: Software or service used
Notes: Additional context, deliverables, or requirements
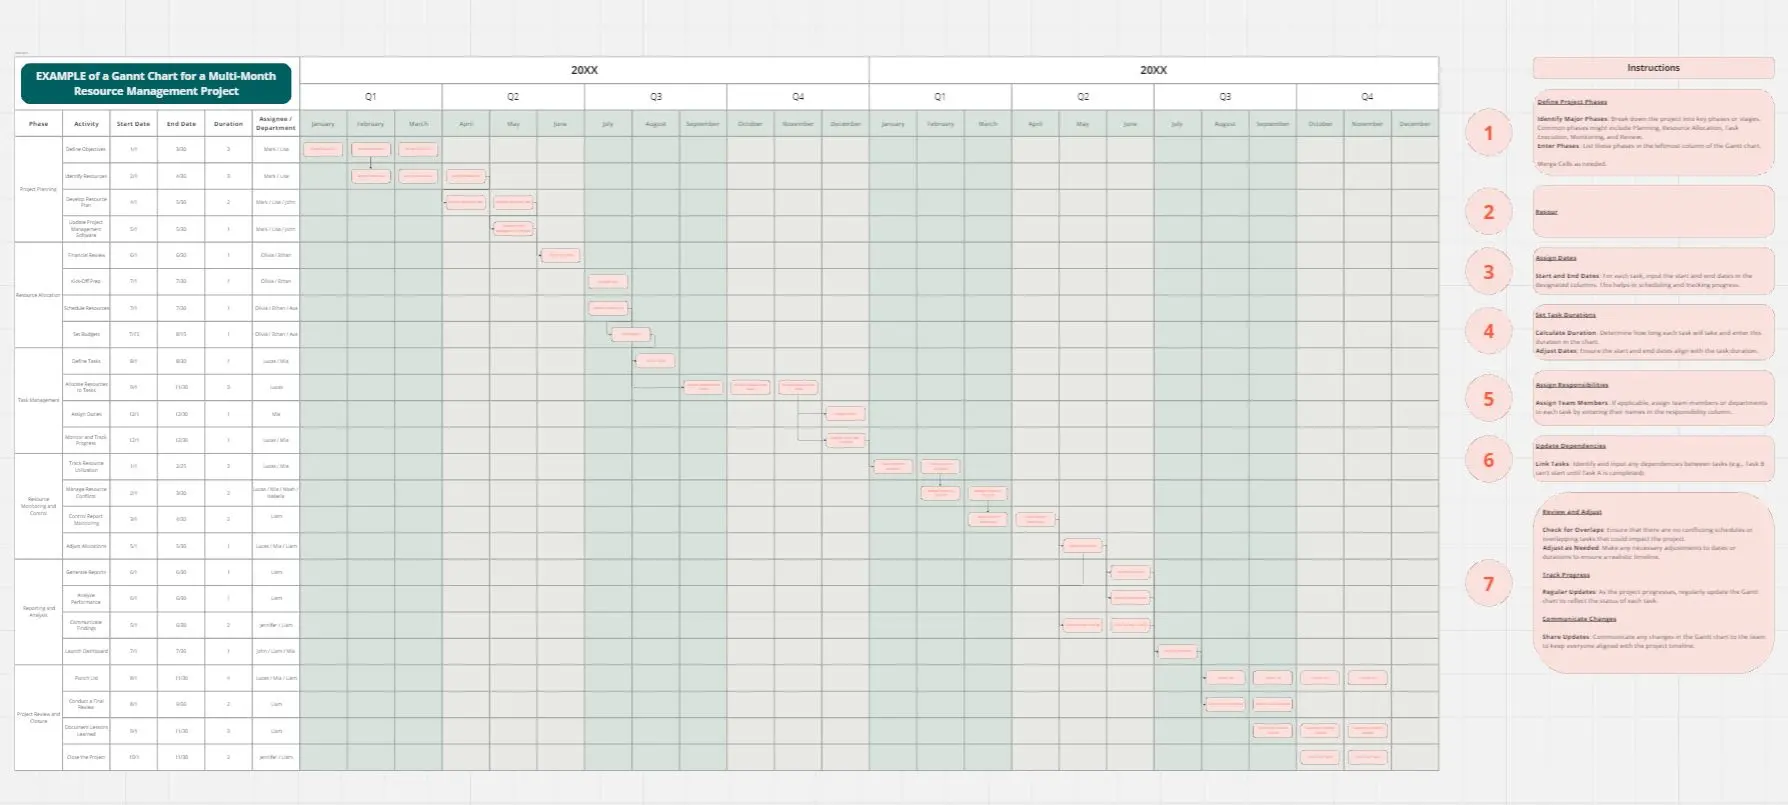
Task Categories
Planning & Strategy: Initial project setup including concept definition, budget approval, and platform selection
Content Development: Agenda creation, speaker recruitment, and marketing materials development
Marketing & Promotion: Social media campaigns, email marketing, website launch, and registration setup
Event Preparation: Speaker coordination, technical rehearsals, attendee communications, and final platform configuration
Event Execution: Day-of coordination and real-time management
Post-Event Activities: Survey distribution, content distribution, analytics review, follow-up communications, and final debrief
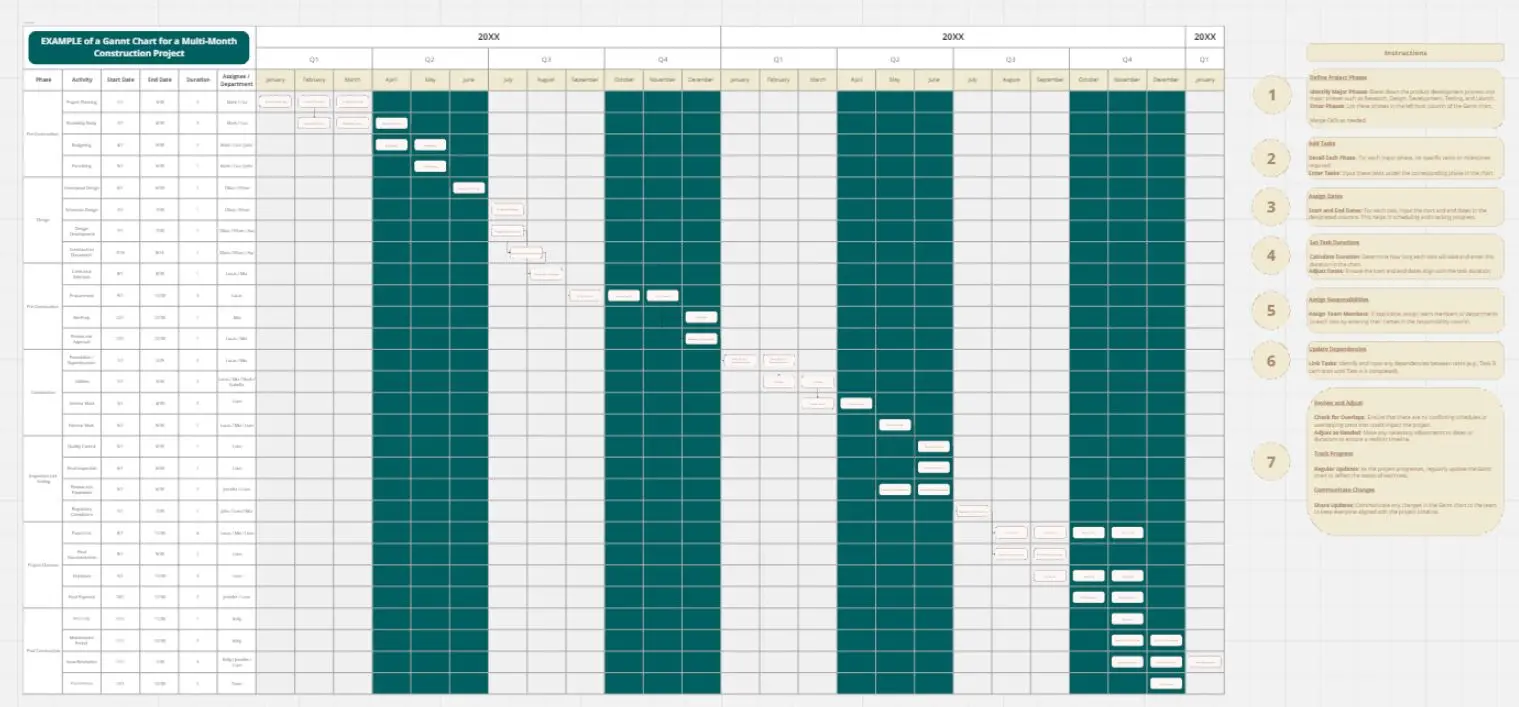
Timeline Generation Flow
Step 1: Data Collection: Gather all tasks with start dates, end dates, and current status
Step 2: Timeline Calculation: Identify the earliest start date and latest end date to determine the overall project span
Step 3: Task Positioning: Place each task on the timeline based on its start and end dates, creating horizontal bars representing task duration
Step 4: Milestone Marking: Add visual markers for critical phases including completed tasks, in-progress activities, upcoming work, event day, and post-event period
Step 5: Status Visualization: Apply color coding or indicators to distinguish between completed, in-progress, and not-started tasks
Step 6: Chronological Display: Arrange tasks in sequential order with overlapping activities shown simultaneously to identify resource conflicts and dependencies
Cheers!
Khawaja Rizwan