Gantt Chart With Dependencies
Description
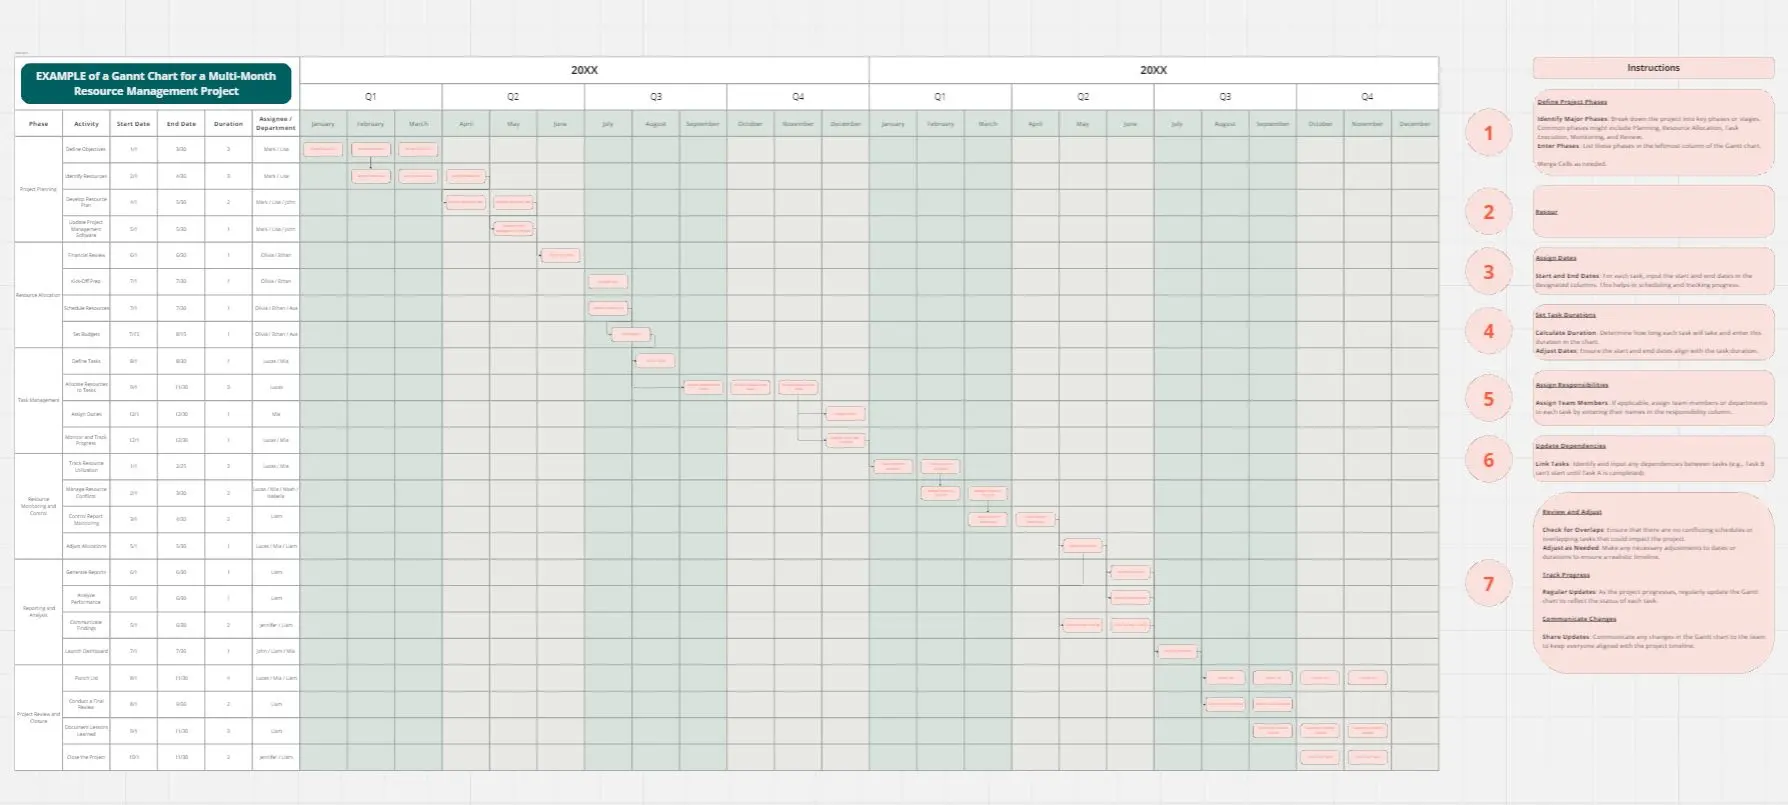
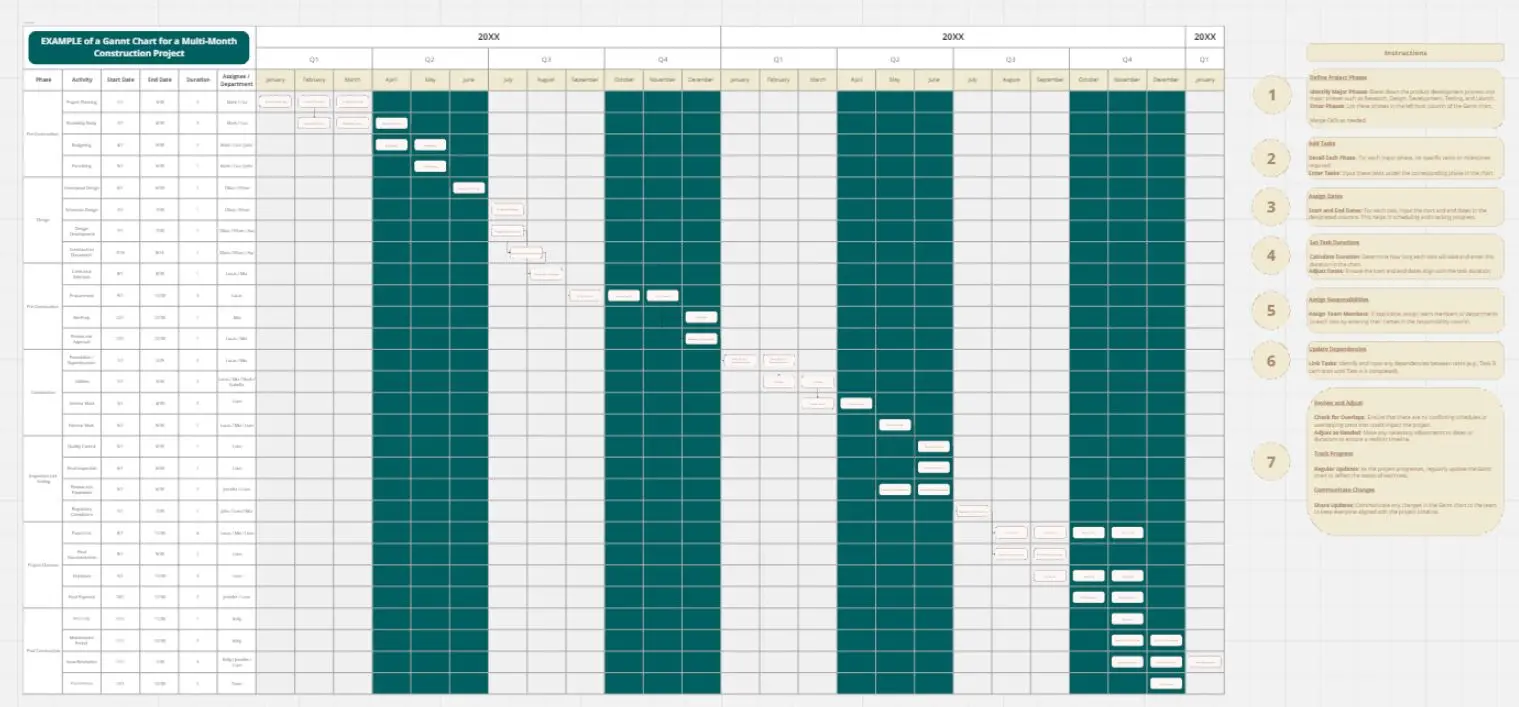
This Gantt chart visualizes a software development project timeline with task dependencies, enabling teams to track progress and manage sequenced work across four major phases.
Purpose
The chart tracks 23 interconnected tasks spanning from Project Initiation through Testing & Deployment, showing start dates, end dates, durations, completion percentages, and critical task dependencies that determine execution order.
Key Usage
Project Tracking: Monitor real-time progress with completion percentages for each task. Currently, Project Initiation is 100% complete, Design Phase at 90%, Development Phase at 60%, with Testing & Deployment Phase not yet started.
Dependency Management: Dependencies ensure tasks execute in proper sequence. For example, Unit Testing (Task 4.1) cannot begin until Development Complete (Task 3.6) finishes, and Go-Live (Task 4.5) requires both User Acceptance Testing and Deployment Preparation to complete first.
Timeline Visualization: View the entire project timeline from February 2026 through August 2026, identifying critical milestones including Project Plan Approval, Design Review, Development Complete, and Go-Live.
Generating the Timeline
The timeline was created using a flow prompt automation. Users input structured task data including Task ID, Task Description, Start Date, End Date, Duration, Dependency references, and Completion percentage. Running the flow prompt automatically generates the gantt chart visualization, eliminating manual charting work and ensuring accuracy.
Best Practices
Update completion percentages regularly to maintain accurate project status
Review dependencies when adjusting task schedules to prevent conflicts
Use the flow prompt to regenerate the timeline whenever task data changes
Monitor critical path tasks that have dependent tasks waiting on their completion
Cheers!
Khawaja Rizwan