Table of contents
Table of contents
25+ product metrics to start tracking
Summary
In this guide, you will learn:
- What product metrics are and how they differ from KPIs and OKRs
- Why product metrics matter for driving growth, customer satisfaction, and strategic alignment
- The key categories of product metrics, including acquisition, conversion, engagement, retention, customer-centric, financial, feedback, and operational metrics
- Best practices for choosing, managing, and analyzing product metrics, including identifying your North Star Metric
- How tools like Miro, Mixpanel, and Google Analytics help teams track, visualize, and act on product performance data
- Real-world examples of how companies use product metrics to improve retention, boost revenue, and prioritize KPIs
Collaborative AI Workflows
Join thousands of teams using Miro to build the right thing, faster.
Choosing which product metrics to track isn’t always straightforward. Too many teams get lost in vanity numbers, measure the wrong things, or struggle to connect data to real outcomes. Without the right focus, it’s easy to miss early warning signs, misjudge customer satisfaction, or waste time on low-impact work.
Tracking the right product metrics can transform how you understand, manage, and grow your products. These metrics offer valuable insights into performance, customer satisfaction, and financial health, helping teams make informed decisions. Whether you’re exploring product management KPIs for the first time or looking to refine your current approach, this guide will provide the clarity and tools you need.
Whether you’re new to product KPIs, or refining your current approach, this guide provides the clarity and tools you need.
What are product metrics?
Product metrics are measurable data points that provide insights into a product’s performance, success, and customer impact. They answer critical questions like, “How well is the product meeting user needs?” and “Is the product delivering value to the business?”
By focusing on product-led growth metrics, teams can set goals, evaluate progress, and make informed decisions to enhance both user experience and market impact.
KPIs vs. Metrics vs. OKRs
Not all measures of success are the same, and mixing them up can lead to confusion. Product teams often hear terms like metrics, KPIs, and OKRs used interchangeably, but all product analytics metrics play a distinct role:
- Metrics track raw measurements of specific activities or processes. For example, an eCommerce product might track website traffic as a metric, such as daily active users or website traffic. They show what’s happening. It’s useful, but on its own doesn’t tell you whether the business is succeeding.
- Key Performance Indicators (KPIs) are the most important metrics tied directly to business or product goals. Conversion rate is a KPI because it shows how effectively visitors are becoming customers which isdirectly linked to business outcomes. In short: every KPI is a metric, but not every metric is a KPI.
- Objectives and Key Results (OKRs) go a step higher. An OKR sets a bold objective (enhance user engagement in our mobile app) and links it to measurable results (increase daily active users by 20%). Unlike KPIs, OKRs are usually set for a defined period (often quarterly) and encourage ambitious, stretch goals.
Think of it this way:
- Metrics = the raw data points
- KPIs = the critical signals of ongoing performance
- OKRs = the destination and milestones for where you want to go
Understanding the difference helps teams avoid chasing numbers for the sake of it. Instead, you can connect the right metrics to clear KPIs and align them with OKRs that reflect your strategy. This layered approach ensures that what you measure ties directly to how your product creates value.
Product management KPIs
Product management KPIs (Key Performance Indicators) are specific metrics that align with broader business goals. They act as benchmarks for success, helping product teams evaluate performance and focus on what matters most.
For example, a KPI might track how quickly users complete a task in your product or measure revenue growth over a specific period. These KPIs ensure that every team member stays aligned with strategic priorities and helps gauge the overall health of a product.
Why do product metrics matter?
Measuring product success isn’t as simple as tracking downloads or page views. Too often, teams fall into the trap of chasing vanity metrics, drowning in data that looks impressive but offers little guidance. Without focus, it’s easy to miss early warning signs, misjudge customer satisfaction, or waste time on work that doesn’t move the needle.
The right product adoption metrics change that. They provide clarity on how your product is performing, where users find value, and where friction slows them down. Metrics connect teams around a shared view of progress, making it easier to prioritize features, improve user experience, and link daily decisions to business outcomes.
When tracked consistently, product metrics help you:
- Spot risks and opportunities early
- Validate whether your product is delivering value
- Align cross-functional teams on what matters most
- Measure progress against goals and inform strategy
Product success metrics
Product success metrics gauge how well a product meets its goals and serves its users. Here are some critical categories:
Customer satisfaction
Metrics like Customer Satisfaction Score (CSAT) and Net Promoter Score (NPS) show how users feel about your product. A high score often reflects strong product value and a loyal customer base.
Market share
Market share measures your product’s share of the overall market compared to competitors. Growing market share is a key indicator of success.
Adoption rate
The adoption rate reveals the percentage of users who are embracing your product or specific features. A high rate suggests strong product-market fit. Product analytics metrics help assess ROI on new features and prioritize future development.
Acquisition metrics
Acquisition metrics measure how effectively you attract new users or customers to your product. They highlight the efficiency of marketing and sales efforts.
Customer acquisition cost (CAC)
CAC measures the total cost of acquiring a new customer, including marketing, sales, and overhead. Keeping CAC low while growing revenue is crucial for long-term success.

Cost per acquisition (CPA)
The cost of acquiring a customer or lead through a single campaign or channel. Useful for comparing performance across campaigns.
Bounce rate
The percentage of users who leave after one interaction or page view. A high bounce rate can signal poor targeting or onboarding issues.
Conversion metrics
Conversion metrics track how well your product turns interest into action, from sign-ups to purchases. They reveal friction points in the user journey.
Conversion rate (CVR)
The percentage of users who complete a desired action, such as signing up or upgrading to a paid plan. A higher CVR reflects effective design and messaging.
Time to first value (TTFV)
How quickly a new user experiences value from your product. Shorter TTFV leads to stronger engagement and higher retention.
Conversion funnel drop-off rate
Shows where users abandon multi-step processes (e.g., checkout or onboarding). Helps identify points of friction to improve flow.
Product engagement metrics
Engagement metrics reveal how frequently and deeply users interact with your product. By tracking patterns of usage over time, these metrics show whether your product is becoming part of users’ routines and highlight opportunities to refine the experience for stronger, sustained adoption.
Usage rate
Usage rate tracks how often customers use your product or its features. Consistent usage often signals that the product is solving key pain points.
Daily active users (DAU) / monthly active users (MAU)
The number of unique users who engage daily or monthly. DAU/MAU ratios highlight stickiness and long-term engagement.
Session duration
The average amount of time users spend per session. Longer sessions can indicate value, though context matters by product type.
Session frequency
How often users return within a given time frame. High frequency signals strong product relevance and habit formation.
Retention and satisfaction metrics
These metrics measure how well you keep customers and how satisfied they are with your product. Retention and satisfaction metrics show how customers interact with your product over time and whether they continue to find value in it.
They are strong indicators of loyalty and long-term value, helping teams understand user behavior, refine strategies, and strengthen long-term relationships.
Retention rate
Retention rate measures how many customers continue using your product over time. High retention shows that users find long-term value in your offering.
Churn rate
Churn rate is the opposite of retention—it shows how many customers stop using your product. Reducing churn is vital for sustained growth.
Net promoter score (NPS)
NPS measures customer loyalty by asking users how likely they are to recommend your product. A high NPS often correlates with long-term growth, reflecting strong satisfaction and loyalty.
Customer satisfaction score (CSAT)
CSAT measures user satisfaction with a specific product or interaction, often through post-use surveys.

Customer effort score (CES)
CES gauges customer satisfaction with specific interactions or product experiences. It evaluates how easy it is for users to complete a task or resolve an issue. Lower effort correlates with better experiences and retention. Tracking CSAT helps identify areas for improvement.
Financial metrics for product teams
Financial metrics assess the revenue and profitability impact of your product. They help teams balance growth goals with sustainability.. Key financial metrics include:
Revenue growth
Revenue growth shows whether your product is driving more income over time. It’s a direct measure of business impact.
Profit margins
Profit margins reflect how efficiently your product generates revenue compared to costs. Strong margins indicate operational effectiveness.
Monthly recurring revenue (MRR) / annual recurring revenue (ARR)
Predictable recurring revenue from subscriptions or contracts. Key for SaaS and other recurring models.
Lifetime value (LTV/CLV)
The projected revenue a customer generates during their relationship with your product. Often used alongside CAC to measure ROI.
Average revenue per user (ARPU)
The average revenue earned per active user. Useful for comparing monetization strategies.
Feedback and optimization metrics
Feedback metrics capture input directly from customers and highlight areas for product improvement. They ensure development stays customer-led.
Feature request tracking
This system tracks which features are being requested, helping prioritize the roadmap.
User feedback volume
The number of feedback submissions collected across channels. Higher volumes can indicate engagement but may also highlight friction.
Customer sentiment score
An aggregate measure of user sentiment, often captured through surveys, reviews, or sentiment analysis tools.
Escalation rate
The percentage of support issues that need to be escalated to higher tiers. High escalation rates can signal usability or quality concerns.
Operational metrics for product teams
Operational metrics focus on the efficiency of product development and delivery. These include:
Time to market
Time to market tracks how quickly a product or feature moves from concept to launch. Faster times often give a competitive edge.
Development cycle time
Cycle time measures the speed of your development process. Reducing cycle time can improve agility and responsiveness.
Managing product data effectively
Tracking product metrics is only valuable if your team can access, share, and act on the data. Scattered reports or complex spreadsheets often create confusion instead of clarity. By managing your data well, you make metrics easier to understand and more impactful for everyone.
Centralize your data
When data lives in multiple tools or documents, it’s hard to get a consistent view of product performance. With Miro, you can bring research, dashboards, and insights into one shared workspace, reducing confusion and ensuring every team works from the same source of truth.
Share your data
Metrics shouldn’t be locked away with analysts or leadership. Miro makes it easy to give everyone visibility, whether it’s product managers, designers, or engineers, so cross-functional teams can make faster, smarter, data-driven decisions.
Visualize your data
Numbers alone can be overwhelming. Miro helps you turn raw data into clear, collaborative visuals, whether it’s adoption trends, churn rates, or customer satisfaction scores. These visualizations make insights actionable for everyone, not just data specialists.
Turning product metrics into actionable insights
Collecting data is only the first step. Once your data is centralized and accessible, the next step is extracting insight. How you analyze it determines whether it drives real impact—turning raw numbers into direction and helping you understand performance, refine your strategy, and make better decisions.
To turn metrics into actionable insights:
- Define your goals: Start with clear objectives, such as increasing retention or reducing churn.
- Compare against benchmarks: Use industry standards or past performance to gauge success.
- Look for patterns: Analyze trends over time to identify strengths and weaknesses. With Miro AI, you can take this further by clustering feedback, summarizing research data, and highlighting anomalies, giving you quicker, clearer insights to act on.
- Prioritize action: Focus on metrics that align with business priorities and user needs.
Pro Tip: Miro's Product Metrics & Analytics Template makes it easy to get started.
Find tools for tracking metrics
Monitoring product metrics is easier with the right tools. Here are a few that stand out:
Miro
Miro’s innovation workspace includes powerful visualization tools for tracking product performance metrics. Teams can map out KPIs and collaborate in real time.
Mixpanel
Mixpanel specializes in tracking user behavior, providing detailed insights into how customers interact with your product.
Google Analytics
Google Analytics offers robust tracking for web and app performance, helping teams measure traffic, conversions, and engagement.
Apply best practices for product performance metrics
Effective KPIs start with thoughtful planning. Follow these best practices:
Align KPIs with goals
Ensure every KPI ties directly to your business and product objectives. Misaligned metrics can waste time and resources.
Keep it simple
Focus on a few impactful KPIs instead of overwhelming your team with too many metrics.
Revisit regularly
Regularly review KPIs to ensure they remain relevant as goals evolve.
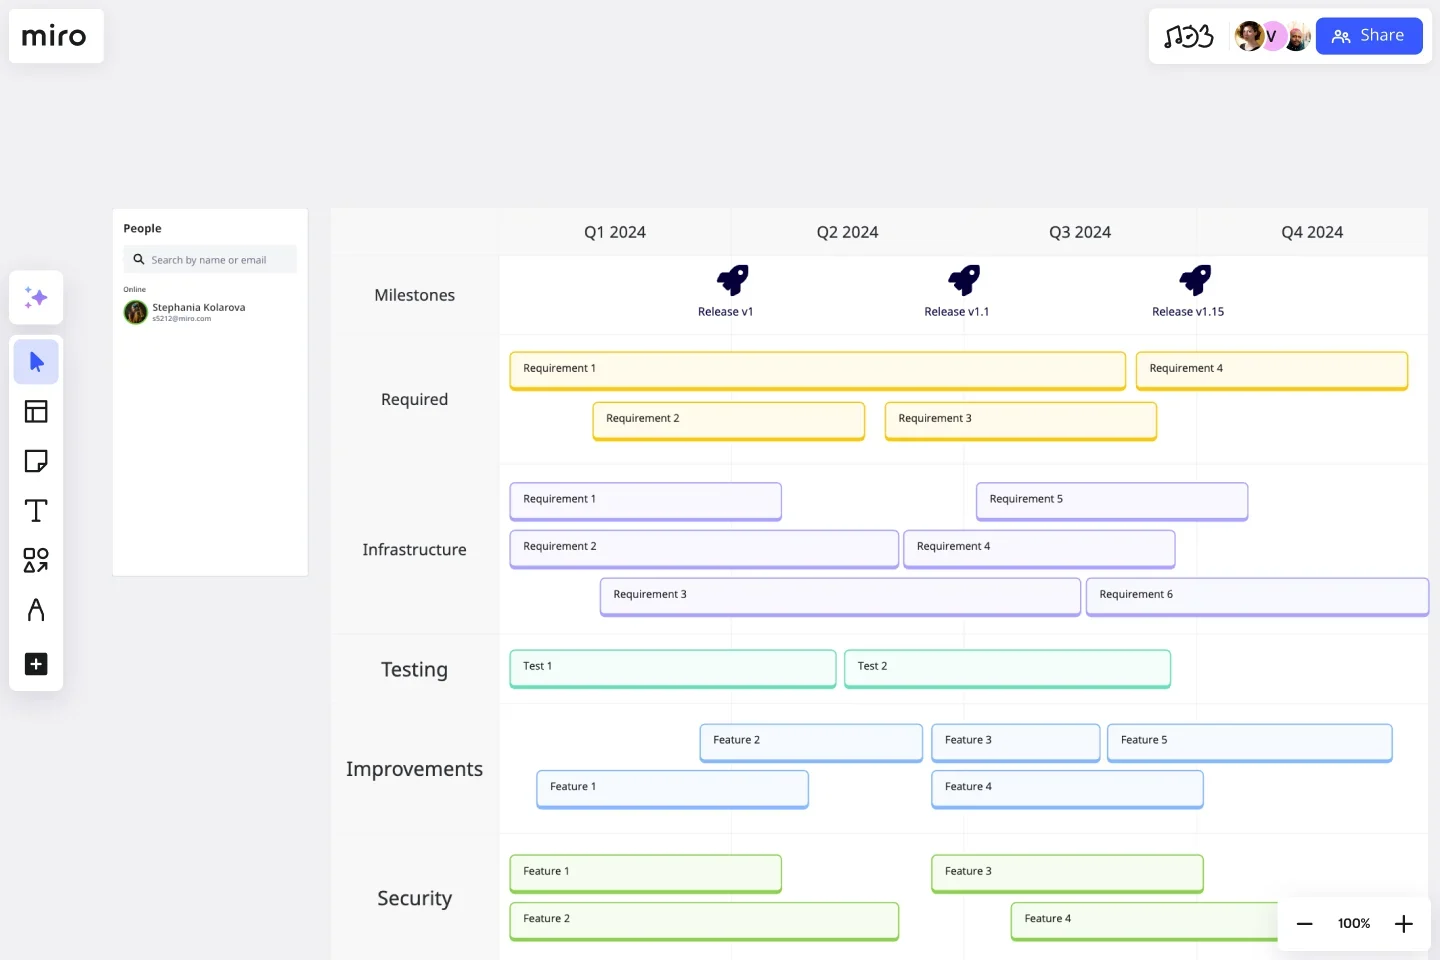
Define your North Star Metric
Among all the metrics you track, one should rise above the rest: the North Star Metric (NSM). This is the measure that reflects the core value your product delivers to customers. For a streaming service, it might be hours watched per user. For a marketplace, it could be completed transactions.
Supporting metrics like churn, feature adoption, or revenue growth help explain progress toward the NSM, but the North Star keeps teams focused on what matters most, delivering value that drives long-term success.
Real-world examples of product metrics
Understanding how other companies succeed with product metrics can inspire and inform your own strategies. Here are two examples of metrics in action:
Sharpist streamlines KPI prioritization with Miro
Learning platform Sharpist used Miro to align stakeholders around the most important KPIs. Ahead of a board strategy session, members added sticky notes with the metrics they wanted to track over the next three and six months. Using dot voting, the group quickly narrowed down the top priorities.
This example shows how Miro supports prioritization metrics and KPI alignment. Instead of long debates, teams can visualize input, run structured votes, and agree on the metrics that matter most. The result: clearer priorities and faster alignment across leadership.
“We love using Miro,” Sharpist’s CEO and co-founder Hendrik Schriefer said. “We can show respect for each other’s time and resources by aligning on meeting expectations and shared goals, getting ownership on cross-team topics, as well as sharing knowledge to help one another grow.”
Visualize product metrics in Miro
Tracking product metrics doesn’t have to be complicated. Miro’s innovation workspace provides intuitive tools for visualizing data, collaborating with teams, and gaining actionable insights. Whether you’re tracking product management KPIs or monitoring product performance metrics, Miro keeps everything in one place.
Product Metric FAQs
What is the most important product metric to track?
There’s no single “universal” metric that works for every product. The right one depends on your goals, business model, and customer needs. Many teams use a North Star Metric (NSM), a measure that reflects the core value your product delivers to users.
Supporting metrics (like adoption, retention, or revenue) then explain what drives progress toward that North Star.
How many product metrics should I track at once?
It’s easy to get lost in a sea of numbers. Instead of tracking dozens of metrics, focus on a small set of core KPIs that map directly to your product goals. These should tell you whether your product is creating value, driving growth, and meeting customer needs. Additional metrics can provide context, but if they’re not helping decision-making, they’re just noise.
What metrics should product teams avoid?
Avoid vanity metrics—numbers that look impressive but don’t reflect real product success. For example:
- Total downloads without measuring retention
- Page views without engagement or conversion context
- Social followers without tracking actual usage
These can create a false sense of progress. Instead, focus on actionable metrics that tie directly to customer outcomes and business impact.
How do I know if I’m tracking the right product metrics?
Ask yourself two questions: Does this metric measure customer value or business outcomes?and Will it influence decisions my team makes? If the answer is yes, it’s worth tracking. Metrics should always ladder up to your goals or OKRs. If they don’t, reconsider their place on your dashboard.
How often should product metrics be reviewed?
Some metrics are best checked weekly (like daily active users or conversion rates) to spot quick changes. Others, such as NPS or churn rate, reveal trends over longer periods and can be reviewed monthly or quarterly. The key is consistency, review on a regular cadence that matches your product’s pace of development.
Can product metrics be used for both physical and digital products?
Yes. While digital products often focus on metrics like DAU/MAU, churn, or feature adoption, physical products lean on quality and delivery measures like defect rate, return rate, or time-to-market. Both types of products benefit from tracking customer satisfaction, retention, and revenue metrics, just tailored to their specific context.
How does Miro help my team collaborate on product metrics?
Miro makes it easy for teams to not just view product metrics but actively collaborate on which ones matter most. For example, during a board strategy session, members were invited to add sticky notes with the KPIs they wanted to track over the next three and six months. Everyone then used dot voting to select the top priorities.
By bringing feedback, discussion, and prioritization onto one board, Miro helps teams align faster, reduce extra meetings, and ensure that the metrics you track are the ones that truly guide product success.
Can Miro handle large-scale, complex product data?
Yes. Miro’s infinite canvas and integrations are designed for scale. Whether you’re tracking a handful of KPIs or mapping hundreds of interrelated metrics across product lines, you can organize everything visually and keep teams aligned. With integrations like Jira, Asana, and Azure DevOps, your data stays connected from planning to deliver3
Sign up for Miro to get started.
Author: Miro Team
Last update: November 10, 2025