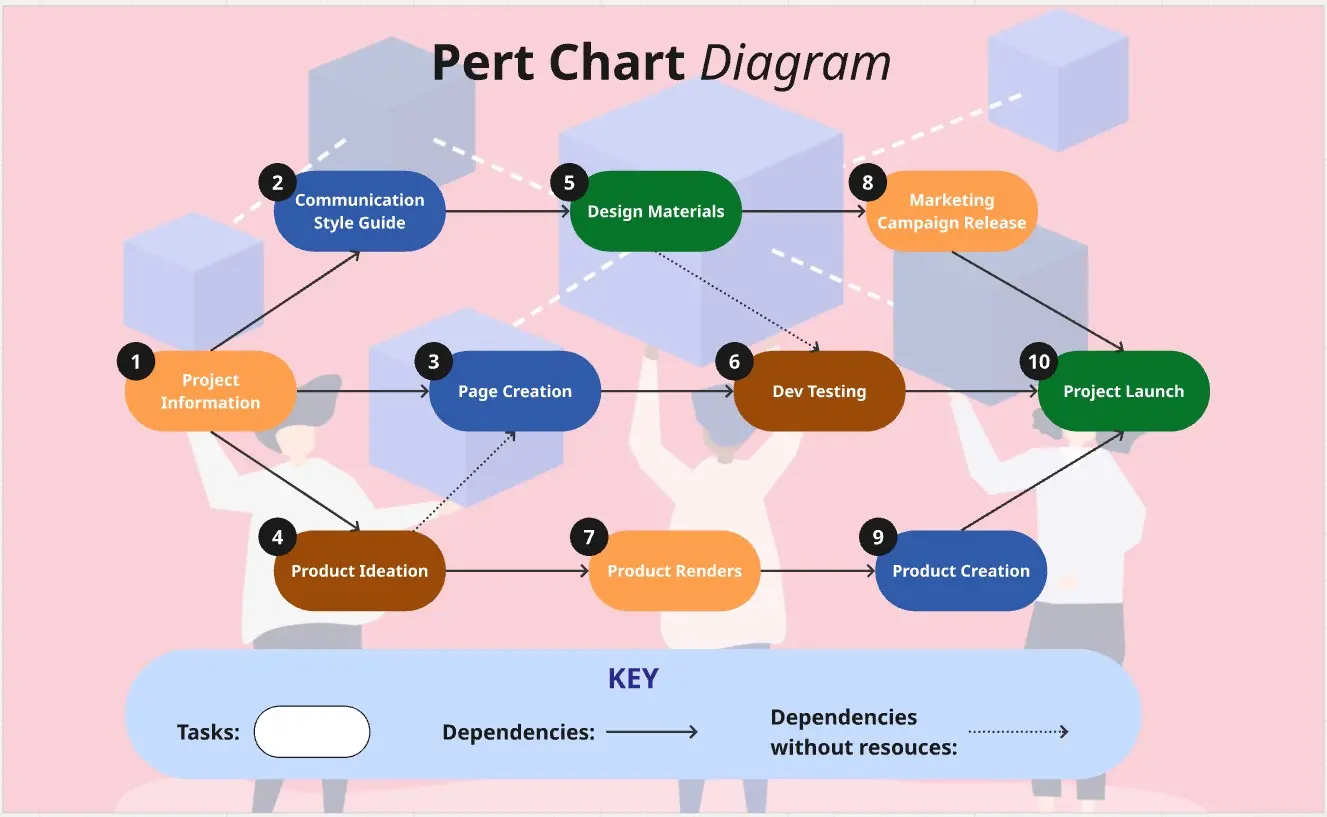
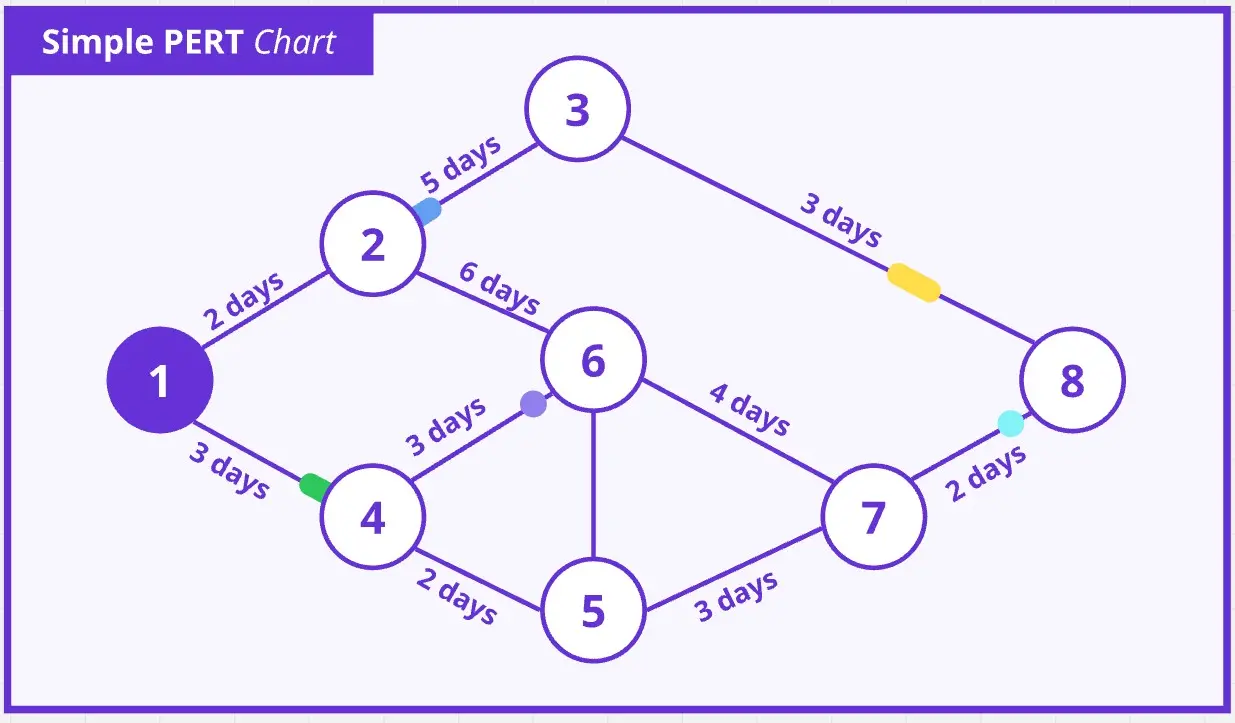
PERT Chart Event Network · ACTIVITY-ON-ARROW (AOA)
A project management template implementing the classic 1958 PERT Activity-on-Arrow (AOA) methodology for visualizing project schedules, dependencies, and critical paths. This template helps teams map milestone sequences, identify schedule bottlenecks, and calculate project duration and float.
What It Is
A PERT Event Network using the Activity-on-Arrow convention where numbered circles represent milestone events and arrows represent time-consuming activities between those events. The logic is dependency-based: a downstream event cannot occur until all incoming activities are complete. This reads as "event 2 cannot happen until activity A is done."
Purpose and Use Cases
This template is designed for project management teams who need to:
Map the sequence and dependencies of project activities
Identify the critical path (the longest chain determining overall project duration)
Calculate float/slack on non-critical paths
Optimize schedules by understanding which activities drive project completion
Ideal for engineering projects, construction planning, product launches, software releases, or any work requiring milestone sequencing and schedule optimization.
How It Works
The network contains eight numbered milestone event nodes (1–8):
Node 1 (cyan): Project start event
Nodes 2, 3, 5, 6, 7 (yellow): Critical path milestones
Node 4 (indigo): Off-critical-path event with slack
Node 8 (pink): Final project event
Activities are represented by eight labeled arrows (A–H), each with a name and duration placeholder:
Yellow/thick arrows (A, B, D, F, G, H): Critical path activities forming Path 1 (1→2→3→5→6→7→8)
Purple/thin arrows (C, E): Activities with slack forming Path 2 (1→2→4→5→6→7→8)
The two parallel paths allow concurrent work streams while maintaining dependency logic.
Key Components
Milestone Event Nodes
Activity Arrows
Directional arrows labeled A–H
Duration placeholders (__d) for time estimates
Visual weight indicates criticality (thick yellow vs thin purple)
Legend
Path Tally Panel
Calculation area to sum durations along each path
Fields for identifying critical path, total project duration, and float on shorter paths
How to Use It
Number milestone events in the order they can logically occur
Label each arrow with its activity name and estimated duration
Add parallel arrows wherever work can proceed simultaneously
Highlight the longest chain in yellow—this is your critical path
Complete the Path Tally section by summing durations per path
Calculate float by comparing path lengths
Key principle: Events carry no duration themselves—all time lives on the arrows connecting them.
Cheers!
Khawaja Rizwan