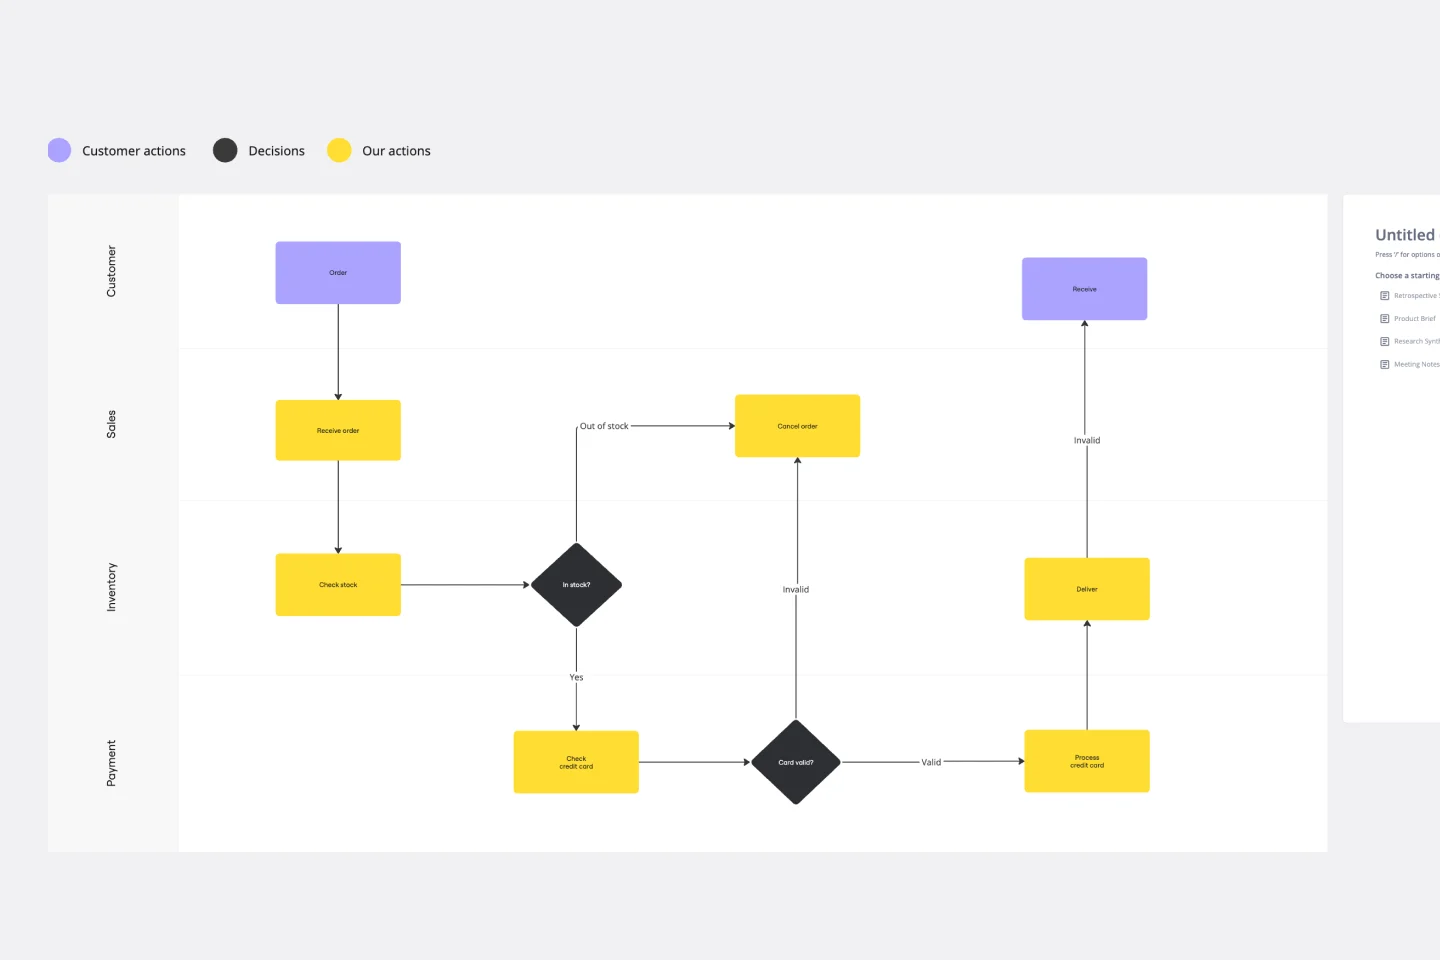
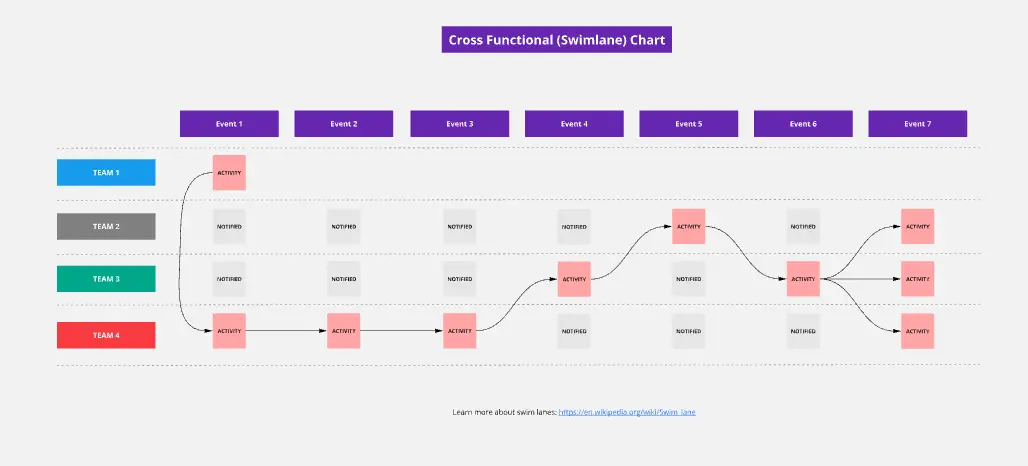
This template gives you a swim lane diagram with a legend, process step boxes, decision diamonds and a time-per-step marker, so every handoff between teams is visible.
A explanation of how to turn your step times into four numbers: Process Time, Minimum Lead Time, Maximum Lead Time, and Average Lead Time.
The board includes a template and a fully worked example, so you can see every step of the math before you try it with your own process.
Use it to find bottlenecks, show where rework adds time, and make a case for process improvement with numbers your team can check.
It works for operations, change management, Lean and Six Sigma projects, and any team that wants a shared picture of how work moves between departments.