6likes
13uses
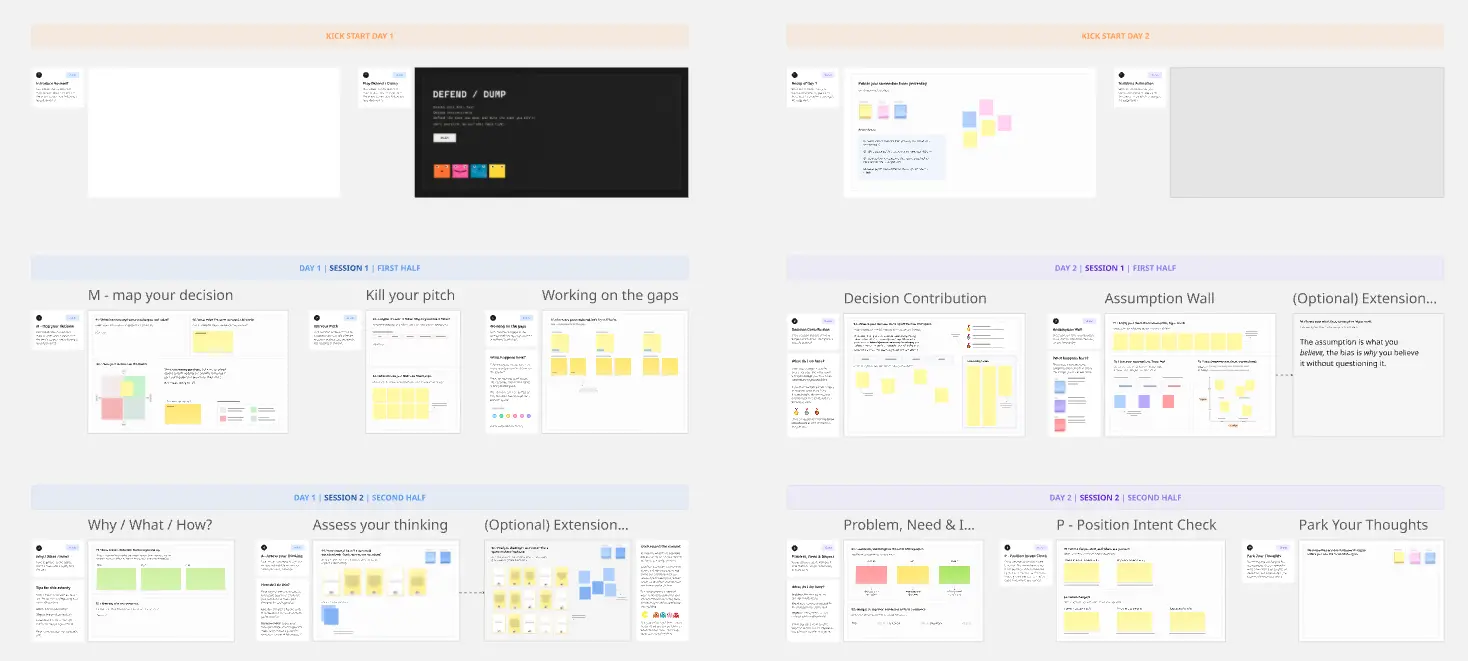
Turn scattered metrics into a clear, actionable dashboard prototype in just 40 minutes.
Can users quickly understand your dashboard's most important information and know what action to take next?
The Decision-First Dashboard Prototype Workshop helps product teams prioritize metrics, organize information, and create dashboards that support better decisions. Using Miro's wireframing components, sticky notes, and collaborative feedback tools, participants can transform complex data into a focused, low-fidelity dashboard prototype.
I designed this workshop for product managers, UI/UX designers, data analysts, startup founders, and business stakeholders who want to improve dashboard usability before investing in detailed design or development.
Duration: 40 minutes Format: Individual or collaborative, virtual or in person Best For: Dashboard design, data visualization, product analytics, business intelligence, and UX prototyping
Choose one dashboard audience and an important question they need answered. Use the provided Miro frames, editable wireframes, sticky notes, and chart components to complete the exercise.
Miro Tools: Sticky Notes and Text
Identify who will use the dashboard and what decision they need to make.
Write the target audience on one sticky note and the primary business or product question on another.
Keep the dashboard focused on answering that question.
Miro Tools: Sticky Notes and Shapes
List five potential metrics using individual sticky notes.
Sort them into two sections: Show on Dashboard and Save for Later.
Select the three metrics that provide the most useful information for the user's decision.
Miro Tools: Wireframing Library, UI Components, Shapes, Text, and Charts
Create a low-fidelity desktop dashboard containing:
Three KPI cards highlighting priority metrics
One visualization showing a performance trend
One chart displaying a meaningful comparison or breakdown
One area highlighting an insight or recommended investigation
Focus on visual hierarchy, clear labels, and logical information grouping rather than detailed styling.
Miro Tools: Frames, Comments, and Sticky Notes
Show the dashboard to another participant for five seconds, then move away from the frame.
Ask what they noticed first, which problem or opportunity stood out, and what action they would take.
Record their observations beside the prototype.
Miro Tools: Shapes, Text, Wireframing Library, and Comments
Review the feedback and identify up to three improvements.
Adjust the layout, simplify visualizations, clarify labels, or improve the visibility of key insights.
AI Tip: Ask AI to review your dashboard for information hierarchy, unnecessary metrics, confusing visualizations, and unclear next actions.
A completed, editable dashboard prototype featuring prioritized metrics, meaningful visualizations, and a clear information hierarchy.
Use the prototype to align stakeholders, validate dashboard requirements, prepare usability testing, and guide detailed product design.
1. What is a decision-first dashboard?
A decision-first dashboard is designed around the questions users need answered and the actions they may take, rather than displaying every available metric.
2. How is this different from a traditional dashboard template?
This workshop begins with the user's decision, then identifies the metrics and visualizations needed to support it. The focus is on usefulness rather than the number of charts.
3. Do I need data analytics experience?
No. Basic familiarity with the metrics relevant to your product is helpful, but advanced analytics knowledge is not required.
4. Can I use fictional data?
Yes. Sample data is useful for early prototyping. Label fictional values clearly to avoid confusing them with actual performance.
5. Why limit the dashboard to three primary metrics?
Starting with three encourages prioritization and helps prevent information overload. Additional metrics can be introduced after validating the initial design.
6. Do I need to create functional charts?
No. Editable Miro shapes, lines, and text are sufficient for illustrating trends and comparisons during this workshop.
7. What is a five-second dashboard test?
A quick usability exercise where someone views the dashboard briefly, then describes what they noticed and understood. It helps evaluate visual hierarchy and first impressions, not comprehensive usability.
8. Can I create dashboards for different audiences?
Yes. The template can support executive dashboards, product analytics, marketing performance, customer success, operations, and other use cases.
9. Can AI help with dashboard design?
Yes. AI can suggest relevant metrics, recommend visualization types, review information hierarchy, and identify potentially confusing elements. Validate its suggestions using your users' actual needs.
10. Can I complete this workshop individually?
Yes. Create the dashboard independently and ask a colleague or stakeholder to complete the interpretation test afterward.
11. What if my dashboard needs more than two charts?
Start with the two most meaningful visualizations. Expand the dashboard once the core information structure has been validated.
12. What should I do after completing the workshop?
Use your prototype to gather stakeholder feedback, validate metric definitions, confirm data availability, and prepare detailed UI designs or development requirements.
Start with the decision, not the data. A successful dashboard helps users recognize what matters, understand what is happening, and determine what to investigate next.

Deanne Watt
Product Strategy @ MiNDPOPGroup.com
My approach to product is to get to the heart of what drives a company. I am passionate about the entire end-to-end process and making it more efficient, collaborative as well as aligning teams and improving communication. We have built about 200 Miro boards so far that cover ideation, strategy, design, engineering, and even marketing promotion.