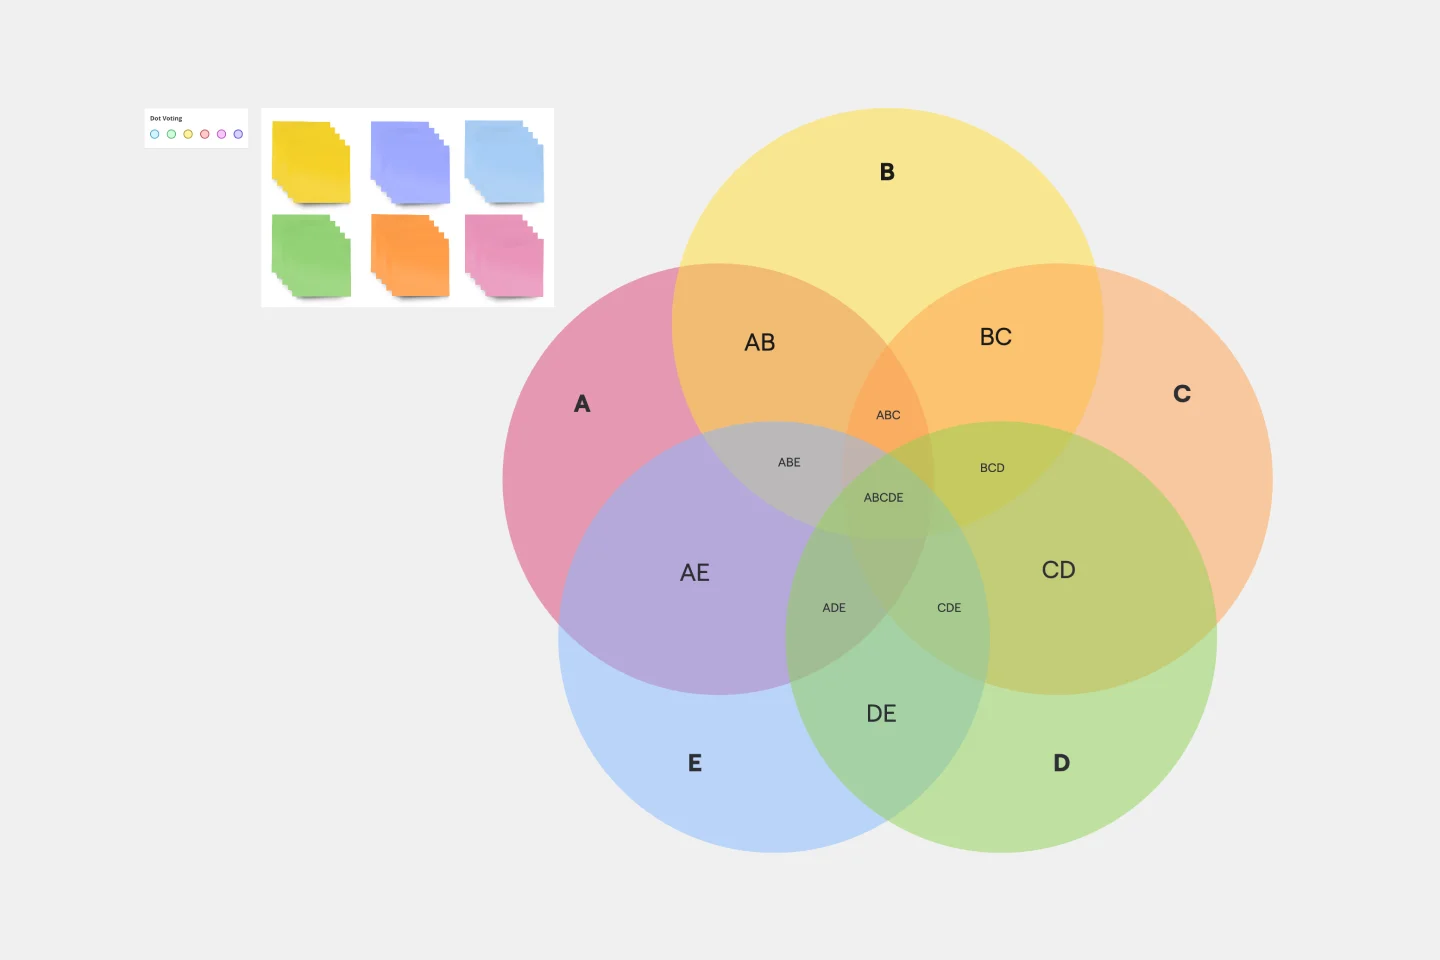
Need to compare ideas, spot connections, or explore how different topics overlap? This 5 Circle Venn Diagram makes it easy to visualize relationships and uncover shared themes in a clear, engaging way.
Whether you're running a workshop, planning a strategy, mapping capabilities, or brainstorming with your team, this template helps turn complex discussions into a simple visual story.
Great for
Strategy and planning sessions
Team workshops
Digital transformation projects
Product and service comparisons
Research and analysis
Brainstorming and ideation
Stakeholder mapping
How it works
Add your own category names to each circle.
Update the descriptions to provide context.
Fill the circles with key ideas, topics, or data points.
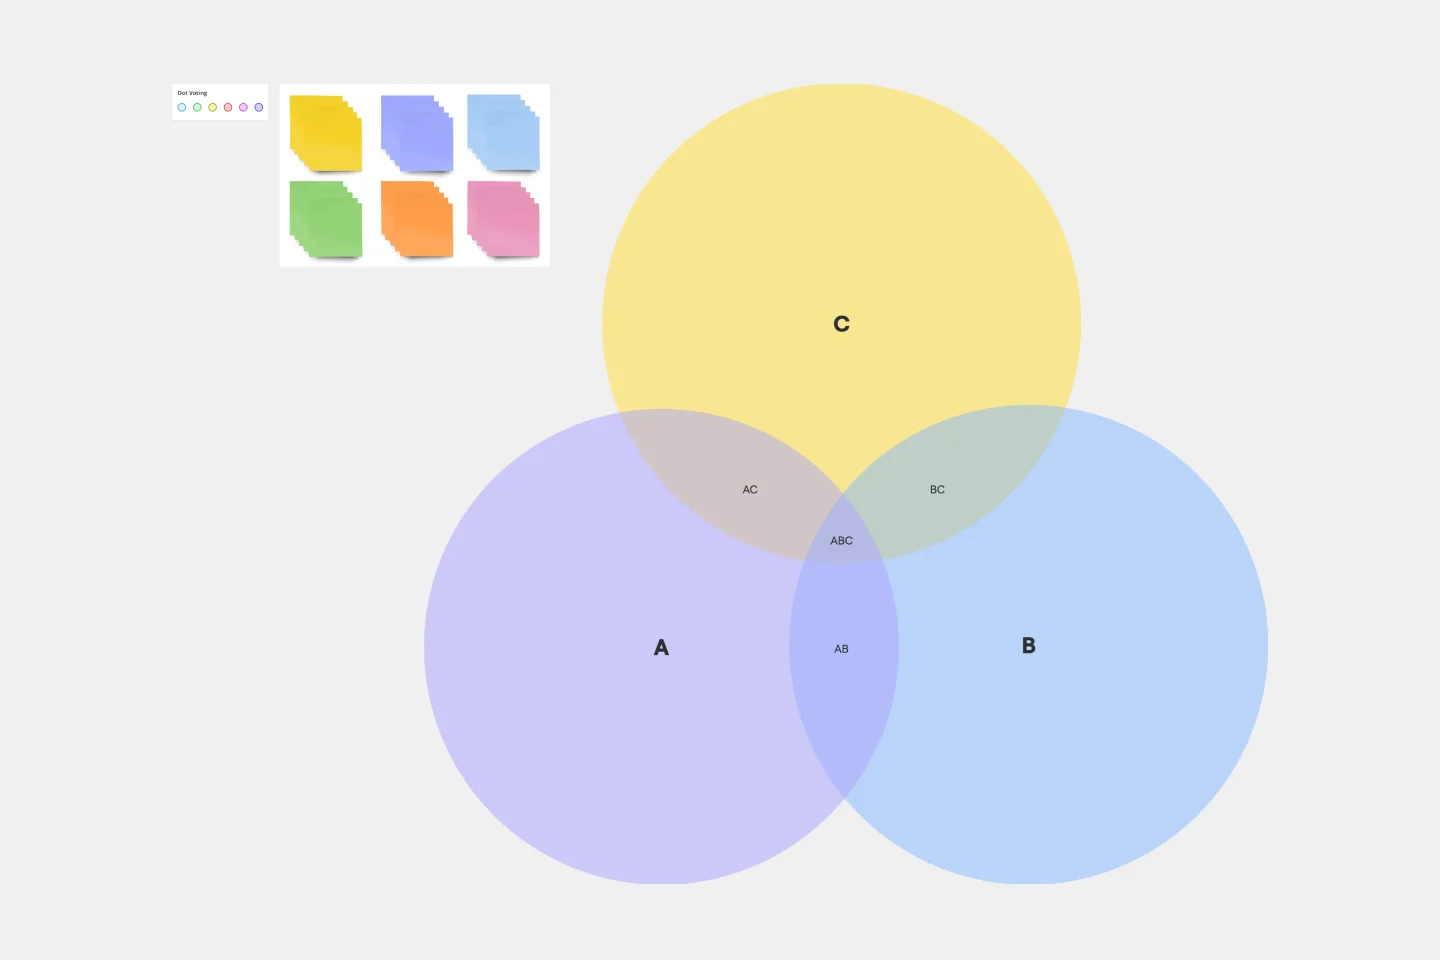
Use the overlapping areas to show similarities, dependencies, or shared insights.
Customize the colors and content to fit your needs.