Table of contents
Table of contents
Cause and effect diagrams: A Guide
Summary
In this guide, you will learn:
- What a cause and effect diagram (fishbone or Ishikawa diagram) is and how it organizes potential causes of a problem.
- The step-by-step process to create a cause and effect diagram, from identifying the problem to brainstorming and categorizing causes.
- How causes are grouped into main categories (people, processes, equipment) with sub-branches detailing specific factors.
- How the diagram analyzes root causes by mapping relationships and prioritizing causes with the greatest impact.
- How Miro’s collaborative platform facilitates building, customizing, and analyzing these diagrams in real time.
- The benefits of this tool for problem-solving, process improvement, and root cause analysis through clear visualization of complex cause-effect relationships.
Collaborative AI Workflows
Join thousands of teams using Miro to build the right thing, faster.
What is a cause and effect diagram?
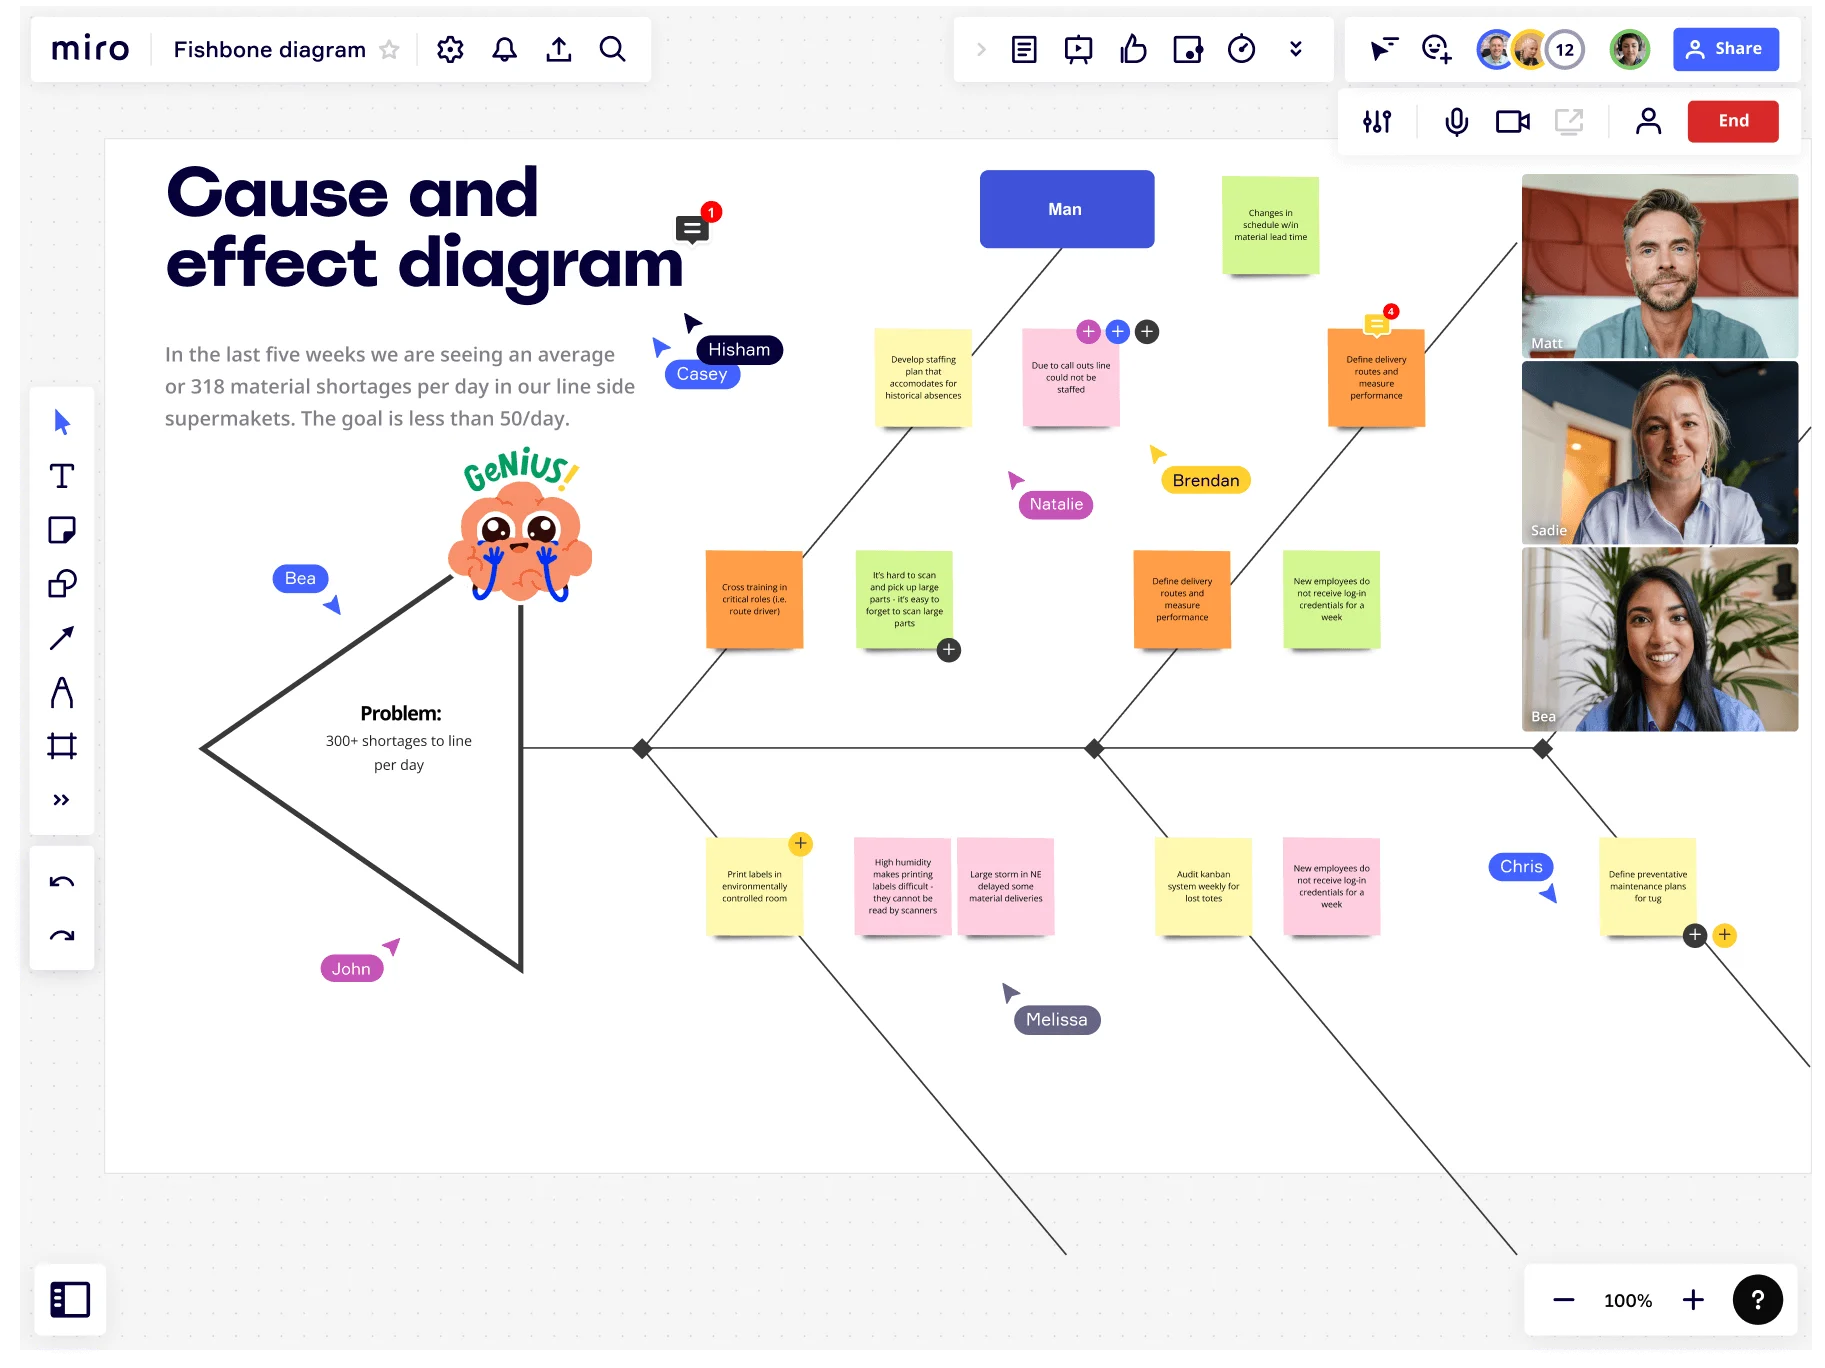
A cause and effect diagram is a powerful visual tool that helps identify and organize potential causes of an issue or effect. Also known as a fishbone diagram or Ishikawa diagram, it's widely used in many industries to identify the root causes of issues.
The diagram consists of a central spine, resembling a fishbone, with branches that represent different categories of potential causes. The categories can vary based on the context and nature of the problem.
For example:
- In manufacturing, the categories may include people, machines, materials, methods, and the environment.
- In healthcare, the categories may include patients, processes, equipment, environment, and staff.
Why use the cause and effect diagram?
The cause and effect diagram is an effective diagramming tool that can help teams tackle complex problems and improve their problem-solving capabilities.
Here are some benefits of using a cause and effect diagram:
- It helps teams identify the root cause(s) of a problem, which is crucial for developing effective solutions to address the issue.
- The diagram enables teams to leverage diverse perspectives and insights by encouraging collaboration and participation from team members. This helps them to arrive at a more comprehensive understanding of the problem.
- The diagram can be used across various industries and sectors, making it a versatile tool for problem-solving and decision-making.
- A fishbone diagram can help streamline a free workflow process by identifying bottlenecks or inefficiencies in a process.
Key concepts of cause and effect diagrams
Cause and effect diagrams are a useful tool for problem-solving. However, it's essential to understand their limitations and underlying concepts.
Visual representation of factors contributing to an observed effect
Cause and effect diagrams start with the effect at the center of the diagram, represented by a box or a circle. Then, branches get drawn out from the center, representing possible causes of the effect. This helps teams to identify multiple factors that contribute to an observed effect.
Each branch is a category of causes, such as “manpower,” “machine,” “method,” “measurement,” or “material.”
The branches are further divided into smaller sub-branches that represent specific causes. The diagram can be as simple or as complex as needed, depending on the problem at hand.
Interrelationships among causal factors are clearly shown
This type of diagram can help teams identify the relationships between different factors contributing to the observed effect.
By organizing the possible causes into categories and subcategories, the diagram can reveal the interdependencies among them. This can be particularly helpful when analyzing complex problems.
For example, a healthcare team uses a cause and effect diagram to identify the potential causes of patient falls in a hospital.
The diagram could show multiple branches with subcategories, such as:
- Environmental factors
- Medication-related factors
- Patient-related factors.
The team identifies that patient confusion, environmental factors, and medication side effects can all contribute to falls, and they're interrelated.
One causal factor may appear in several places
A single factor may contribute to the observed effect in multiple ways.
The cause and effect diagram can help identify multiple pathways. It does this by showing where a single factor appears in different categories or subcategories.
For example:
A manufacturing team uses a cause and effect diagram to identify the causes of product defects. The diagram shows that a faulty machine part may contribute to defects in the product's size, shape, and color, as well as affect the machine's overall performance. The team realizes that addressing the faulty machine parts could significantly impact the final product's quality.
It’s qualitative and hypothetical
While cause and effect diagrams can provide a valuable visual representation, their qualitative and hypothetical nature limit them.
The diagram doesn't provide any quantitative data, making it difficult to prioritize and compare different possible causes.
However, even with these limitations, the diagram can still be useful as a brainstorming tool for identifying possible causes and interrelationships.
How to create a cause and effect diagram
Creating a cause and effect diagram is a straightforward process that can help teams identify and address problems.
Here are the steps for creating a cause and effect diagram:
1. Identify the problem that needs to be addressed
The first step in creating a cause and effect diagram is to clearly identify the problem that needs to be addressed.
This problem should be clearly defined and specific so that the resulting diagram can accurately reflect the potential causes.
2. Determine the effect that is being observed
After identifying the problem, the next step is to determine the observed effect. This effect is typically a symptom of the underlying problem, and understanding it's crucial to identify the potential causes.
3. Brainstorm potential causes and categorize them into different groups
Once you have identified the problem and effect, the team can begin to brainstorm potential causes. These causes can then be categorized into different groups, such as people, processes, equipment, or materials.
4. Draw the cause and effect diagram using a visual tool like Miro
With potential causes identified and categorized, the team can then draw the cause and effect diagram using a visual tool like Miro.
This diagram should have the effect at the center and the different categories of potential causes branching out from it.
Miro has both fishbone diagram templates that are easy to customize and will help you get started in no time.
5. Review and refine the diagram with input from team members
Finally, the team should review and refine the cause and effect diagram with input from team members.
This feedback can help to identify any missing causes, refine the categorization of causes, and ensure accuracy.
Importance of involving all team members in the process
Involving all team members in the creation of a cause and effect diagram is crucial for identifying and addressing the root causes of a problem.
Each team member brings a unique perspective and expertise to the process, which can result in identifying more potential causes and the evolution of better solutions.
Additionally, involving all team members fosters a sense of ownership and credibility. It can also improve communication and collaboration, leading to more effective problem-solving.
Next, let’s look at how you would make one.
Example of a simple cause and effect diagram and how it was created
To illustrate the process of creating a simple cause and effect diagram, let's consider a scenario.
In this example, we'll create a cause and effect diagram to understand why 40% of users cancel their subscriptions after the first month.
First, we identified the problem: a high cancellation rate after the first month of a subscription.
Next, we determined the effect that was being observed: 40% of users were canceling their subscription after the first month.
We then brainstormed potential causes and categorized them into different groups, including:
- Customer Service
- Product Quality
- Price
- Marketing
We identified the Customer Service category subcategories, such as 'Difficult to Contact,' 'Unhelpful Support Staff,' and 'Long Wait Times.'
We identified subcategories for the Product Quality category, such as 'Technical Issues' and 'Poor User Experience.' For the Price category, we identified subcategories such as 'High Cost' and 'Hidden Fees.' And for the Marketing categories like 'Misleading Information' and 'Inaccurate Targeting.'
After categorizing the potential causes, we drew the cause and effect diagram using a visual tool like Miro. We then reviewed and refined the diagram with input from team members.
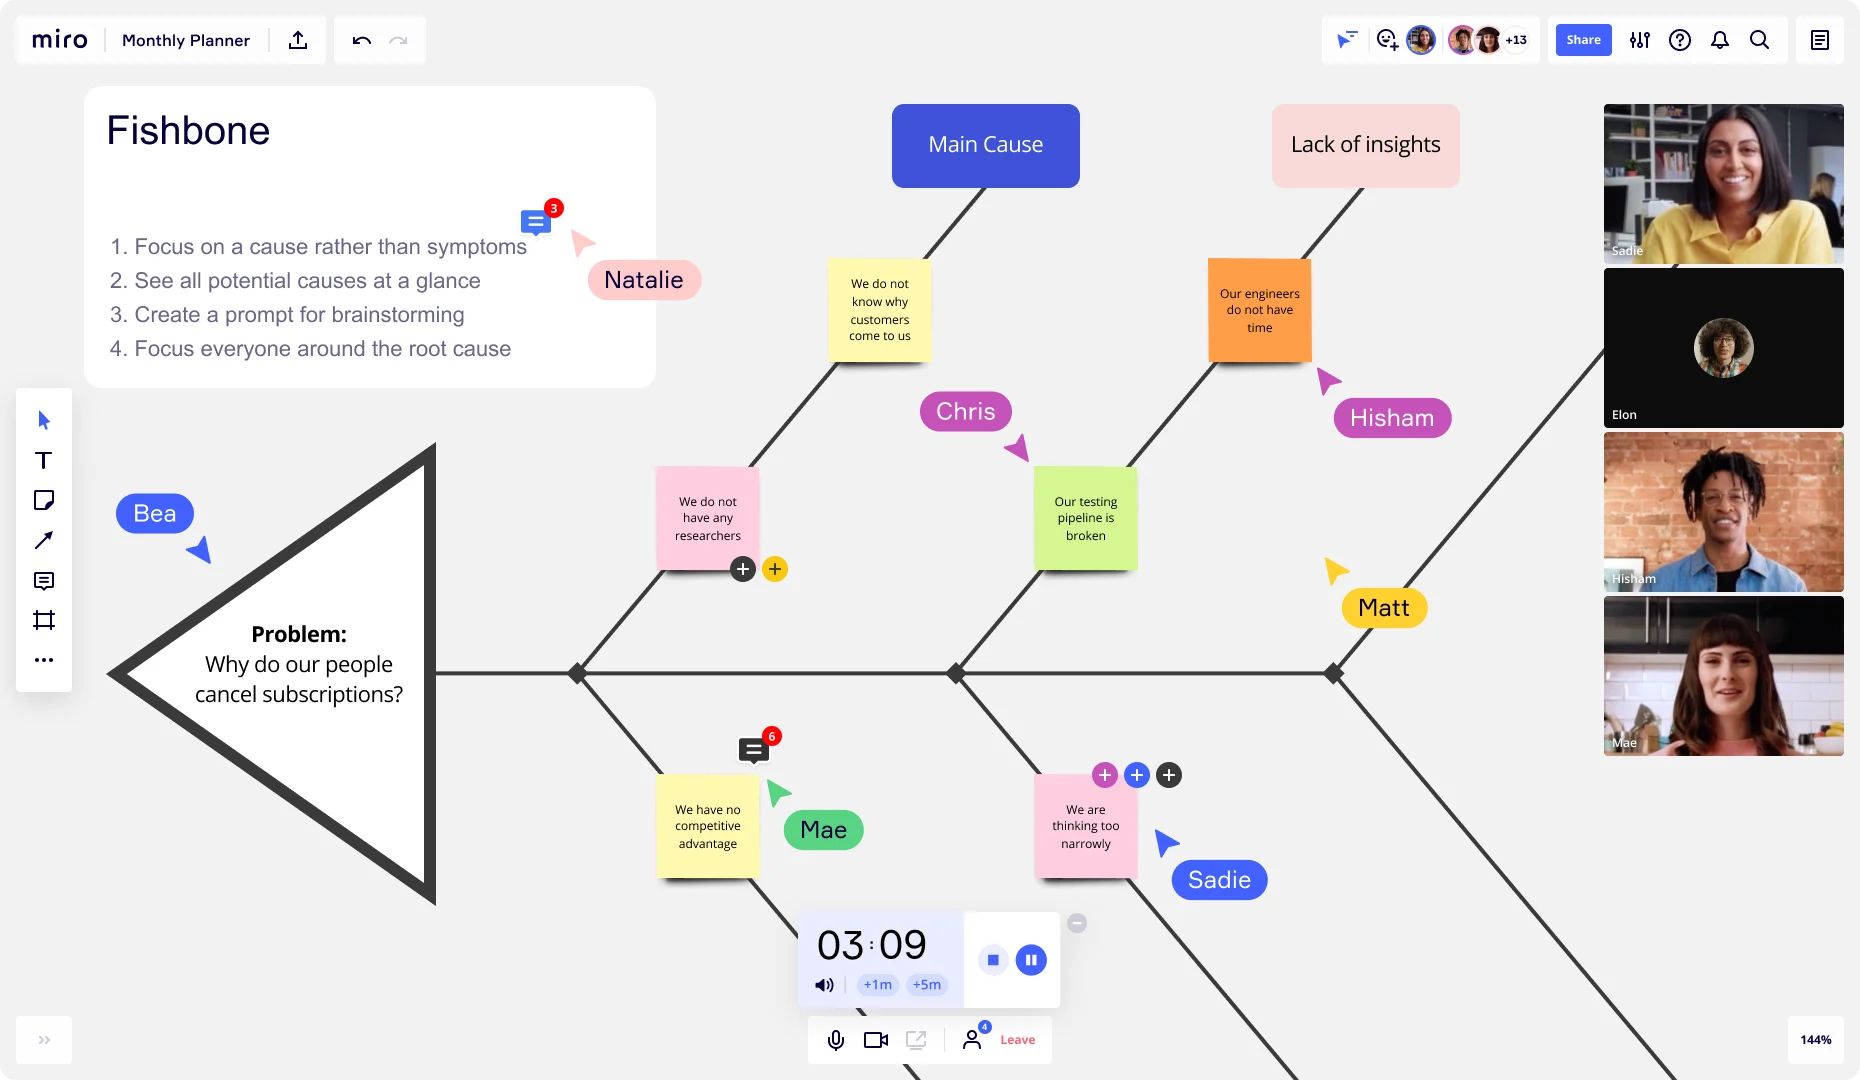
The resulting cause and effect diagram showed that the primary causes of the high cancellation rate were 'Difficult to Contact' and 'Poor User Experience.' These issues were further refined by analyzing the subcategories and identifying specific actions that could be taken to address them.
In the next section, we'll discuss how to analyze and interpret the diagram to identify the most likely causes of the problem.
How to analyze and interpret a cause and effect diagram
After creating a cause and effect diagram, the team needs to review it and identify potential causes that most likely contribute to the problem.
Several techniques can be used to analyze the diagram.
Techniques for analyzing and interpreting the diagram
One technique is to look for patterns or clusters of related causes. For example, if multiple causes in different categories all relate to a particular aspect of the problem, that may suggest that this is a particularly important area to investigate further.
Another technique is identifying potential causes that appear multiple times or in different categories. This can highlight the most important factors contributing to the problem and suggest areas where solutions could be targeted.
Teams can also use hypothesis testing, looking for evidence to support or disprove each potential cause. By testing hypotheses, the team can identify which potential causes are most likely to be the root cause(s) of the problem.
The goal of analyzing the diagram is to identify the most likely root cause(s) of the problem, which can then be addressed with targeted solutions.
Importance of considering both direct and indirect causes
It's essential to consider both direct and indirect causes when analyzing a cause and effect diagram. Direct causes are factors that directly contribute to the observed effect, such as malfunctioning machines. Indirect causes refer to underlying factors, such as insufficient training, that may not be immediately obvious.
An example could be a production problem caused by a broken machine and an untrained operator. While fixing the machine is a direct solution, providing the operator with proper training is indirect.
Addressing indirect causes can be more effective in the long term since they can have a wider impact and can contribute to solving future problems. So, considering both direct and indirect causes can help the team develop more effective solutions to the problem.
Example of a complex cause and effect diagram
A complex cause and effect diagram may include multiple categories with many potential causes or represent a system with many interrelated parts. For instance, a diagram related to supply chain management could include categories such as logistics, inventory, and procurement, with dozens of potential causes under each category.
To analyze such a diagram, the team would need to use techniques like:
- Looking for patterns or clusters of related causes
- Identifying potential causes that appear multiple times or in different categories
- Testing hypotheses by looking for evidence to support or disprove each potential cause
Since complex diagrams can be overwhelming, involving all team members in the analysis is important. This ensures that different perspectives and knowledge can contribute to identifying the root cause(s).
After analyzing the diagram, the team should have a better understanding of the most likely root cause(s) of the problem. This information can then be used to develop targeted solutions to address the problem and prevent it from occurring again.
Use Miro to build an effective cause and effect diagram
Whether you're mapping out the root causes of a problem or analyzing the consequences of an action, Miro makes it easy so visually and collaboratively create a cause and effect diagram.
Using intuitive drag-and-drop functionality you can easily add and connect elements, label branches, and customize your diagram to suit your specific needs. Collaborate in real-time with your team, regardless of their location, and benefit from their insights as you build a comprehensive diagram. Sign up for free to get started!
Author: Miro Team
Last update: October 9, 2025