What is a Fishbone diagram?
Summary
In this guide, you will learn:
- What a fishbone diagram is: a visual tool for identifying root causes of problems.
- How fishbone diagrams help teams systematically explore and categorize potential causes.
- The benefits of using fishbone diagrams for focused problem-solving and improved team alignment.
- How Miro’s fishbone diagram templates enable easy creation and collaborative teamwork.
- Practical examples of fishbone diagrams applied to common problems.
- Ways to integrate fishbone diagrams with other tools and export options for actionable plans.
Collaborative AI Workflows
Join thousands of teams using Miro to build the right thing, faster.
Fishbone diagrams explained
A fishbone diagram (also known as an Ishikawa fishbone diagram) is an effective problem-solving tool. Instead of focusing on a quick fix, creating a fishbone diagram helps to identify the root cause of a problem and find a long-term solution.
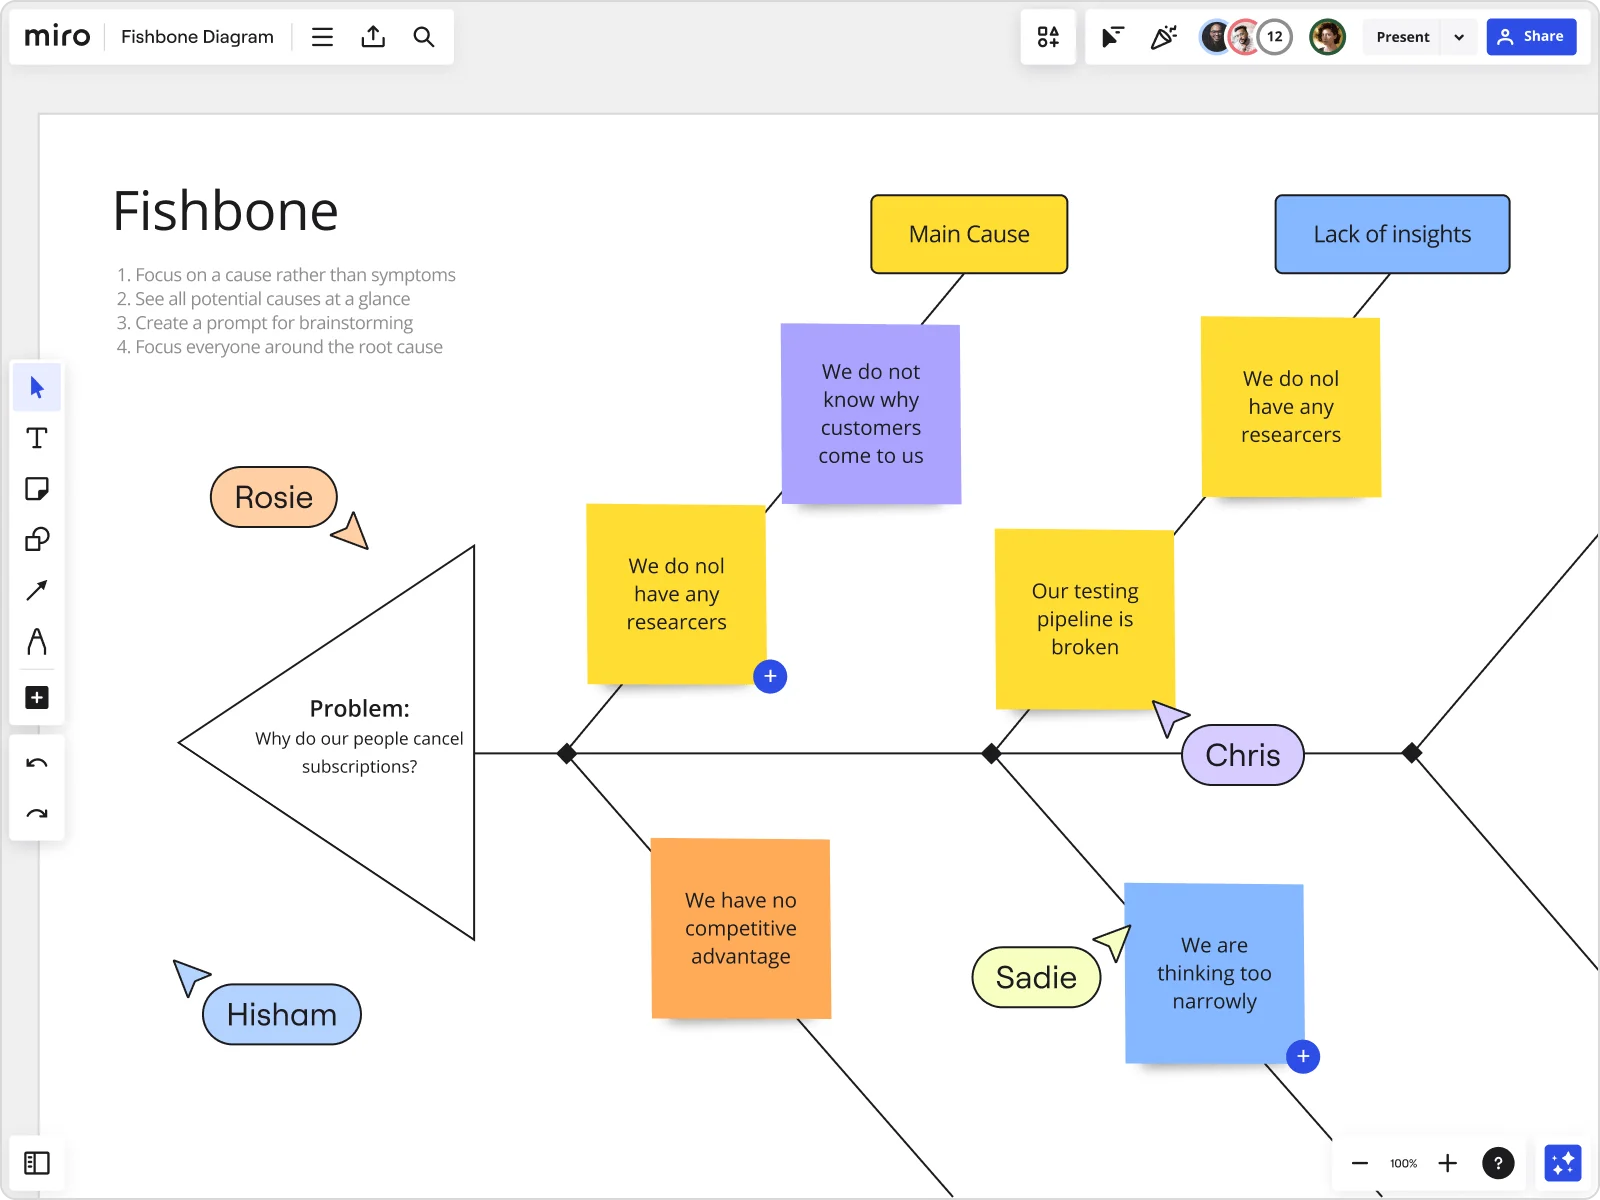
As a type of cause and effect diagram, the “fishbone” name comes from the diagram’s resemblance to a fish skeleton. A fishbone diagram consists of three main categories:
Fish head
There’s a fish head at the head of the diagram, where you’ll outline the problem you’re trying to solve. The rest of the diagram branches out from here.
Spine
The spine stems from the head of the diagram (the problem statement), providing the outline of the fish. At the end of each spinal bone is a category that needs to be considered as part of the problem-solving process.
Bones
Branching out from each spinal bone, you’ll see a smaller rib bone. This is where the possible causes will sit to help you pinpoint the potential cause of the problem.
Benefits of fishbone diagrams
Fishbone diagrams are useful tools for improving existing processes and pinpointing causes of issues. Take a look at some benefits of performing a fishbone diagram root cause analysis:
Easily find the root cause of a problem
A fishbone diagram is a visual tool that adds structure and clarity to problem-solving. It indicates the problem and its possible causes in a single location, making it easier for teams to conduct a root cause analysis.
Prevent further problems
By finding the root cause of the problem, you fix the problem at its source and mitigate future issues. As a result, you’re far more likely to prevent the same (or similar) problems from cropping up in the future.
Collaborate with your team
A fishbone diagram is a great way to work with your team to brainstorm solutions. It’s a collaborative diagram, encouraging teams to review all the available information and discuss the best course of action.
If you’re part of a remote or hybrid team, an online platform like Miro allows you to collaborate with your team, no matter where they work. Simply share the diagram and hop on a video chat, and you can perform your root cause analysis virtually.
Example of a fishbone diagram
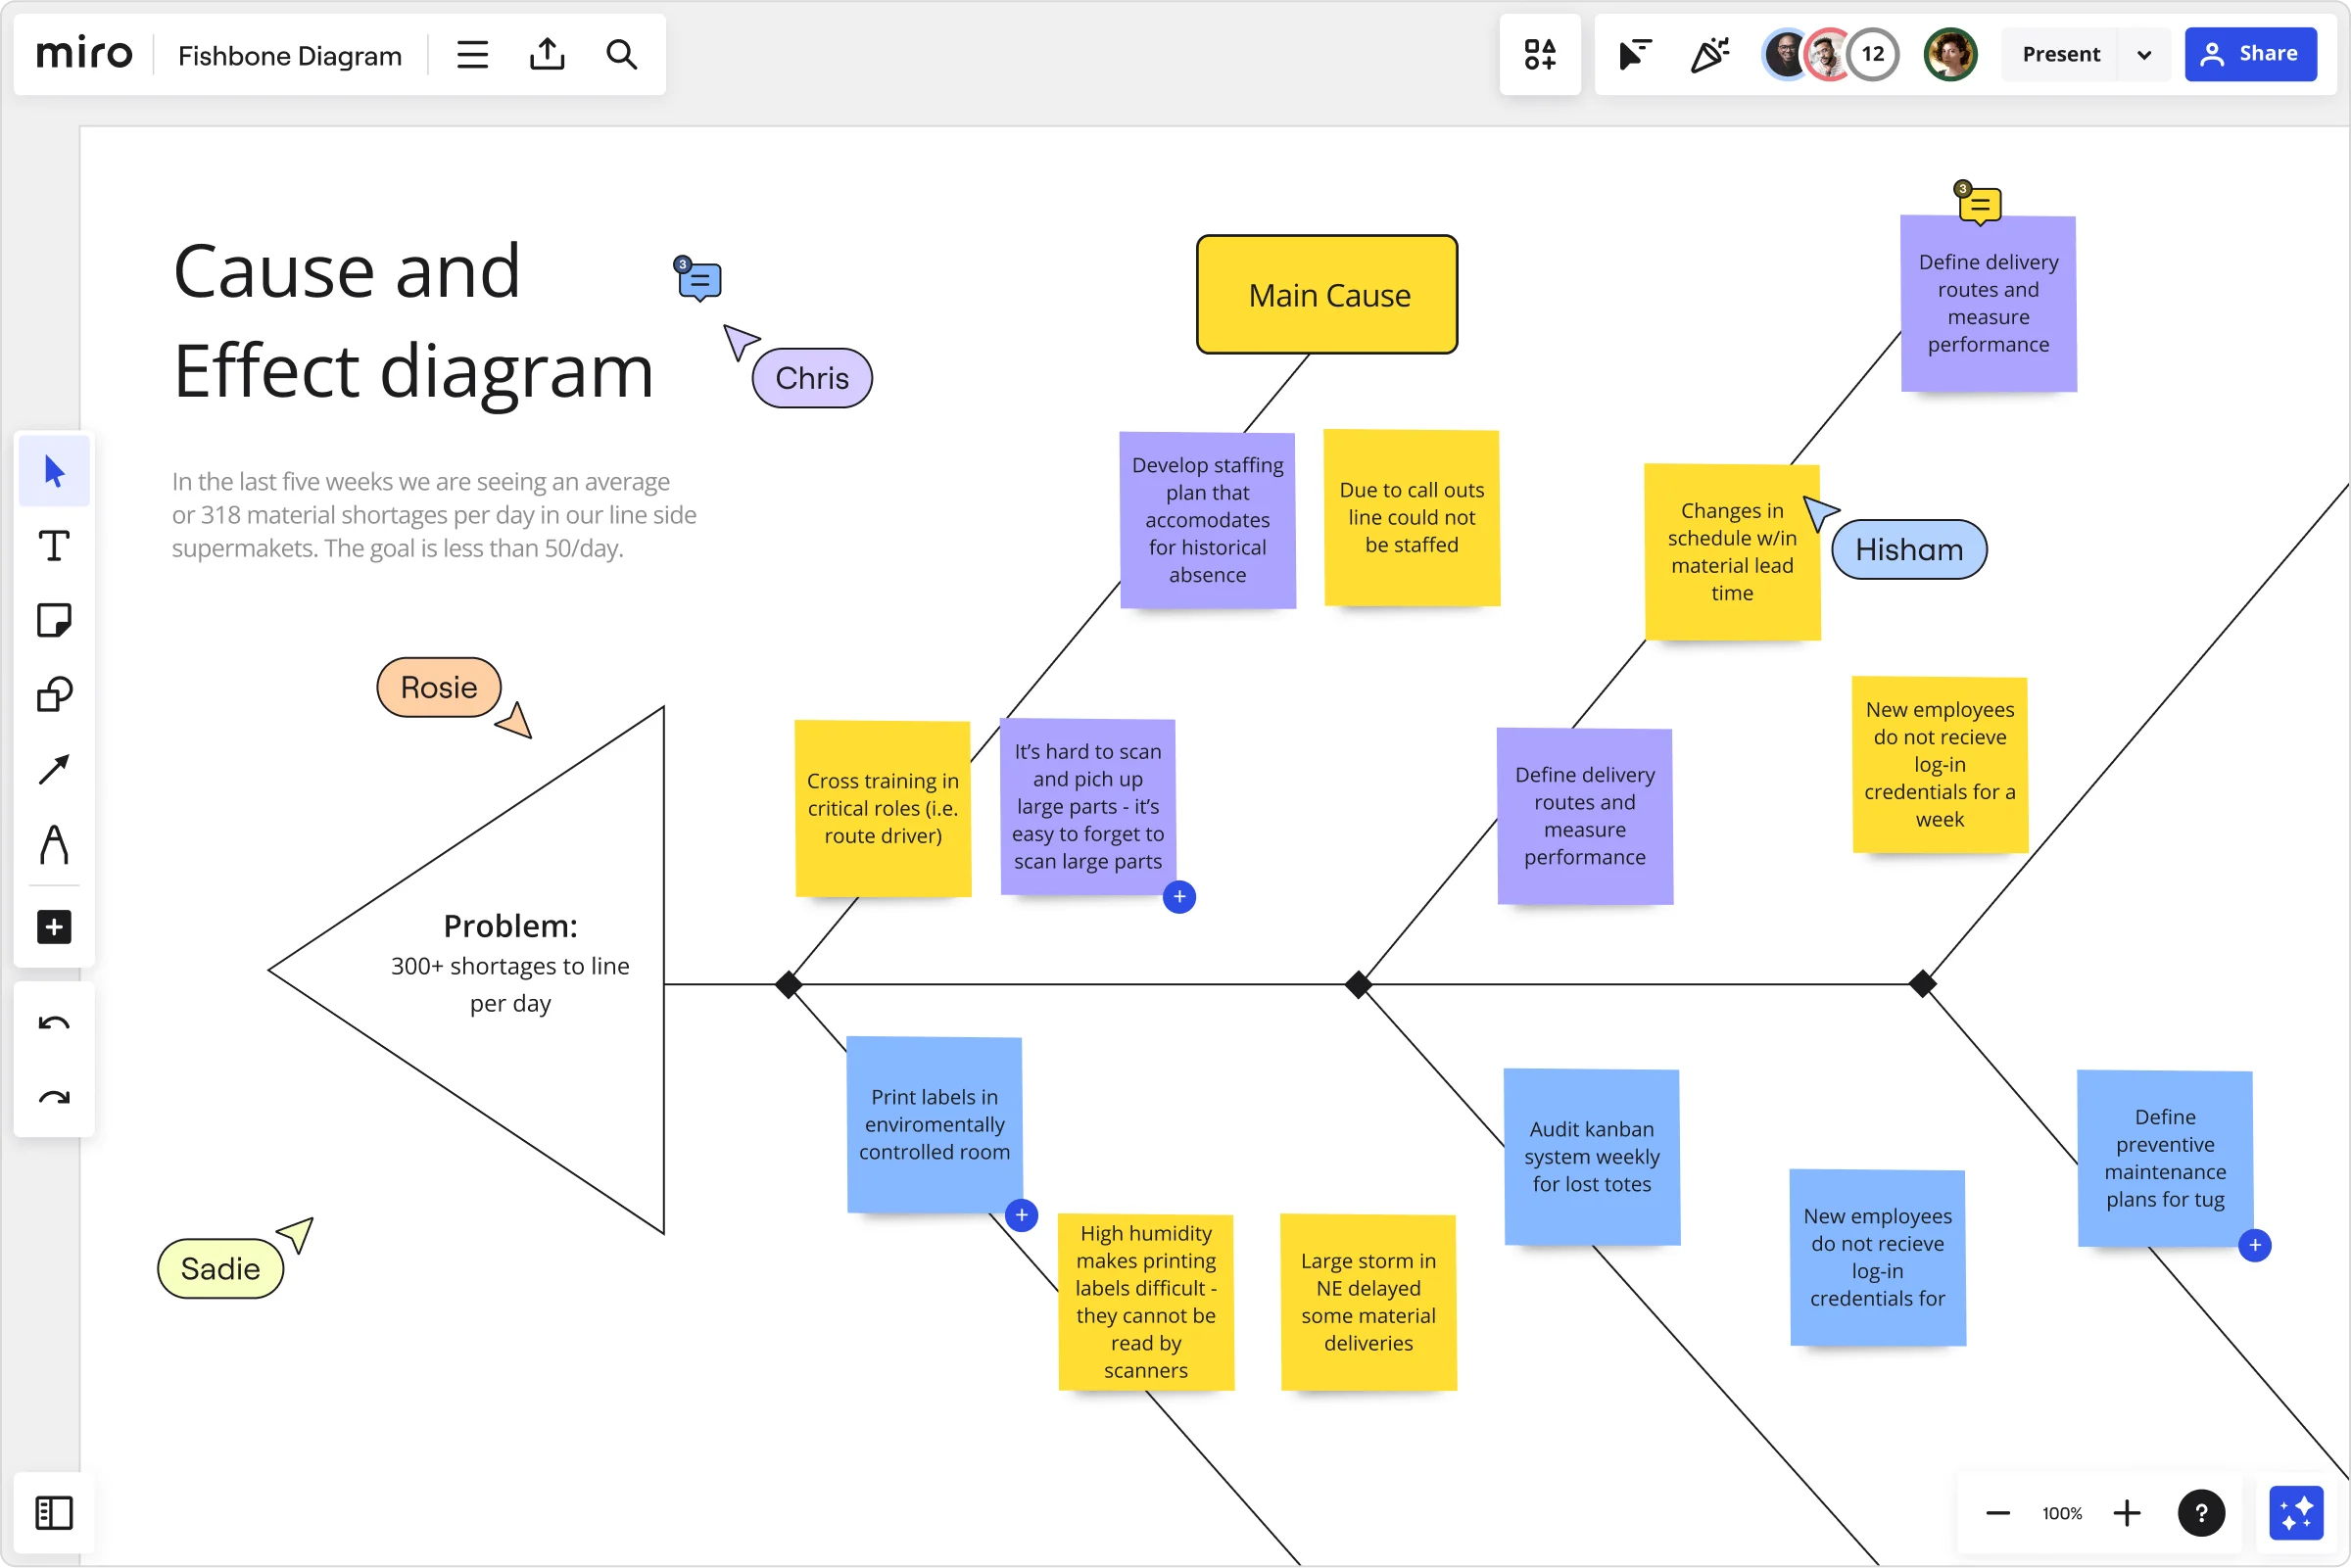
To see a fishbone diagram in action, look at this CEDAC Template from NEXT LEVEL Partners.
CEDAC is an acronym for Cause and Effect Diagram with the Addition of Cards. The diagram contains issues on the left-hand side of the ribs and solutions on the right-hand side.
Its inventor, Ryuji Fukuda, created CEDAC so that teams can delve deeper into their problem-solving analyses. By adding cards to the diagram, teams have a way of questioning existing information and suggesting new ideas. As a result, they’ll gain a deeper understanding of their problems and how to solve them.
Here are some of the common areas where the CEDAC model can be helpful:
Product development
Visualize issues with product development using the CEDAC diagram. Collaborate with the product team to identify the cause of the problem and use cards to identify the best possible solution.
Software features
Effectively allocate resources based on team structures and capabilities. Understand the most critical problems to solve and how they map together.
Product design
Define failures or problems with your product design, and identify effective solutions. Using the diagram’s cards, product designers can generate new and creative solutions to improve the design.
Internal processes
Pinpoint bottlenecks and figure out how to streamline and improve your business processes. Encourage team members to join in the discussion and make suggestions for improving the process going forward.
When to use a fishbone diagram
Take a look at some of the different instances when using a fishbone diagram can be useful for you and your team.
1. To analyze a problem statement
If you have a clear problem statement for your business, a fishbone diagram is a great way to analyze it in detail. You can see the problem’s culprit and decide how to fix the issue.
2. To brainstorm the causes of the problem
Also known as root cause analysis, a fishbone diagram allows you to discuss the potential causes of a problem. It’s the perfect opportunity to host a brainstorming session to identify pressing concerns and work through possible solutions.
3. To analyze a new product design
Use a fishbone diagram to map your new product design and visualize any potential hurdles before they come your way. As a result, you can put preventative measures in place before going live.
4. To improve your processes
If you’re struggling to streamline your processes and inefficiencies, a fishbone diagram can help. Use a fishbone diagram to pinpoint the troublesome areas of your process and find the cause of a problem. From there, you can determine exactly how to fix it.
5. For quality improvement
Use a fishbone diagram to visualize how and where you can improve to offer your customers a higher-quality experience. For example, you might want to improve the quality of your customer service. In this case, you can use the diagram to find areas for improvement in your existing processes.
How to make a fishbone diagram
Follow these simple steps to create an effective fishbone diagram:
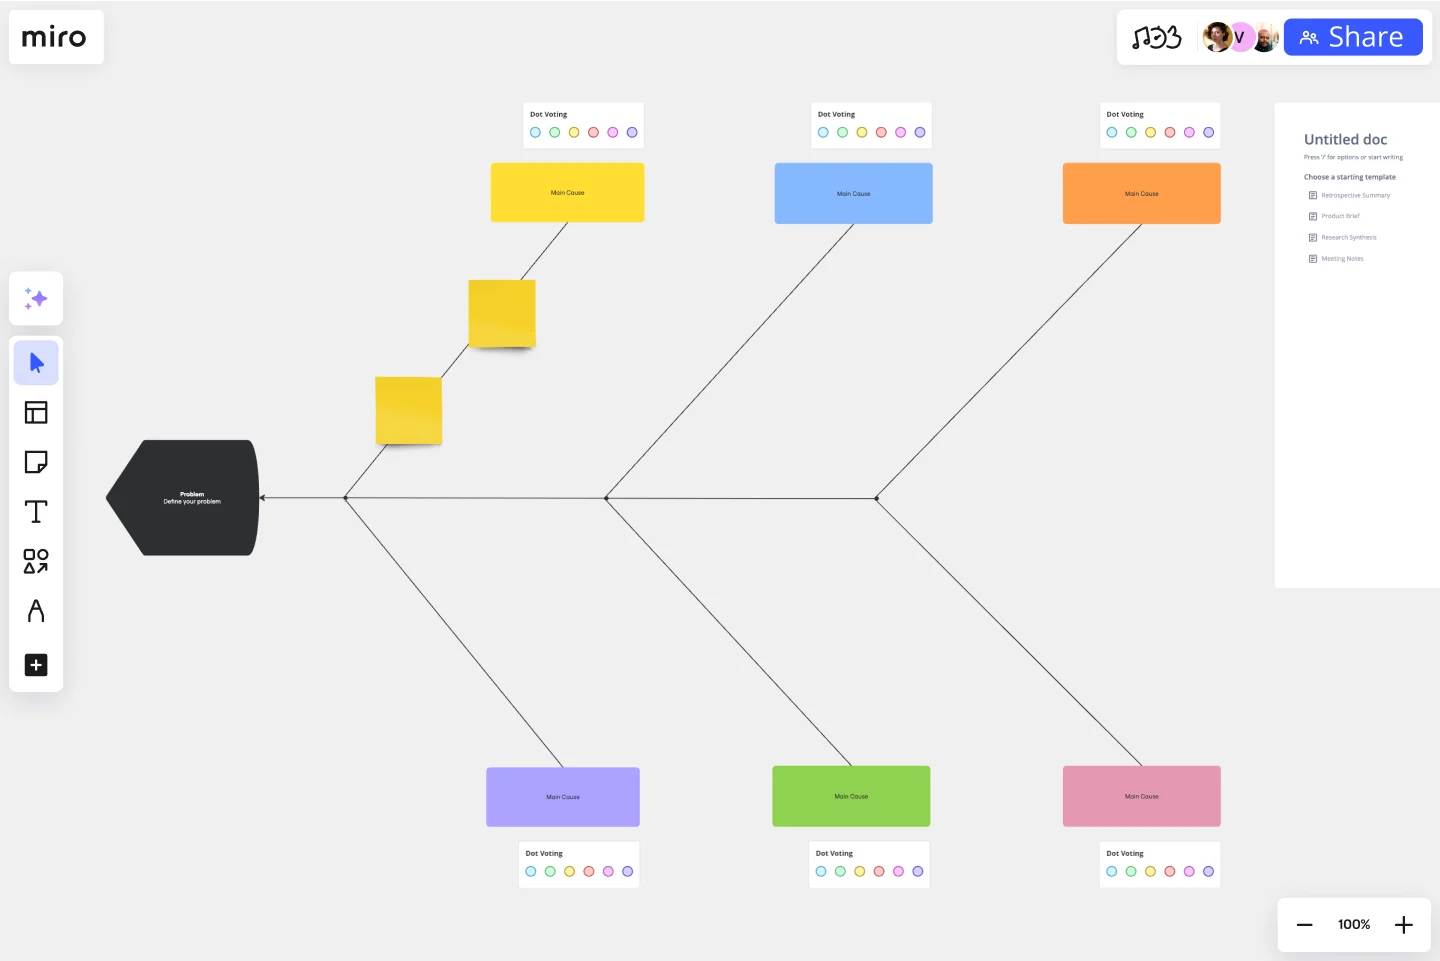
1. Select the Fishbone Diagram Template
While you can always build your own diagram from scratch, you can also get a headstart by selecting one of these Fishbone Diagram Templates. It’s free and easy to use, so you can start mapping your diagram immediately.
2. Outline your problem statement
When your diagram is ready to use, start by defining the problem. Otherwise known as a problem statement, this will sit at the head of the diagram. This must be as clear and concise as possible to find the right solution.
For example, in the diagram below, the main problem is that “40% of users cancel the subscription in the first month.” This statement clearly describes the problem and offers a solid starting point for finding a solution. Now, let’s consider how this would work if the statement were written differently — for example, “to increase customer retention.”
This statement is pretty vague, and there’s a lot of room for interpretation. Instead of focusing specifically on how to keep existing customers after the first month, teams might explore other avenues that won’t necessarily solve the actual problem.
The problem statement doesn’t have to be long and detailed. In fact, you should keep it short — ideally, no longer than a sentence. That way, it’ll be easy for your team to see the problem and won’t overcrowd the diagram. But the problem statement should always be clear and concise, leaving no room for interpretation.
If you’re new to problem statements or want a framework to guide you, look at Prime Motive’s Problem Framing Workshop Template.
3. Pinpoint your root causes
With your problem statement in place, you can now branch out and start to pinpoint the possible causes of the problem.
The specific causes will depend on what your problem statement is. For example, if your problem statement is related to product design, your root causes could include the following:
- Employees
- Equipment
- Material
- Budget
- Technology
- Inspection
These are just a few examples. In your diagram, you might find that you have more or fewer root causes. With an intuitive platform like Miro, it’s easy to add or remove boxes based on how many you need.
When adding causes to your diagram, those with the biggest impact should be closest to the problem. The farther away a cause is from the head of the diagram, the less influence it has on the problem.
4. Identify individual causes
You can now identify the individual elements that contribute to the overall cause. These are the bones of the fish.
Let’s use an example to demonstrate how this works. Imagine that one of your root causes is “Equipment.” Here are some of the individual causes that might sit under this area:
- You are using outdated and inefficient equipment
- It’s expensive to replace existing equipment
- There aren’t enough employees who know how to use the equipment
All of these elements could contribute to the problem you’re facing, but it’s up to you and your team to pinpoint the key elements at the root of the problem. Review all this information with your team, and you’ll be able to see which problem is most likely to have a long-term solution.
If you’re unsure how to identify the individual causes, look at the 5 Whys framework and check out 5 why templates. It’s a simple brainstorming tool that helps teams explore the reasons behind a potential problem.
5. Create a plan of action
After working with your team to find the root cause of the problem, you can create an action plan for improvements. This involves mapping out the steps you need to take to solve your problem and how you’ll measure success (we suggest using the SMART Goals framework for this).
During this stage, be sure to focus on how to make lasting improvements. Don’t lose sight of the bigger picture in favor of a quick fix. The purpose of the fishbone diagram is to implement a long-lasting solution to your problem, so keep this in mind when creating your plan of action for the future.
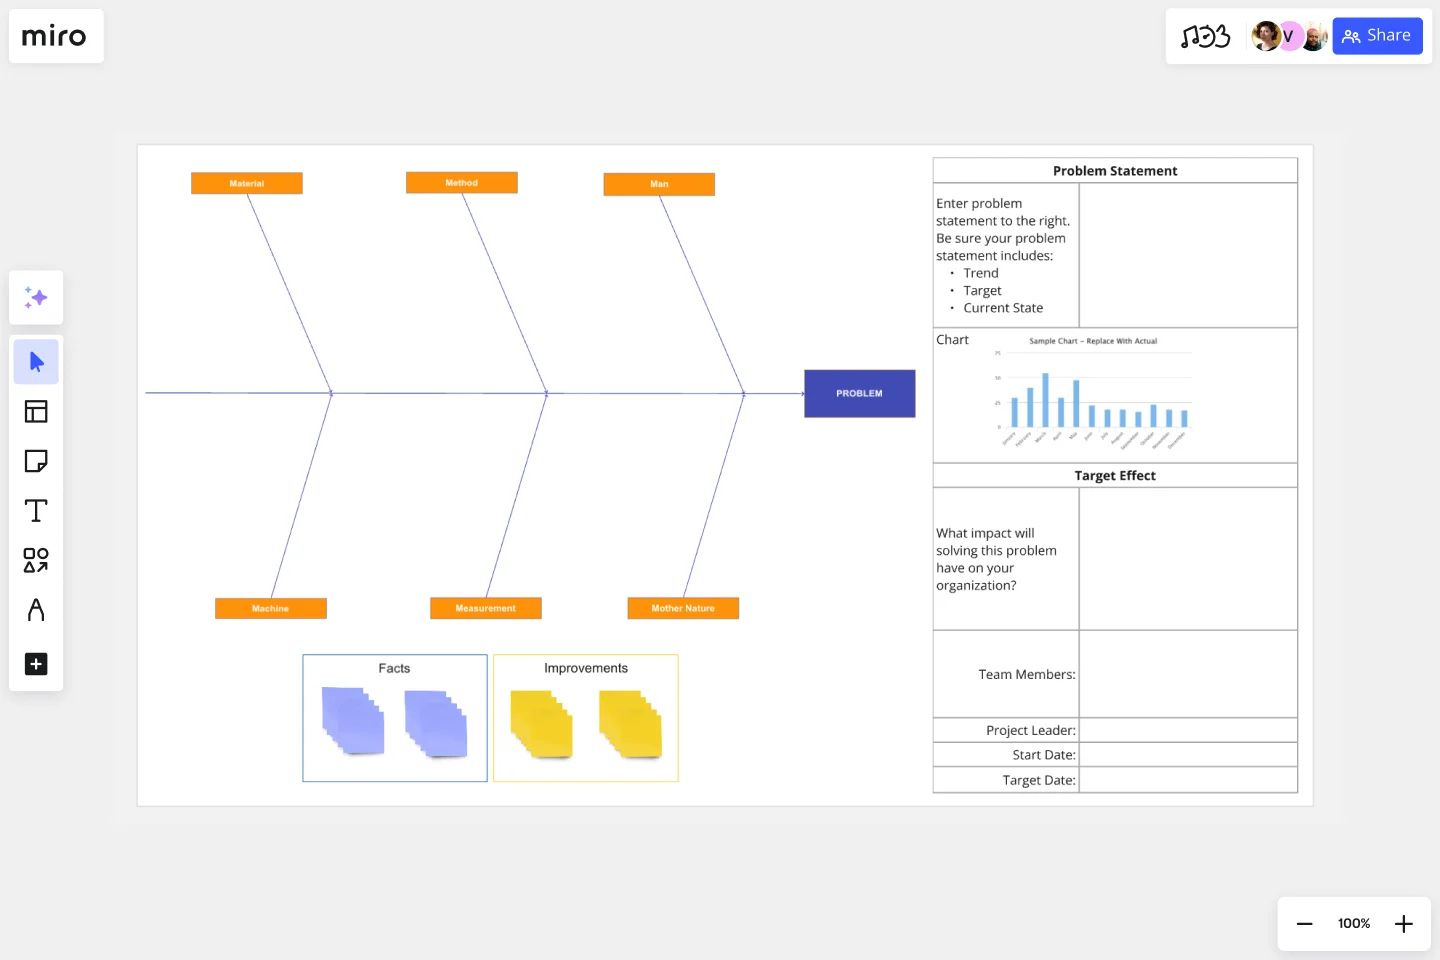
Fishbone diagram categories: the 6Ms of production
The fishbone diagram is used across various industries, but the original diagram was created to improve the manufacturing process. The six methods (6Ms) of production come from this original diagram, and engineers and designers would use this structure to cover all their bases.
The 6Ms of production are as follows:
1. Manpower
The functional activity involved in designing and delivering a product.
2. Method
The production process and any other processes that contribute to the delivery of the final product.
3. Machine
Any systems, tools, or equipment used in manufacturing.
4. Material
The raw materials and components needed to create the end product.
5. Milieu (or Mother Nature)
Any environmental factors, such as weather, floods, or fire. Although most milieu factors can’t be controlled, there are some instances where businesses can put preventative measures in place to mitigate problems.
6. Measurement
The physical measurements (volume, distance, temperature, and so on) of a product, machine, or workspace.
The 6Ms are only relevant if you’re using the fishbone diagram to improve a manufacturing or production process. If you’re using the diagram for any other purpose, there’s no need to follow this structure.
Find solutions faster with a fishbone diagram
When facing a problem, finding the right solution often comes down to understanding its root cause. That’s where a fishbone diagram can make a real difference. By visually breaking down the potential causes of an issue, the diagram helps you and your team stay focused, organized, and on track—leading to quicker and more effective solutions.
The structured layout of a fishbone diagram allows you to systematically explore each factor contributing to the problem. Instead of jumping to conclusions or missing important details, you can see how various causes connect and identify the one that needs the most attention. This logical approach helps reduce wasted time spent on irrelevant areas, allowing you to move more quickly toward the solution.
Miro’s innovation workspace makes the process even faster. With ready-made fishbone diagram templates and automated diagramming tools, you can set up your analysis with just a few clicks. This saves time and ensures that your focus remains on solving the problem rather than the mechanics of building the diagram. Happy diagramming!
Author: Miro Team
Last update: October 9, 2025