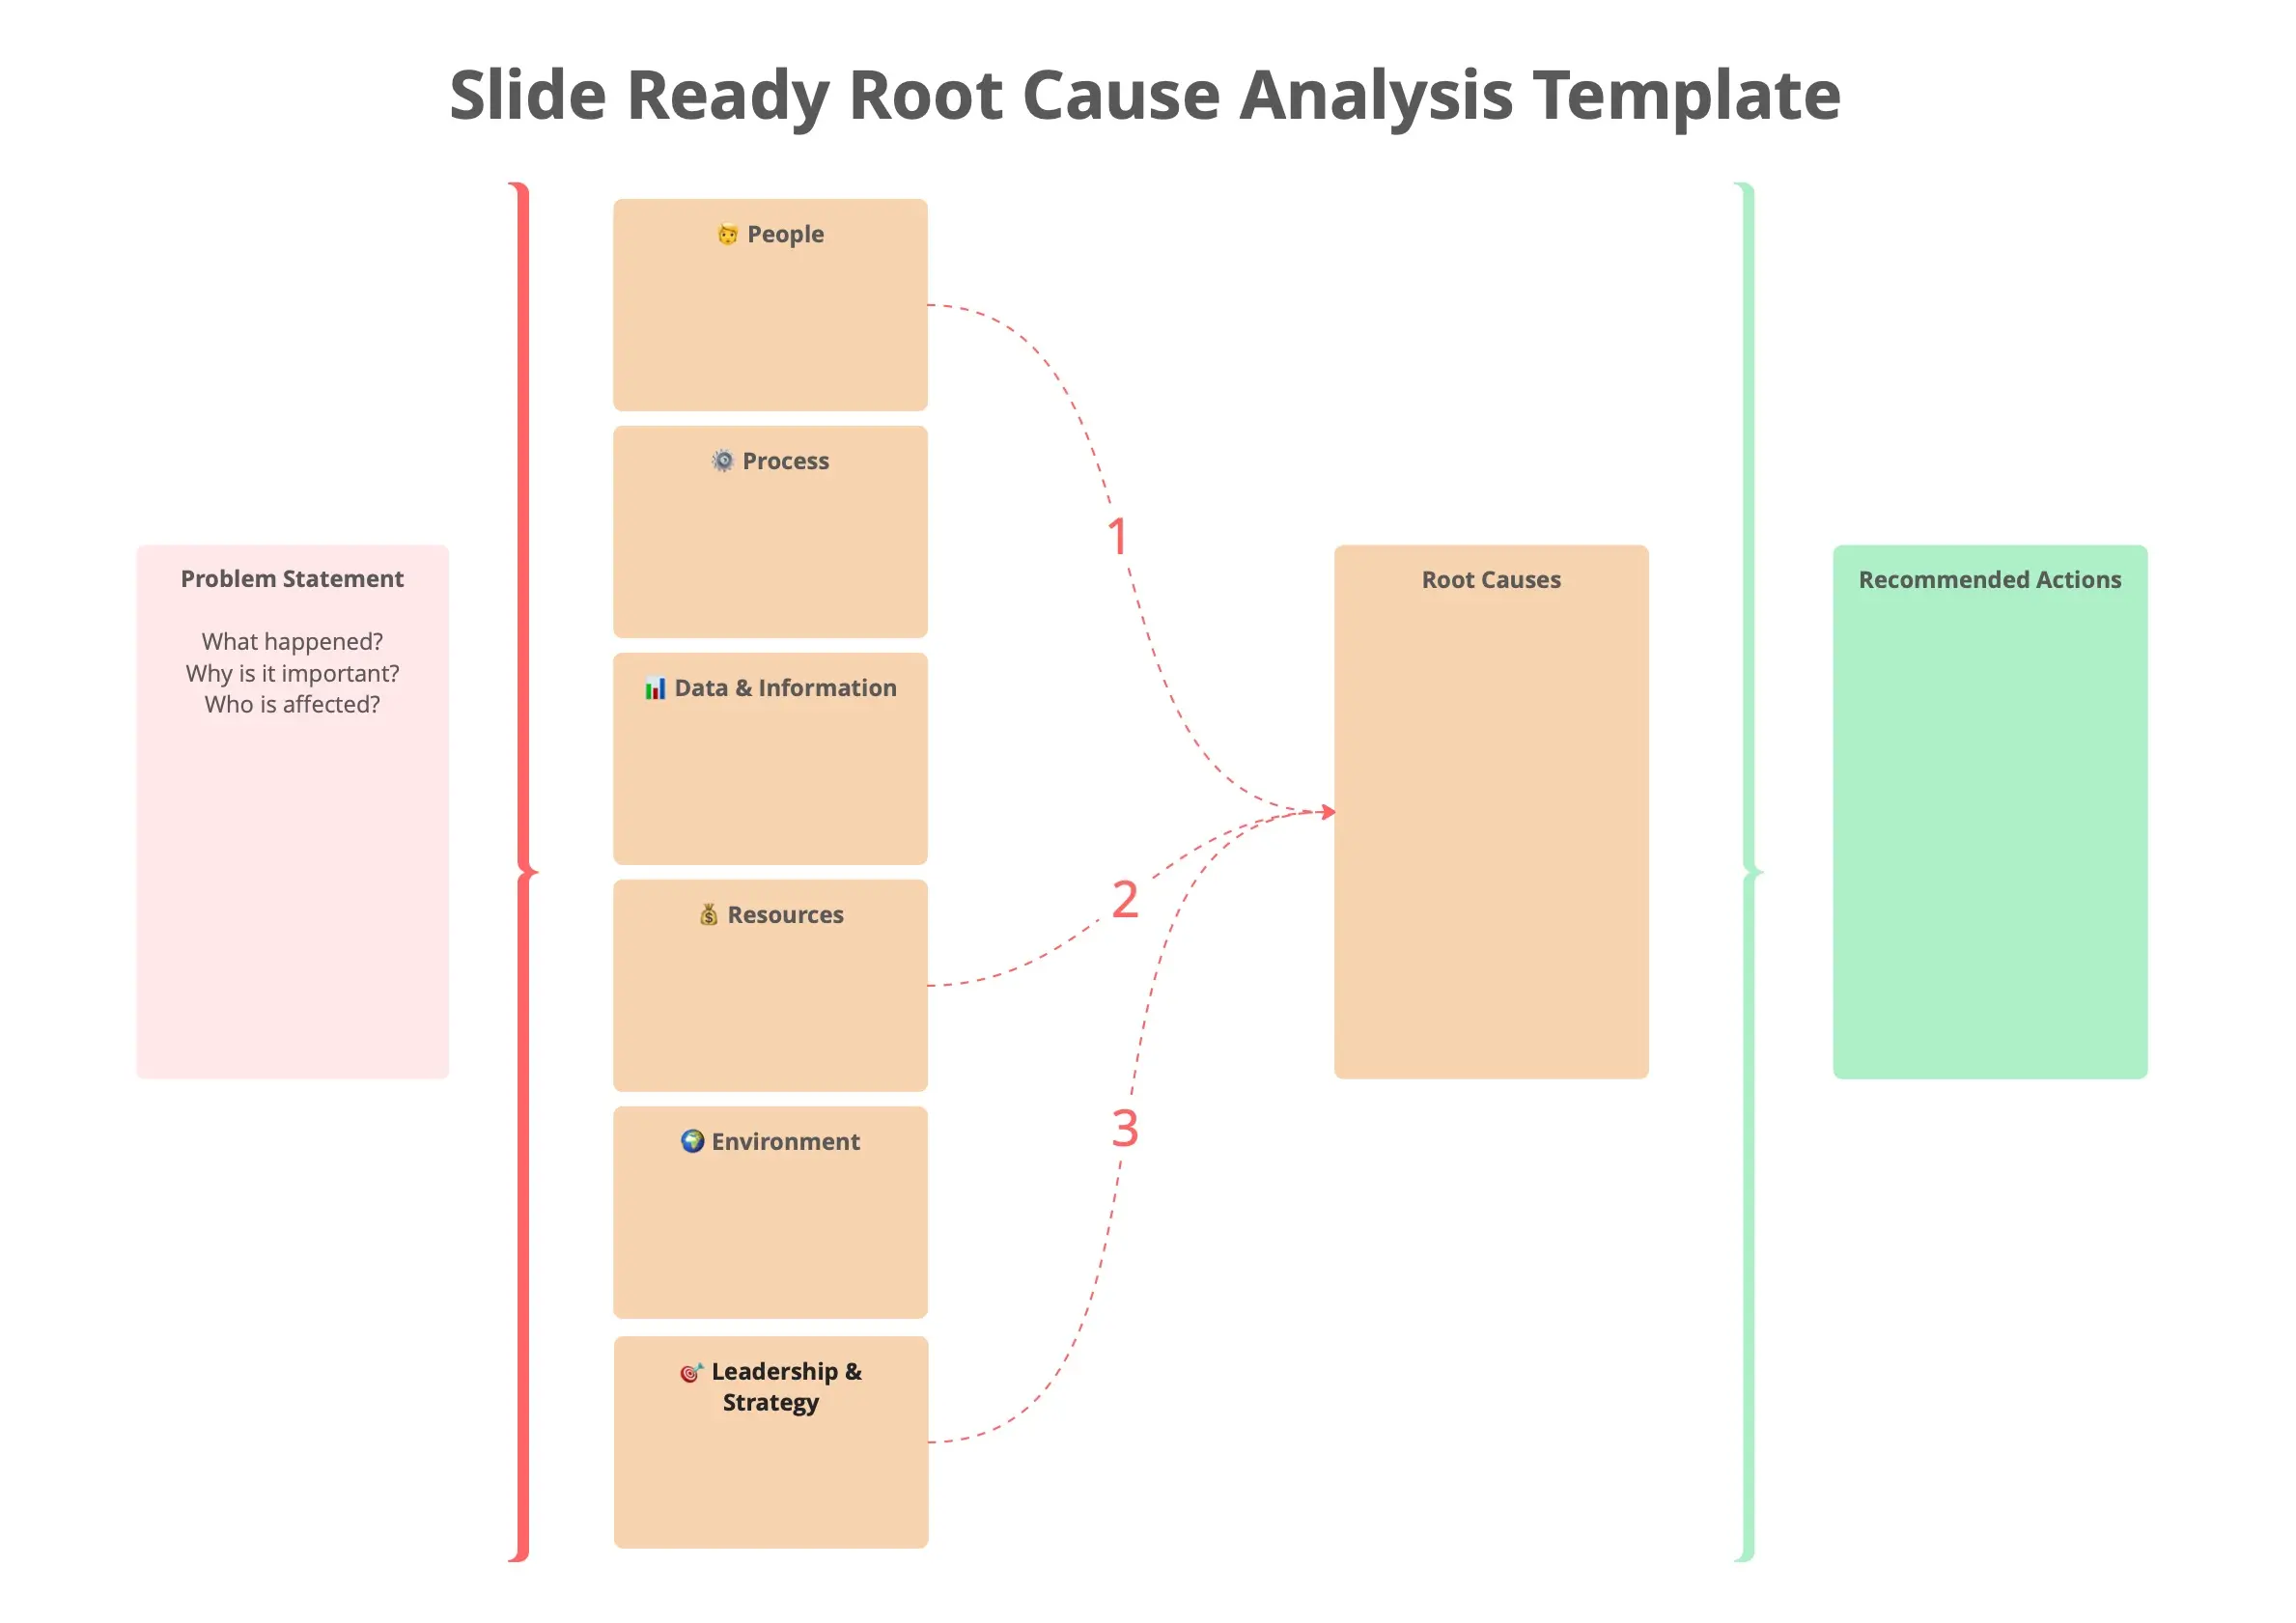
Root Cause Analysis – Cause Mapping
Brief
Root Cause Analysis – Cause Mapping is a structured visual tool that helps teams investigate problems systematically. Starting from the impact on an organization's goals, the method traces causes left-to-right by repeatedly asking "Why?" at each step. The map branches wherever multiple independent causes apply, revealing the full picture of how a problem occurred. Solutions are then attached directly to the specific causes they control, enabling teams to select the most effective and economical interventions rather than chasing a single "root cause."
Who Can Use It
This template benefits any team investigating incidents, defects, outages, or recurring problems. Safety teams use it for injury and near-miss investigations. Operations managers apply it to process breakdowns and production delays. Quality engineers trace defects back to their sources. Project managers diagnose schedule slips and budget overruns. IT and DevOps teams map system outages and performance incidents. HR teams investigate workplace conflicts and turnover patterns. Cross-functional teams especially benefit from the visual, evidence-based structure that builds shared understanding across departments.
How to Use It
(a) Fill in the Problem Outline – Record the problem, when and where it occurred, and which organizational goal was affected.
(b) Identify the Impact – Specify which goal was hurt: safety, customer satisfaction, cost, schedule, or quality.
(c) Build the cause map – Starting from the impact, ask "Why?" at each node and move left-to-right. Branch the map when multiple independent causes exist at the same step.
(d) Note evidence – Document the log, record, photo, interview, or data that supports each cause. A cause without evidence is a guess.
(e) Identify Possible Solutions – In the solutions section, attach each solution to the specific cause it controls. Assign an owner, due date, and decision status (approved, evaluating, rejected).
(f) Pick the right set – Select the cheapest combination of solutions that reliably prevents recurrence. You don't need to fix every cause on the map.
About the Example
The example investigates a warehouse slip-and-fall injury. An employee slipped and sprained an ankle in aisle 4 on 14 Jul at 14:20 during shift change, creating a lost-time safety incident and 45 minutes of downtime.
The cause map branches into two independent causes that both had to be present: a water leak from a worn pipe joint (no inspection schedule existed) and no wet-floor sign posted (the spill went unreported for 40 minutes). Evidence includes maintenance logs, cleaning rota, CCTV timestamps, and a seal inspection report.
Three solutions were identified, each targeting a different cause: replace the seal and introduce quarterly pipe inspections (Facilities, approved, due 5 Sep); store wet-floor signs at each aisle end (Operations, approved, due 25 Aug); and a 15-minute floor walk at every shift change (Shift leads, evaluating, due 1 Sep). The example illustrates how the map branches from a single event into multiple contributing causes and how solutions address different points on the map rather than searching for one single root.
Cheers!
Khawaja Rizwan