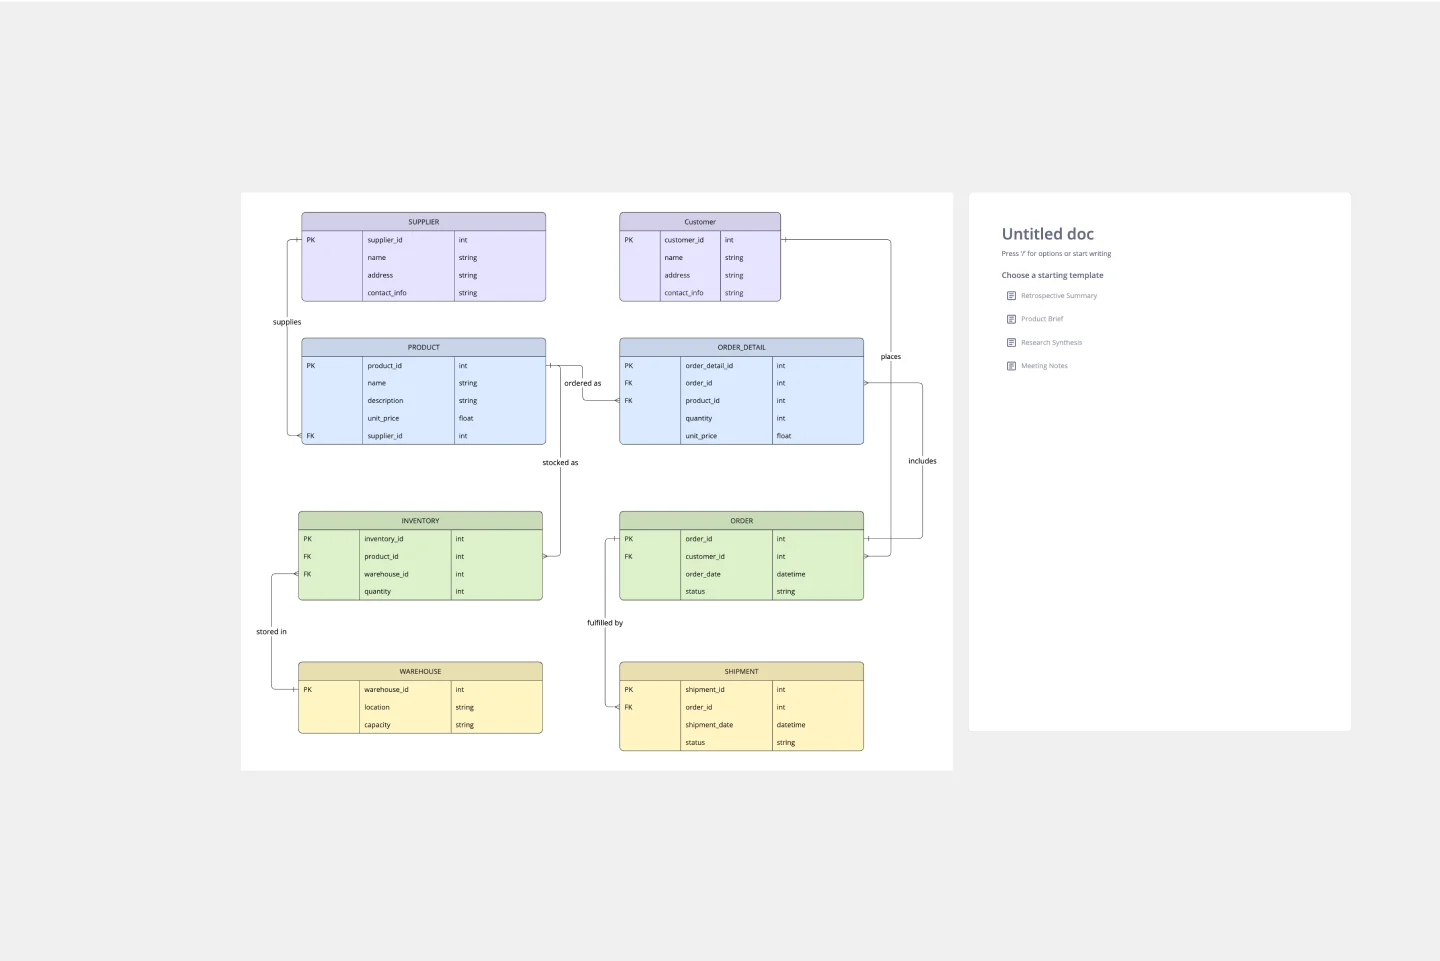
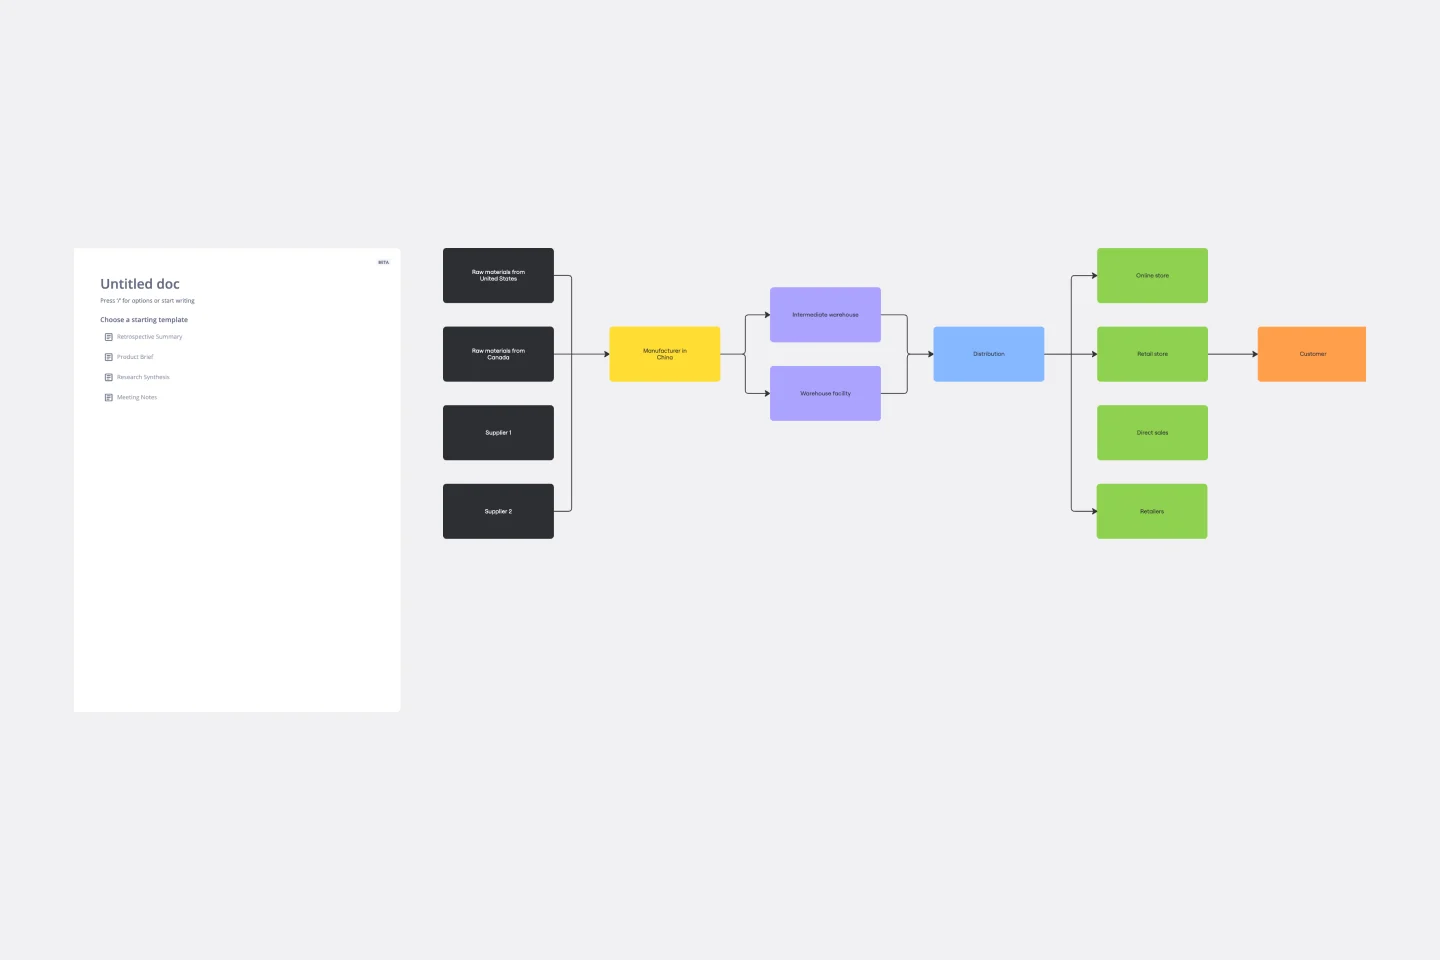
Linear Flow Supply Chain Diagram
The Linear Flow Supply Chain Diagram template is a comprehensive visual framework designed for supply chain managers, operations teams, and business leaders who need to map, analyze, and optimize their complete supply chain journey. This template transforms complex supply chain operations into a clear, linear flow from raw material sourcing through to final customer delivery, making it easy to identify partners, quantify performance, and spot improvement opportunities at every stage.
Structure & Stages
The template organizes your supply chain into five sequential stages, each marked with a numbered indicator and color-coded header that flows from dark navy to light blue:
Stage 1: SOURCE + SUPPLIERS — Identifies raw materials, components, and the partners who provide them, establishing the foundation of your supply chain.
Stage 2: MANUFACTURING — Maps where inputs transform into finished products, including plants, EMS lines, and co-packing operations.
Stage 3: DISTRIBUTION — Captures warehousing, freight logistics, and the route to market infrastructure.
Stage 4: RETAIL + CHANNELS — Defines the sales channels that connect your product with buyers.
Stage 5: CUSTOMER — Documents the end buyer experience, including service, returns, and loyalty programs.
Each stage includes three rows of placeholder boxes for capturing: key partners and operators, core activities performed, and critical metrics (lead time, cost, and KPIs specific to that stage).
Below the main flow, a Flow Health Metrics section tracks four essential KPIs: total lead time from PO to shelf, inventory turns per year, on-time in-full delivery percentage, and landed cost per unit.
How to Use
Work systematically from left to right across the five stages. Begin by identifying and naming all key partners in each stage—the suppliers, manufacturers, logistics providers, and channel partners involved. Next, document the core activities that occur at each stage. Then assign one critical number per stage in the metrics row (lead time, cost, or another relevant KPI).
Complete the exercise by filling in the four flow health metrics at the bottom. If you cannot populate one of these metrics, you've identified your first improvement project—the template doubles as a diagnostic tool for supply chain visibility gaps.
Cheers!
Khawaja Rizwan