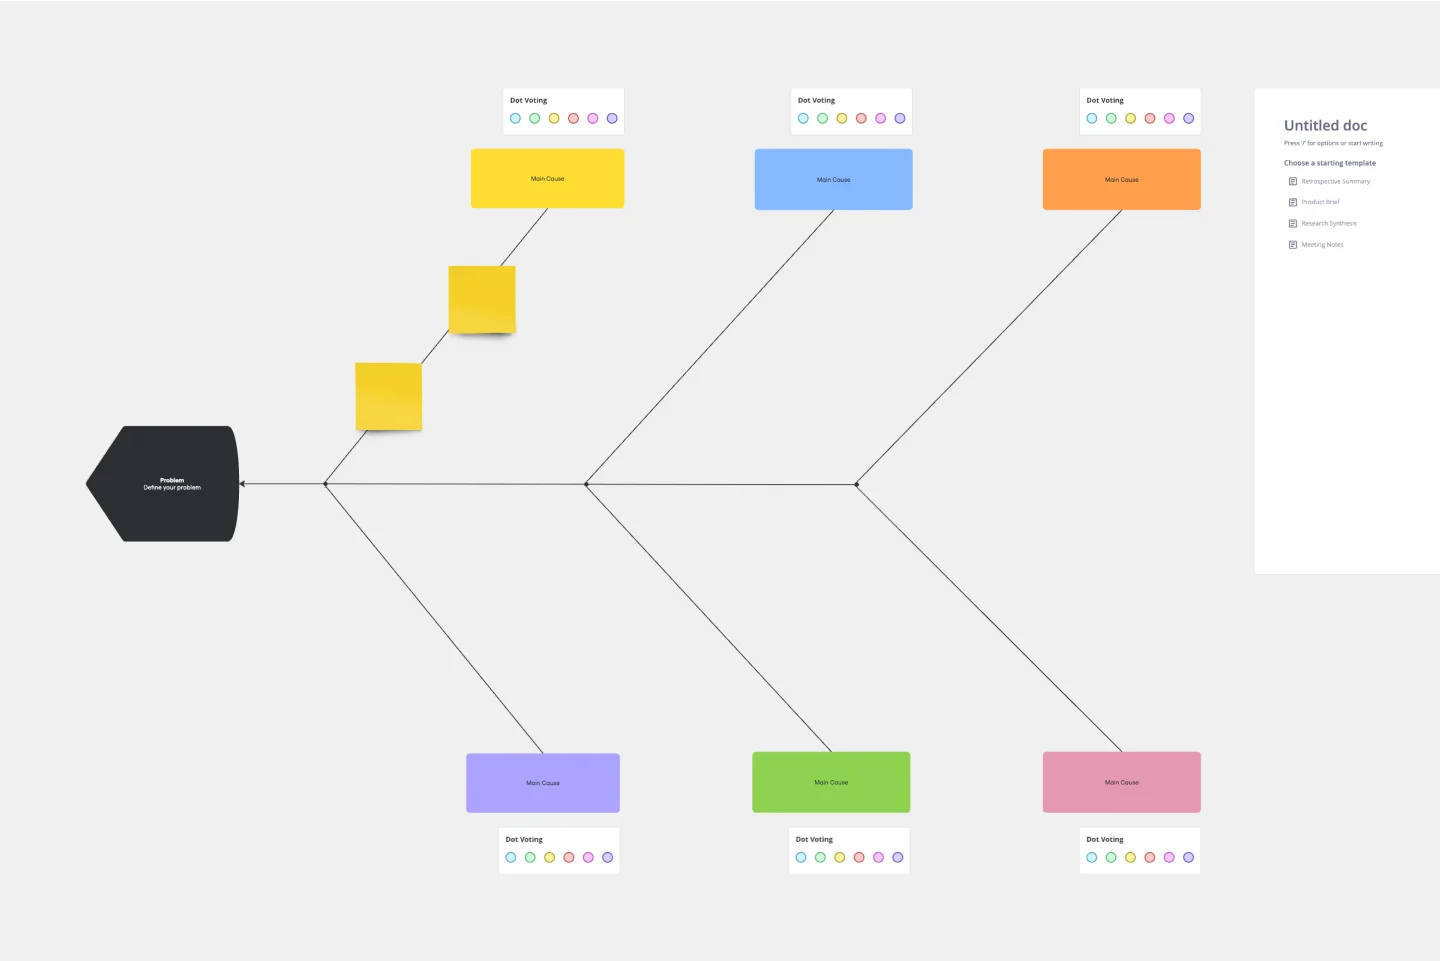
What it is for: A fishbone diagram, also called an Ishikawa or cause-and-effect diagram, maps the possible causes of one problem. You leave with a full picture of the possible causes of one effect, grouped into families, with evidence noted where you have it and gaps marked where you do not, plus two or three causes to test and a named owner for each check.
Who it helps: Quality, operations and cross-department teams facing a problem with several causes, where each group sees a different part.
When to use it
When a problem seems to have several causes acting together.
When a team keeps arguing for its favourite cause and you need to see all of them side by side.
When a five whys chain keeps branching.
How to use it
Write a precise effect at the head, with a number and a time frame.
Draw four to six bones for cause families that fit your work.
Give everyone eight minutes to write causes silently, one per note, so quieter voices count.
Place causes on the bones, then ask why on the strongest ones.
Note evidence beside each cause, mark gaps, and pick two or three causes to check.
Tip: Spend more time on the effect than you think you need. A vague head produces a vague fish.
Credits and sources: Original Tiremesù worksheet and wording. Method credit: Kaoru Ishikawa. Further reading: ASQ https://asq.org/quality-resources/learn-about-quality
Full guide and film:https://www.tiremesu.com/guides/fishbone-analysis