What is the Concept Map in Science Template?
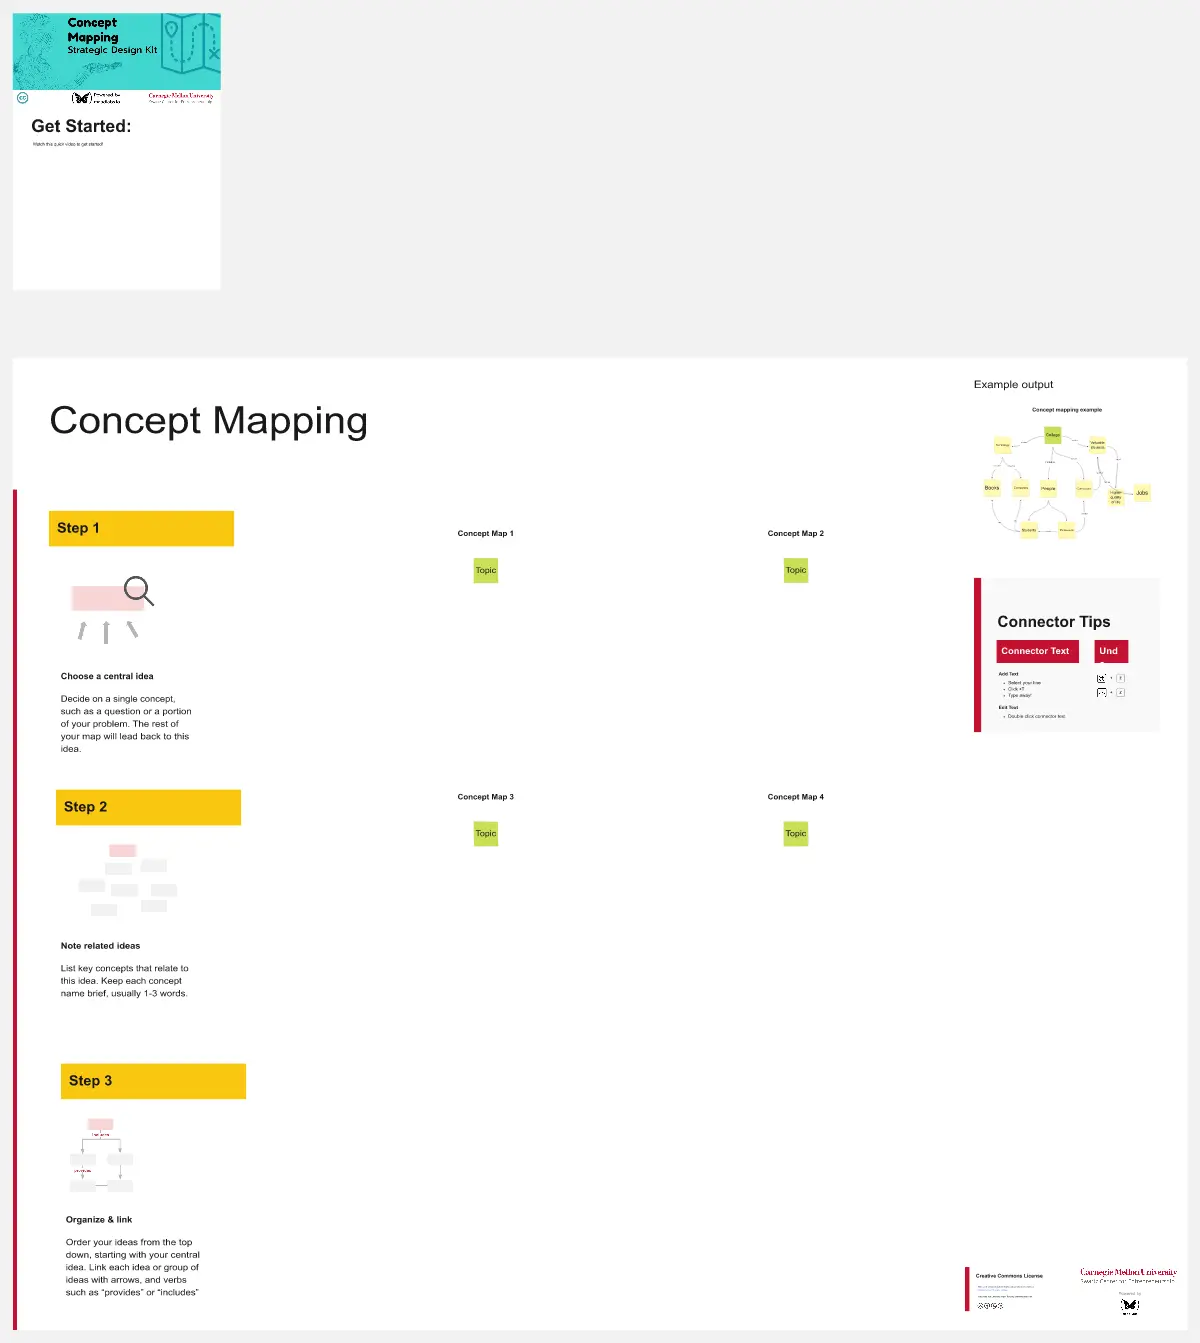
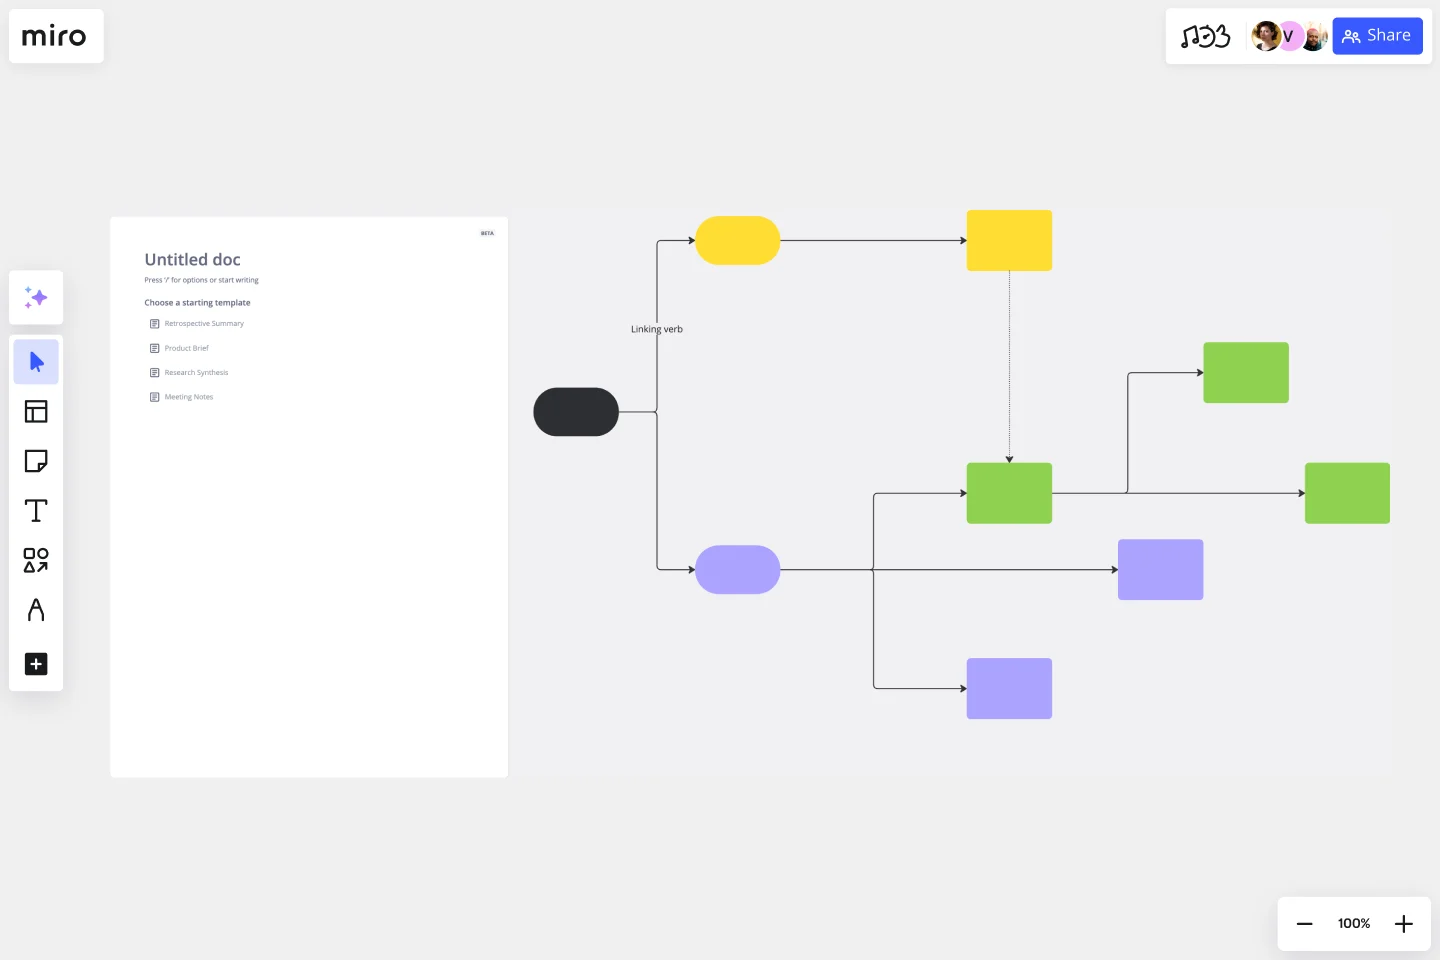
A visual learning template that helps users organize a science topic into four branches: definition, components, impacts, and comparison. Each branch connects to supporting facts or examples.
What problem does the Concept Map in Science Template solve?
Scattered science notes
Complex topics
Weak understanding of relationships
Difficulty comparing concepts
Poor recall of scientific facts
Unclear study structure
How to use the Concept Map in Science Template
Add the science topic to the center.
Create a definition branch.
List the topic’s main components.
Map major impacts.
Compare the topic with a related concept.
Connect each supporting idea with arrows.
Review facts for accuracy.
Add source links or notes.
Common Pitfalls
Using unsupported facts
Mixing definitions with impacts
Writing long paragraphs
Adding weak comparisons
Using arrows without clear meaning
Skipping source review
Ways to Avoid Mistakes
Use trusted science sources.
Keep each point brief.
Give each branch a distinct role.
Check every fact before presenting.
Label comparisons clearly.
Review the map with a teacher or subject expert.
Miro Features You Can Use
Shapes for topics and facts
Connectors for relationships
Color coding for branches
Comments for source notes
Sticky notes for research
Frames for presentation
FAQs
Q: Who can use this template?
A: Students, teachers, researchers, science teams, and study groups.
Q: What science topics work well?
A: Weather, ecosystems, biology, chemistry, physics, astronomy, and earth science.
Q: How many branches should the map include?
A: Four main branches work well for this layout.
Q: How many supporting ideas should each branch have?
A: Four to five supporting ideas keeps the map readable.
Q: What will participants leave with?
A: A completed science concept map with accurate facts, clear relationships, and a strong visual structure.